Anatomy of a Pandemic Recovery Across Sectors and Regions
Many have highlighted the disproportionate effect of the COVID-19 pandemic on certain sectors of the economy. The Bureau of Labor Statistics publishes data on employment by sector and state, which can show the fall and recovery in employment over the past two years at a disaggregated level. We find that just four of 10 sectors account for 75 percent of the fall in total employment during the pandemic. State-sector pairings with more dramatic falls in employment tended to see faster recoveries to compensate, indicating these job losses were often temporary separations. We also find evidence that the recovery in employment — particularly in the Leisure and Hospitality sector — has been faster in states with higher vaccination rates.
The onset of the COVID-19 pandemic and the various lockdown measures meant to slow the spread of the virus resulted in an unprecedented contraction in employment in April 2020. Yet, the effects of the pandemic on employment were not felt evenly across different sectors of the economy, nor across different states. For example, the Leisure and Hospitality sector was significantly disrupted by public health guidance to avoid large gatherings. Also, attention has been brought onto states that have seen particularly large COVID-19 outbreaks, such as New York City in 2020 and Florida in 2021.
The Bureau of Labor Statistics (BLS) publishes data on employment that are disaggregated across sectoral and regional dimensions. In this Economic Brief, we review these data and outline the stark differences in the pandemic's effects on employment across these dimensions. We also characterize, at this disaggregated level, differences in the relative pace of the subsequent recovery in employment across sectors and regions.
The Fall and Recovery in Employment
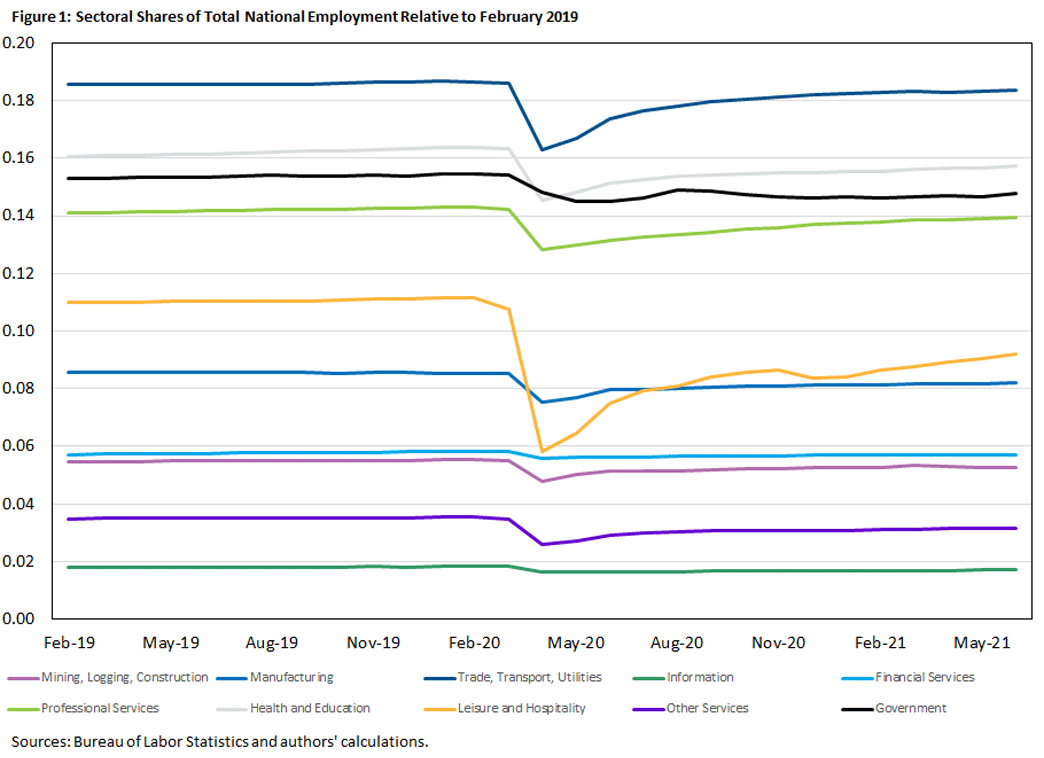
Figure 1 breaks down employment across 10 mutually exclusive and exhaustive sectors defined by the BLS. Employment in Figure 1 is normalized by total national employment in February 2019, representing approximately 150 million employed persons, age 16 and over. We normalized employment relative to February 2019 to compare subsequent events against a baseline where the virus (first identified in December 2019) could not have plausibly had any impact on employment.
This figure shows that just five of the 10 sectors accounted for roughly 75 percent of total employment:
- Trade, Transportation and Utilities (TTU)
- Health and Education
- Government
- Professional and Business Services
- Leisure and Hospitality
In addition, four of these sectors — TTU, Health and Education, Professional and Business Services, and Leisure and Hospitality — collectively accounted for approximately 75 percent of the decline in employment from March 2020 to April 2020, representing 16 million of the 21 million jobs lost at the onset of the pandemic.
These are also the sectors that have been commonly thought of as being disproportionately affected by the pandemic. For example, TTU includes retail trade, which involves frequent contacts with the public. Health and Education, to take another example, may be seeing the negative employment impacts from the pandemic because of the suspension of elective medical procedures in hospitals and the move to remote instruction in schools.
Leisure and Hospitality saw the largest contraction in total employment by a large margin. This is unsurprising, given that this sector includes establishments such as bars, restaurants, theaters and hotels, which were largely shut down during the initial lockdown and may still be subject to capacity restrictions.
As of June 2021, no sector has fully recovered to its February 2019 employment level. In fact, some sectors (such as Manufacturing and Information) have made virtually no gains in employment since an immediate recovery in the few months following the initial trough in employment. This potentially points to permanent losses in employment in these sectors, perhaps because the pandemic incentivized a shift to labor-saving technologies or workers remain reluctant to work in these sectors. While these slow-to-recover sectors tend to be small, they collectively account for around 2.3 million of the 6.6 million jobs yet to be recovered.
Sector Employment by Region
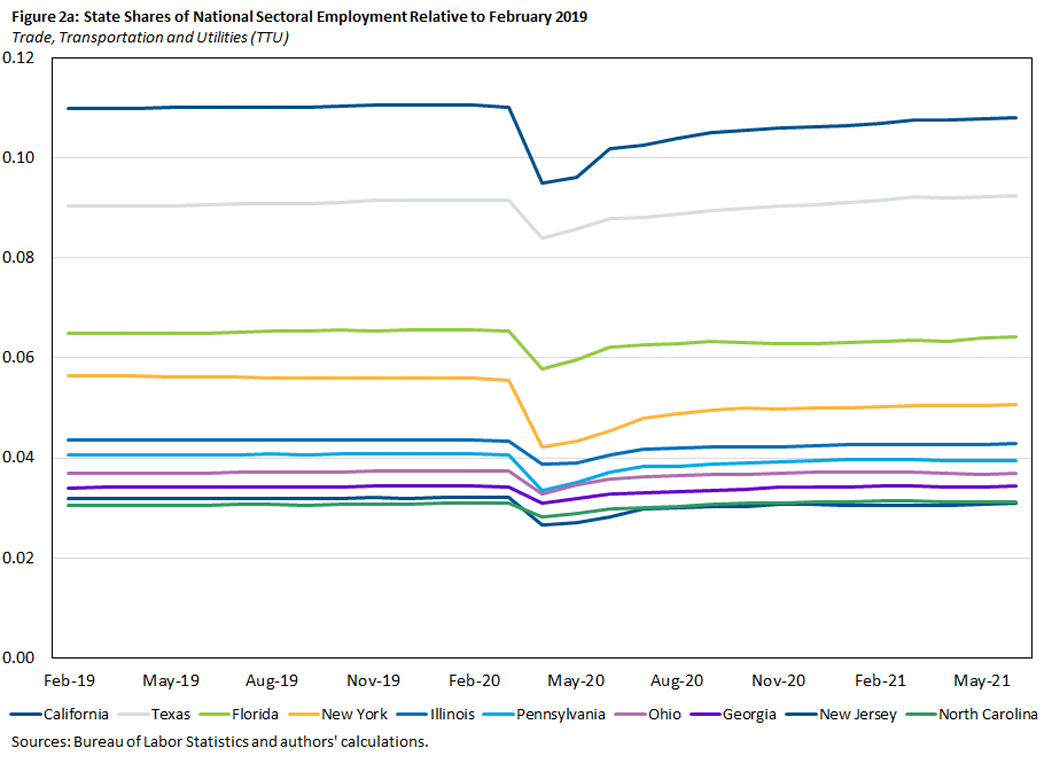
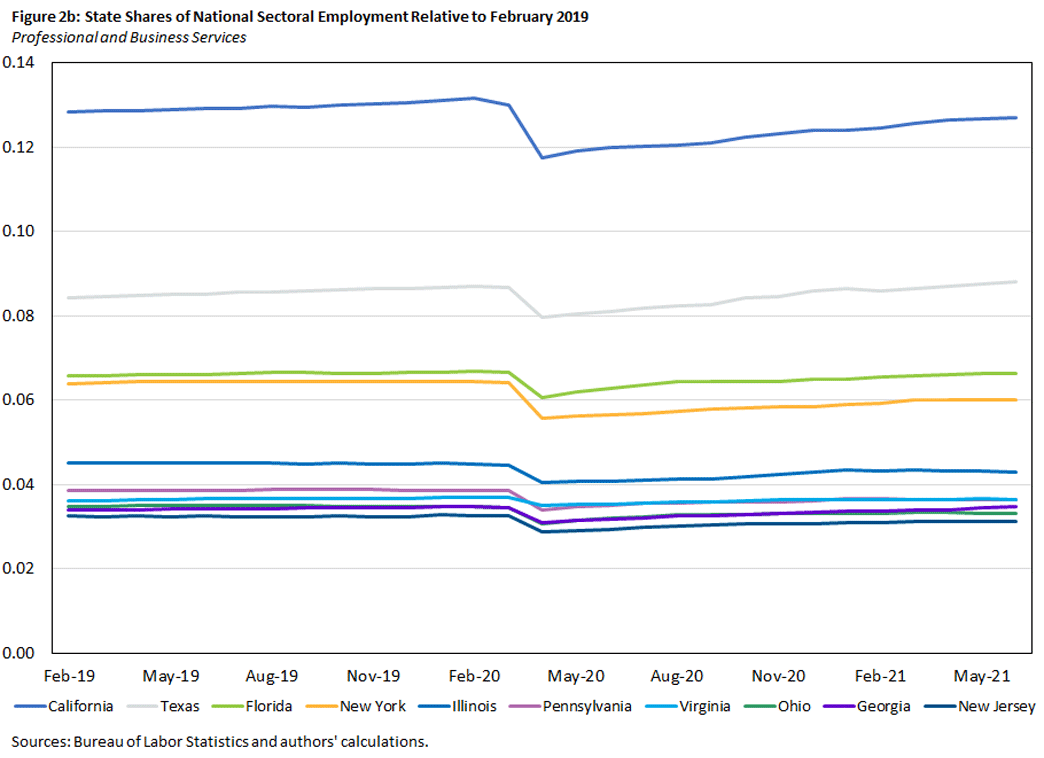
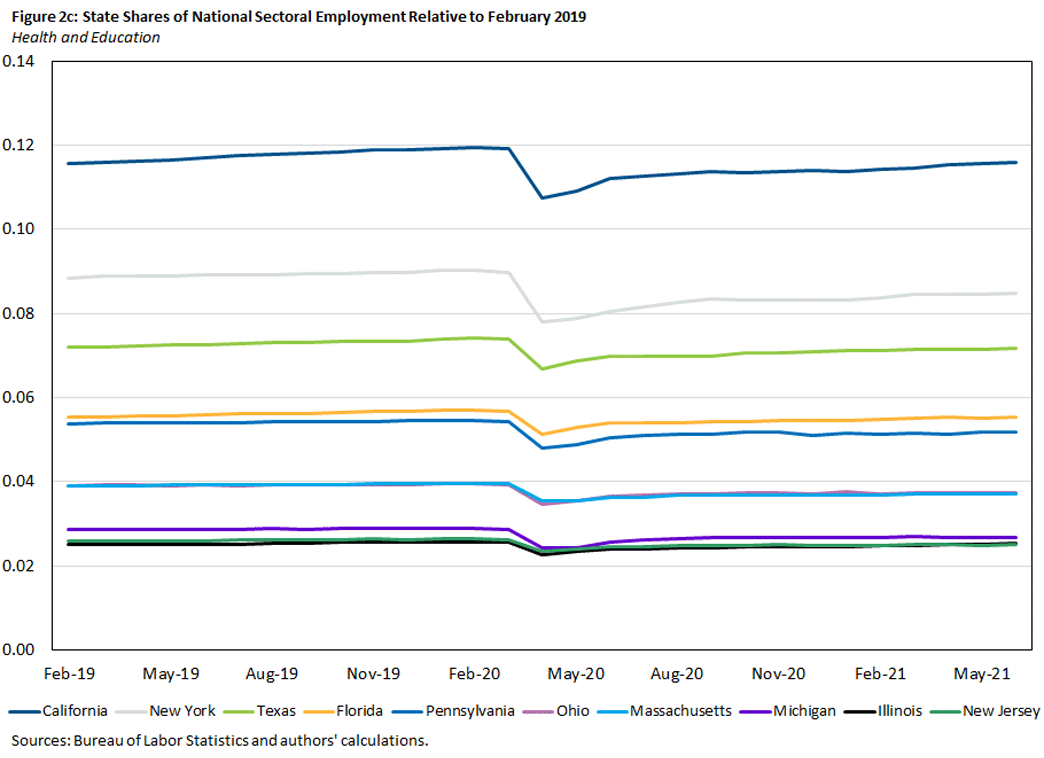
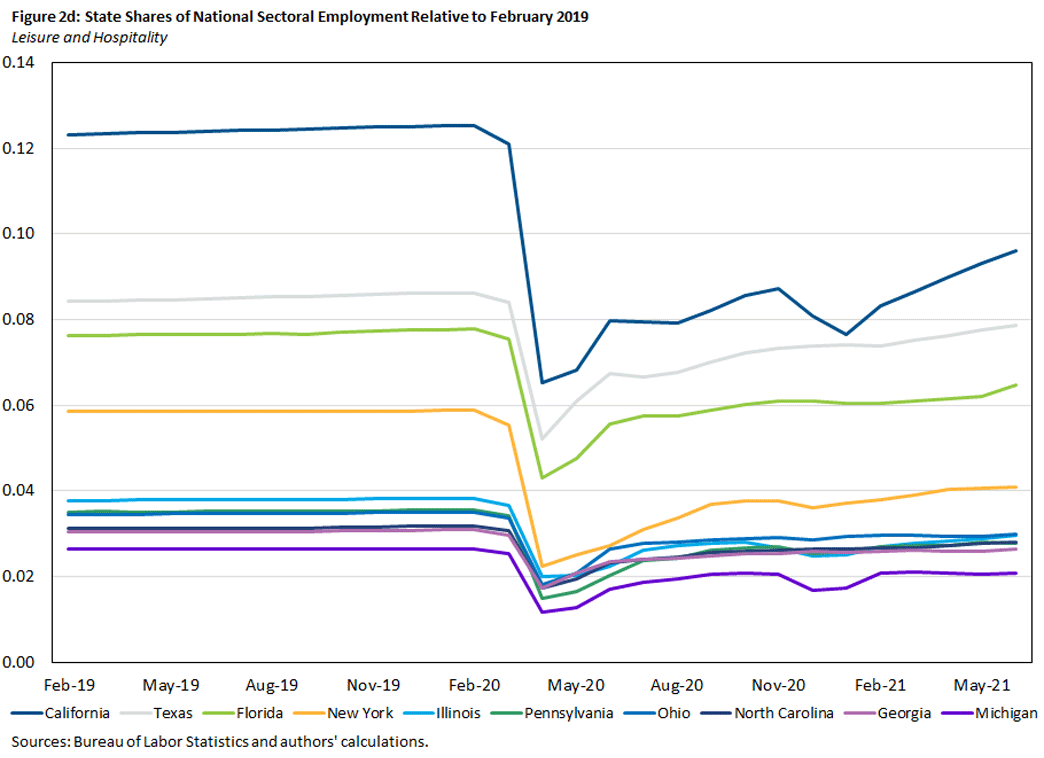
Figure 2 disaggregates Figure 1 for the four sectors that accounted for 75 percent of the decline in employment in 2020. The top 10 states in terms of employment in each sector are shown and normalized to February 2019.1
This figure underscores how the effects of the pandemic were both sectorally and regionally concentrated. Overall, these 40 state-sector pairs — out of a possible 510 state-sector pairs across our 10 sectors and 50 states plus Washington, D.C. — account for more than 41 percent of the decline in aggregate employment, representing around 9 million of the 21 million jobs lost in 2020 from March to April. Yet, even among these 40 state-sector pairs, there is some variation in how harshly they were affected by the pandemic. California, for example, shed a higher share of its employment in Leisure and Hospitality than Texas or Florida.
Recession and Recovery by State and Sector
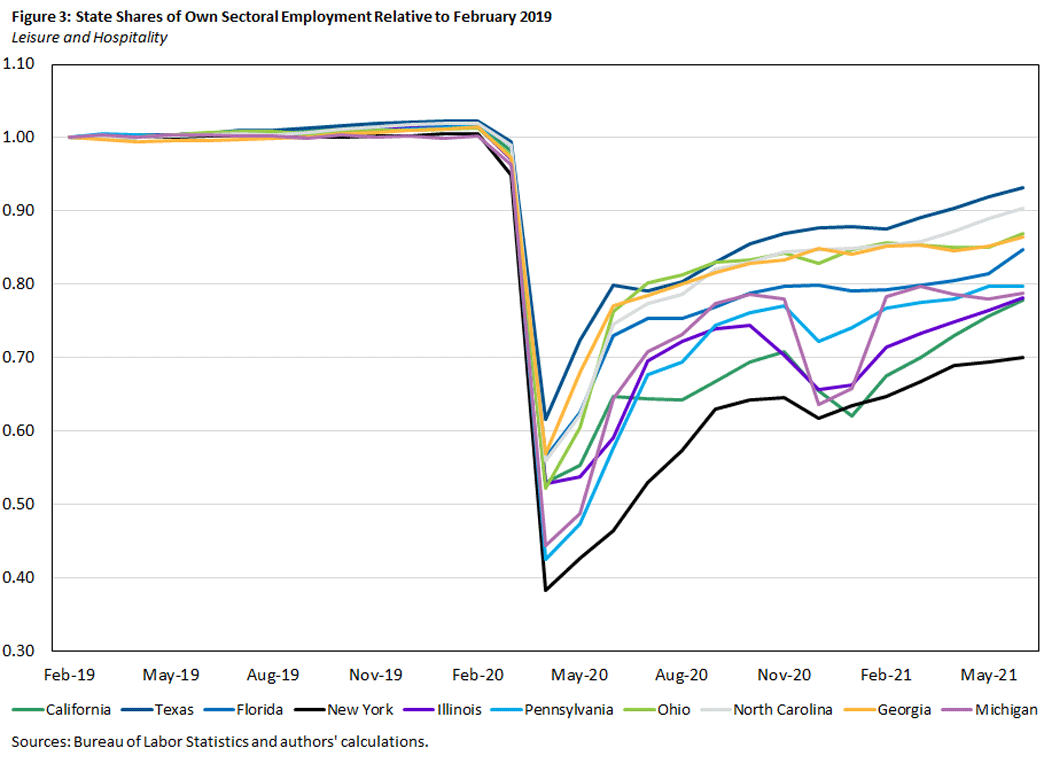
To better see the variation in recession depth and recovery pace between states, we can also normalize sector employment at the state level to its own employment in that sector in February 2019. Figure 3 displays this for the Leisure and Hospitality sector as an example, and figures for the TTU, Health and Education, and Professional and Business Services sectors can be found in the appendix.
We find that the top 10 states are generally toward the middle or bottom of the distribution with respect to both the initial fall in employment and the relative standing as of June 2021. In general, states with steeper declines in employment at the beginning of the pandemic appear to have subsequently seen faster recovery rates. Even so, there is still a large degree of variation in where states are as of June 2021.
Leisure and Hospitality saw the steepest declines overall. Some smaller, less impacted states have recovered employment almost to their own February 2019 level. Conversely, New York — a large state that at one point shed more than 60 percent of its jobs in this sector — is still at less than 75 percent of its own February 2019 level of employment in this sector.
Focusing on the Recovery
We now turn to the recovery in employment to highlight some of the factors that have influenced the relative pace of recovery across different regions and sectors. This will also help explain the large degree of variation in recovery rates observed in Figure 3.
Figure 3 suggested that states and sectors with steeper falls in employment at the onset of the pandemic saw faster recoveries in employment in percentage point terms relative to their own employment level in February 2019. In the next figures, we study this relationship in more detail.
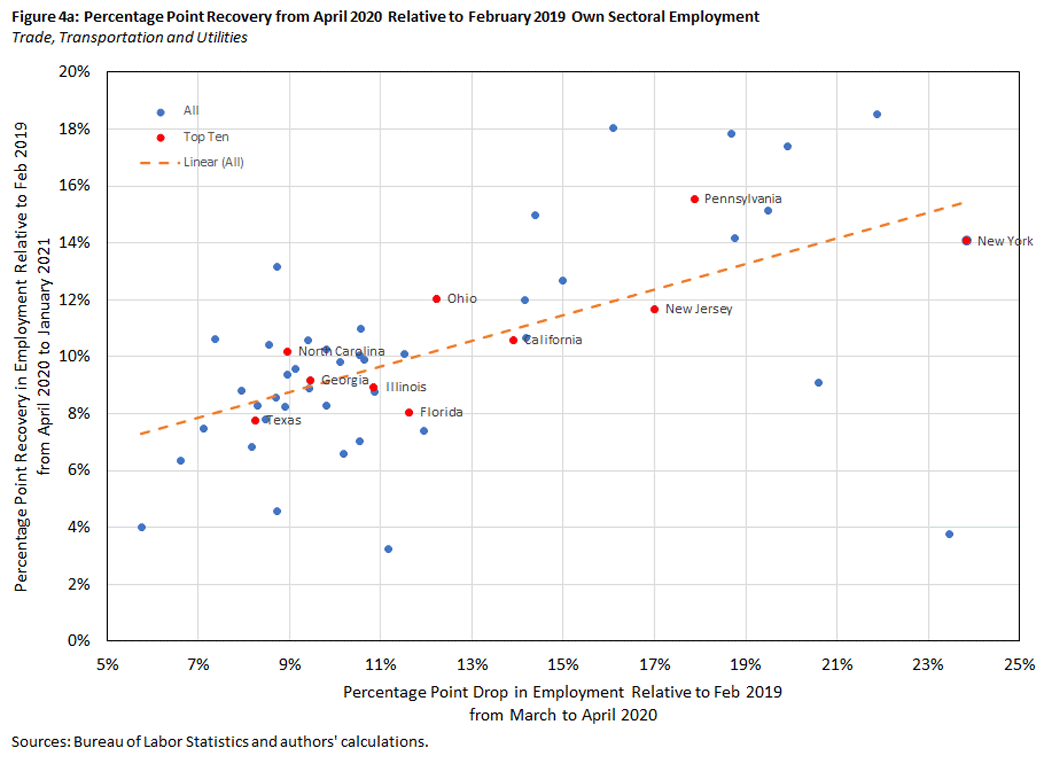
The x-axis for Figures 4a and 4b shows the percentage point fall in employment in a given state for the TTU sector from March to April in 2020. (Similar figures for the Professional and Business Services and the Health and Education sectors are available in the appendix. These figures follow similar patterns to the figures for TTU.) The y-axis reflects the subsequent percentage point recovery, with Figures 4a and 4b having y-axes that reflect percentage point recovery in 2020 and 2021, respectively. Highlighted in red are states that were in the top 10 for employment in that sector.
In Figure 4a, there is a statistically significant positive relationship between the depth of the fall and the pace of the recovery in 2020. This can be interpreted as a "low-hanging fruit" effect. Early in the pandemic, much of the variation between states in the initial employment fall likely reflected the effects of early lockdown policies causing temporary layoffs, as opposed to permanent job losses. These policies varied in strictness and length across states, accounting for observed variation in the fall in employment.
However, the relationship in Figure 4b — while still positive — is much weaker. Put another way, most of the low-hanging fruit has been picked, and most of the remaining jobs left to recover reflect more permanent separations instead of temporary layoffs. This is also seen in the slowing pace of the overall recovery in employment.
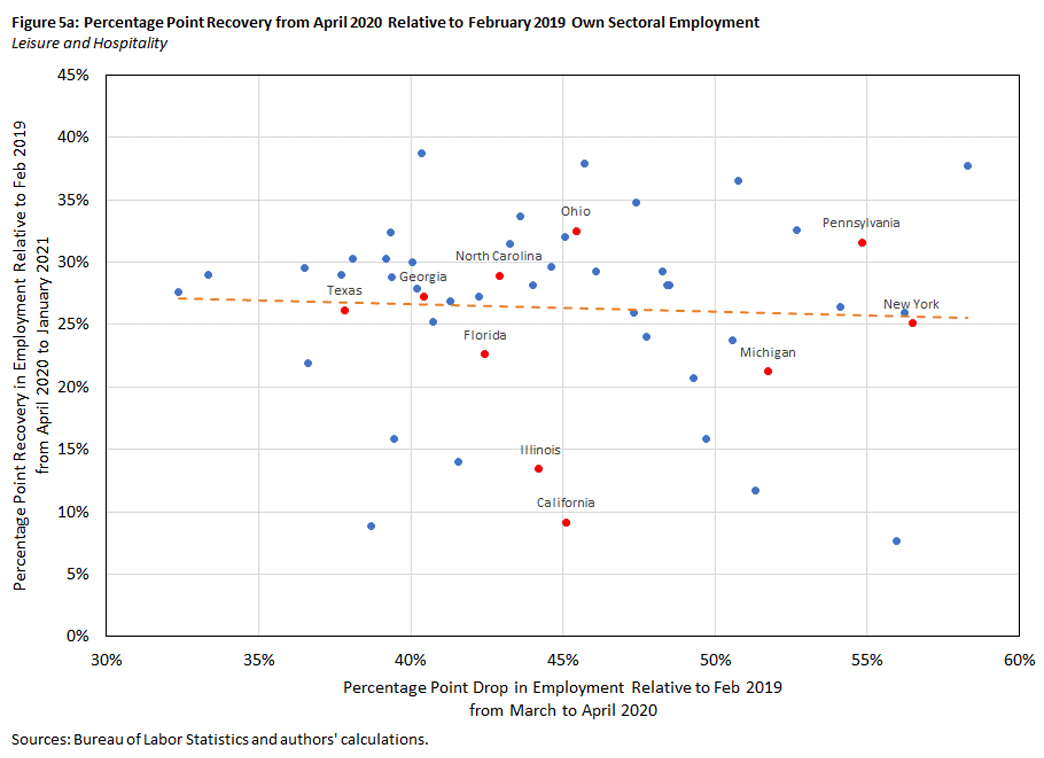
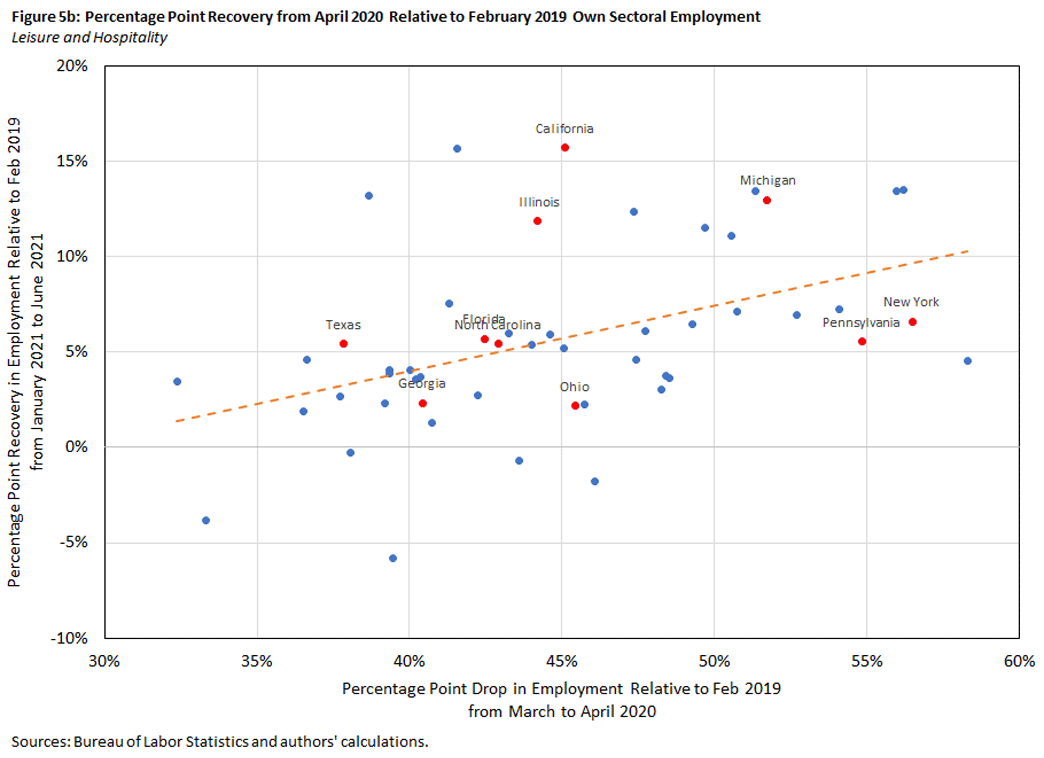
The major exception to this narrative is the Leisure and Hospitality sector, as seen in Figures 5a and 5b.
There is no apparent relationship between the depth of the fall in employment in a state and its subsequent recovery in 2020, but there is a positive relationship for the recovery in 2021. This sector was subject to the harshest lockdown restrictions of any sector, with indoor capacity restrictions severely affecting the operations of bars, restaurants and related establishments. Especially in 2020, states varied in the degree to which they imposed such measures on the Leisure and Hospitality sector. The data would seem to indicate that those who imposed harsh measures in the early days of the pandemic (as indicated by a rapid fall in employment) later kept many restrictions in place for the rest of 2020, slowing the pace of employment recovery in this sector.
Relationship Between Vaccines and Employment Recovery
One important development for the recovery in 2021 has been the widespread distribution and use of vaccines for COVID-19. There are stark differences between states with respect to the share of their population that has been vaccinated as of August 2021. This allows us to ask what (if any) impact the vaccine rollout may have had on the recovery in employment in different sectors. The direction and magnitude of this relationship is ex ante ambiguous.
On the one hand, it seems obvious that vaccinated people will be more willing to join large public gatherings and that prospective employees would feel more comfortable accepting jobs that involve interacting with the public in an area with a high vaccination rate. This would result in us observing a positive correlation between vaccination rates and employment recovery.
On the other hand, this effect is likely to be mitigated or even absent in sectors where interactions with the public are limited or where people have been reluctant to return to work given new expectations about work conditions — such as wages or flexibility of work — separate from virus-related concerns.
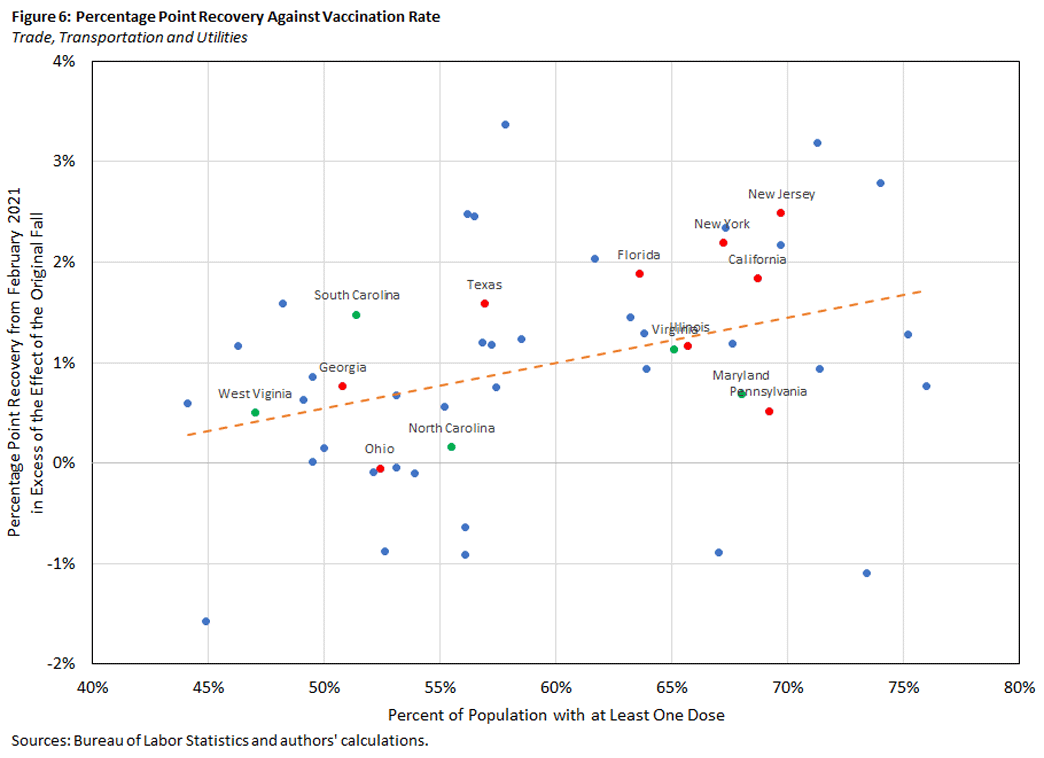
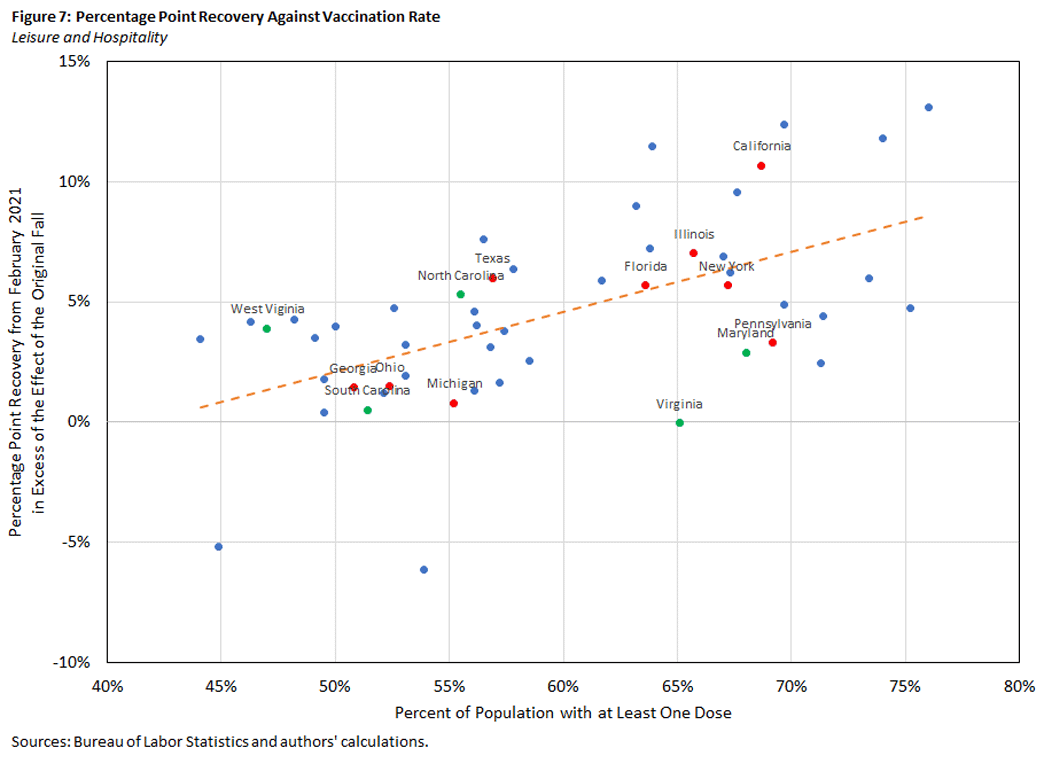
Figures 6 and 7 plot the share of a state's population that has received at least one dose of the vaccine as of August 2021 against the excess percentage point recovery in employment from February 2021 (which was around when vaccines started being available on a widespread basis) through June 2021 for the TTU and Leisure and Hospitality sectors. (The sectors are displayed as the relationships are statistically significant at the 5 percent level. Similar figures for the Professional and Business Services and the Health and Education sectors are available in the appendix, though it should be noted that these relationships are not statistically significant.)
By 'excess' recovery, we mean the recovery in employment over this time span over and above that predicted by the initial fall in employment, as in the regressions highlighted in Figures 4 and 5.
Highlighted in red are the top 10 states again, and in green the states that make up the Fifth District of the Federal Reserve System.
In general, the magnitude of the 2021 employment recovery is increasing with vaccination rates. The fact that the relationship within these two sectors is statistically significant makes intuitive sense: These sectors involve frequent contacts with the general public, and vaccines may provide both prospective employees and consumers with the freedom to interact with less fear of catching or transmitting the virus.
This positive relationship is particularly strong for Leisure and Hospitality. We estimate that a 1 percentage point increase in the share of the population that has received at least one dose of the vaccine is associated with, on average, an extra 0.25 percentage point recovery in that state's employment in Leisure and Hospitality relative to its level of employment in the same sector as of February 2019.
Andrew Foerster is an economist with the Federal Reserve Bank of San Francisco. Nicholas Garvey is a research associate and Pierre-Daniel Sarte is a senior adviser, both in the Research Department at the Federal Reserve Bank of Richmond.
These states tend to be the largest by population. California, Florida, Illinois, New York and Texas make the top 10 in all four sectors, for instance. However, there is also some variation. Virginia, for example, appears in the top 10 only for Professional Services, and Massachusetts appears only for Health and Education.
This article may be photocopied or reprinted in its entirety. Please credit the authors, source, and the Federal Reserve Bank of Richmond and include the italicized statement below.
Views expressed in this article are those of the authors and not necessarily those of the Federal Reserve Bank of Richmond or the Federal Reserve System.
Receive a notification when Economic Brief is posted online.


