A More Comprehensive Measure of the Black-White Wealth Gap
Economic Brief
May 2022, No. 22-17
In this article, we apply a simple graphical device — the plot of the relative rank distribution — to summarize the Black-White wealth gap. We also introduce the relative rank Gini coefficient — an analog to the standard Gini coefficient — as a summary measure of rank inequality. We find that the rank wealth gap is widest in the middle of the wealth distribution. Black-White rank wealth gaps are higher among college graduates than among other education groups. Households with young or retired heads have higher rank gaps than middle-aged households. We caution that rank gaps are not necessarily informative about gaps in levels.
It is widely known that Black households receive considerably less income and hold considerably less wealth than White households.1 Describing these gaps more precisely, however, can be challenging. In this article, we apply a simple graphical device — the plot of the relative rank distribution — to summarize the Black-White wealth gap.2 We also introduce the relative rank Gini coefficient — an analog to the standard Gini coefficient, which measures inequality — as a summary measure of rank inequality.
Measurements of the Wealth Gap
The most commonly used summary statistics — the mean and the median — have significant limitations. Means can be distorted by a handful of very large or very small values. For instance, a few extremely wealthy households in one group can significantly raise that group's mean and create a large gap in mean wealth. Differences in medians are useful for comparing households in the middle of their respective distributions but provide no information about differences at the top or the bottom.
Other measures have notable limitations as well. Comparisons based on more detailed measures (such as deciles) are often quite cumbersome. Another concern is making comparisons across time. Suppose that the incomes of every Black and White household doubled. The mean and median income gaps would immediately double as well, even though the households' relative positions were unchanged.3
In our analysis, we begin by comparing current wealth gaps to income gaps as the two are tightly related: Wealth largely reflects savings out of income. We then examine how the wealth gap varies within subgroups defined by education, age, gender and marital status. Finally, we look at how the wealth gap has changed over time.
Our data source is the Survey of Consumer Finances (SCF), a survey conducted by the Federal Reserve Board that includes unique information on the balance sheets, income and demographics of U.S. families. Our measure of wealth is net worth: the value of a family's financial and nonfinancial assets net of all its debt.
Measuring Inequality
To illustrate how we construct relative rank distributions, consider the wealth deciles shown in Table 1, calculated from the 2019 wave of the SCF.
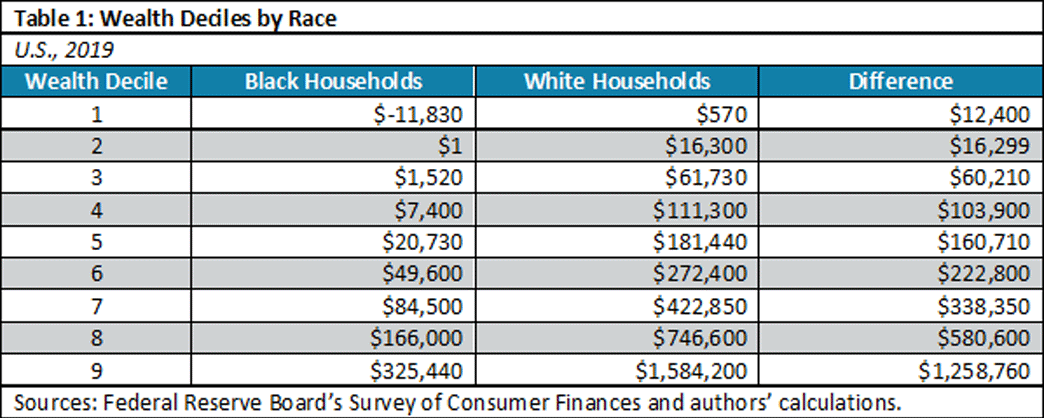
The sixth decile (60th percentile) for Black households is $49,600. A White household with $49,600 of wealth would rank much lower in its distribution, near the 28th percentile. A Black household at the 60th percentile of its distribution thus has a relative rank of 28 percent in the wealth distribution of White households and a relative rank gap of 32 percentage points. In other words, 60 percent of Black households hold less than $49,600 in wealth, compared to 28 percent of White households. This calculation can be repeated at every rank of the Black wealth distribution to produce a continuous curve. Figure 1 shows this curve: the relative rank distribution for household wealth.
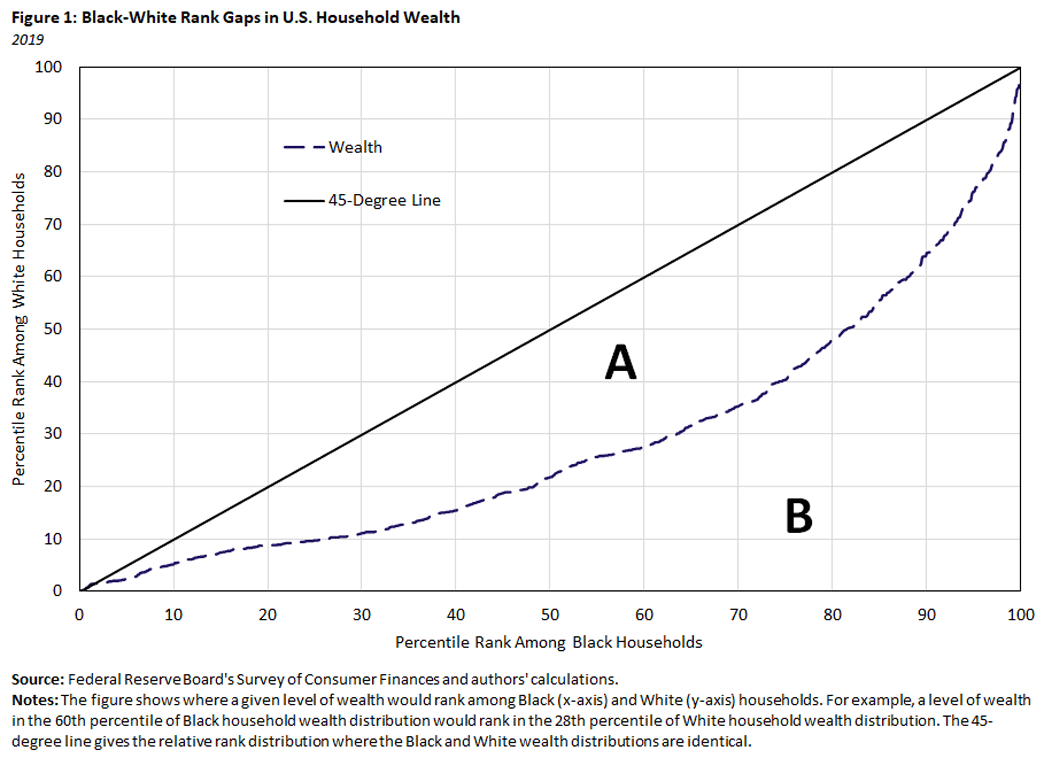
An important reference point is the 45-degree line, which gives the relative rank distribution when the Black and White wealth distributions are identical. The size of the area between the 45-degree line and the relative rank distribution (indicated by A in Figure 1) thus measures overall wealth inequality. Dividing this amount by the total area under the 45-degree line (the sum of areas A and B) yields the relative rank Gini coefficient.
As with the standard Gini coefficient, higher values of the relative rank Gini coefficient indicate higher levels of inequality. If the Black and White wealth distributions were identical, the coefficient would equal zero. In contrast, if the wealthiest Black household held no more wealth than the poorest White household, the coefficient would equal 1. The relative rank Gini coefficient for the wealth distributions shown in Figure 1 is 0.437.
Income and Wealth Inequality
Figure 2 plots the relative rank distributions of income and wealth.
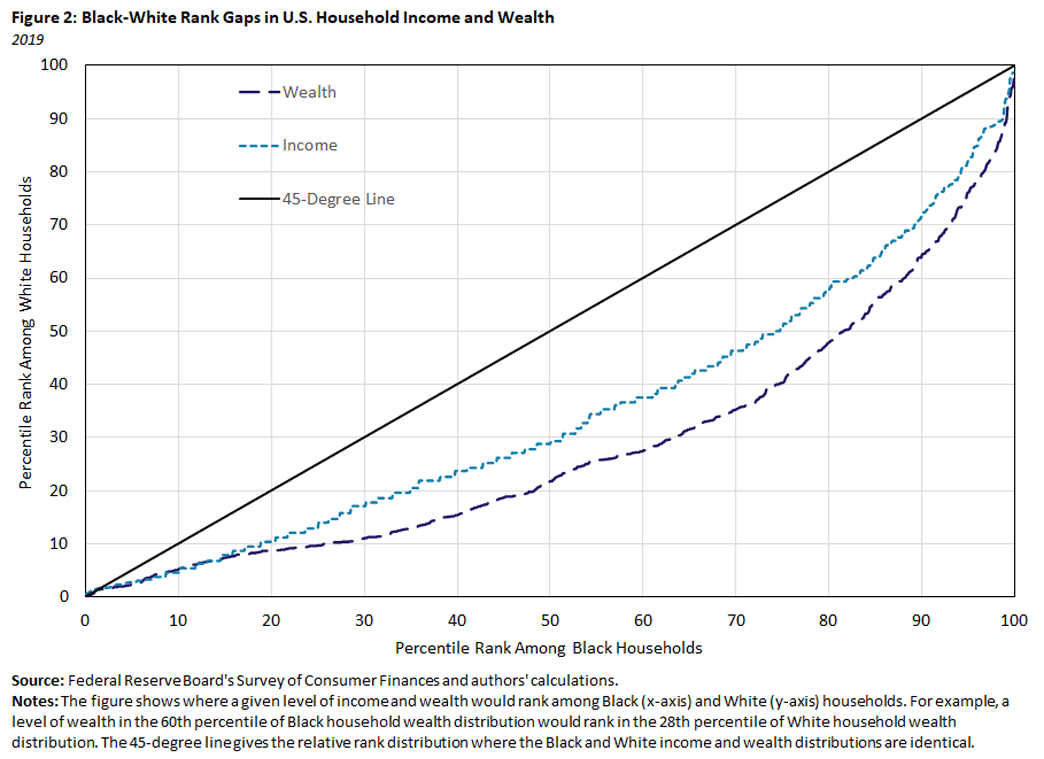
Observe that the income curve is closer to the 45-degree line than the wealth curve, reflecting that the rank gaps for income are smaller than those for wealth. The rank Gini coefficient for income is 0.312, considerably smaller than that for wealth.
At the bottom 20 percent of the distribution, the rank gaps for income and wealth are virtually identical, and both gaps close rapidly at the very top. Recent work has shown that the wealth measures in the SCF — which exclude the value of expected pension and Social Security benefits — imply larger racial wealth gaps than more comprehensive measures that include the benefit streams.4 We thus expect that the relative rank gaps for these broader wealth measures would be smaller than the wealth gaps shown here and would lie closer to the rank gaps observed for income.
A striking feature of both the income and wealth gaps is that they are widest in the middle of the distribution. The rank gaps for income are 12.9 percentage points, 22.5 percentage points and 18.4 percentage points at the 30th, 60th and 90th percentiles, respectively. The corresponding gaps for wealth are 18.9 percentage points, 32.4 percentage points and 25.5 percentage points, respectively.
Although the diminishing rank gaps at the tops of the distributions may hide expanding absolute gaps (see Table 1), they suggest that the Black-White gaps in income and wealth are not unique to the very rich or the very poor but are present at all levels of income and wealth.
Wealth Inequality Within Groups
The above comparison focused on wealth gaps between Black and White families as a whole. We now look at specific subgroups. Does the size of the wealth rank gap differ across education groups? Is the wealth rank gap larger for men or for women? For younger families or older ones? Has it grown or shrunk over time?
Figure 3 shows rank inequality within four education subgroups:5
- Those who didn't finish high school (denoted on the figure as "LTHS," or less than high school)
- Those who graduated high school but didn't attend college ("HS")
- Those who attended college without receiving a bachelor's degree ("SC," or some college)
- Those with at least a bachelor's degree ("CG," or college graduates)
Note that this calculation does not tell us how much wealth inequality is attributable to Black-White differences in educational attainment. Rather, it shows that Black-White wealth inequality exists within all education groups.
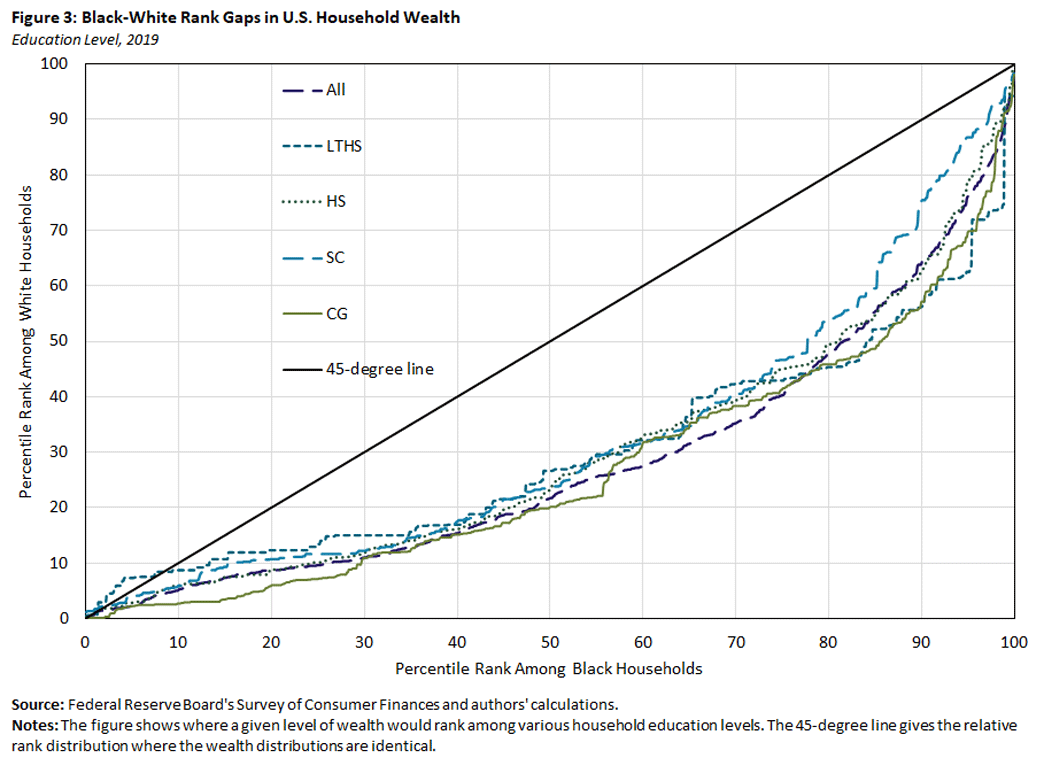
Notably, the Black-White rank gap is highest among college graduates. Their rank Gini coefficient (0.464) exceeds the unconditional Gini coefficient of 0.437. At the bottom of the wealth distribution, this at least partly reflects significant racial differences in student loans, as discussed in the 2016 report "Black-White Disparity in Student Loan Debt More Than Triples After Graduation." At the top, the gaps may reflect different rates of participation in high-earning professional occupations (such as medicine or law) or different patterns of educational attainment across multiple generations.
In contrast, those who didn't finish high school often have the smallest rank gaps: At the very bottom, Black LTHS families have more wealth than White LTHS families. Rank inequality is lowest among those with some college, especially at the top of the wealth distribution.
Figures 4 and 5 provide two sets of demographic comparisons. Figure 4 shows wealth rank gaps for single men, single women and couples.
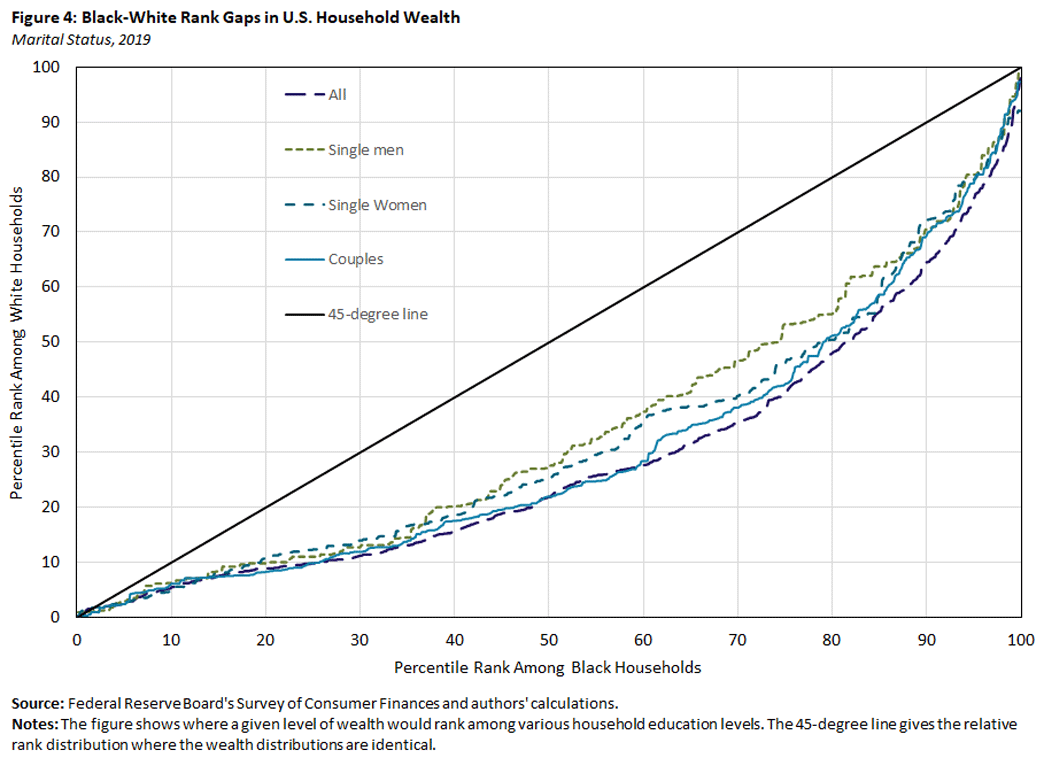
Couples have the largest gaps. This may reflect racial differences in marital sorting by income and wealth. Alternatively, this may reflect education, as highly educated individuals are more likely to marry.
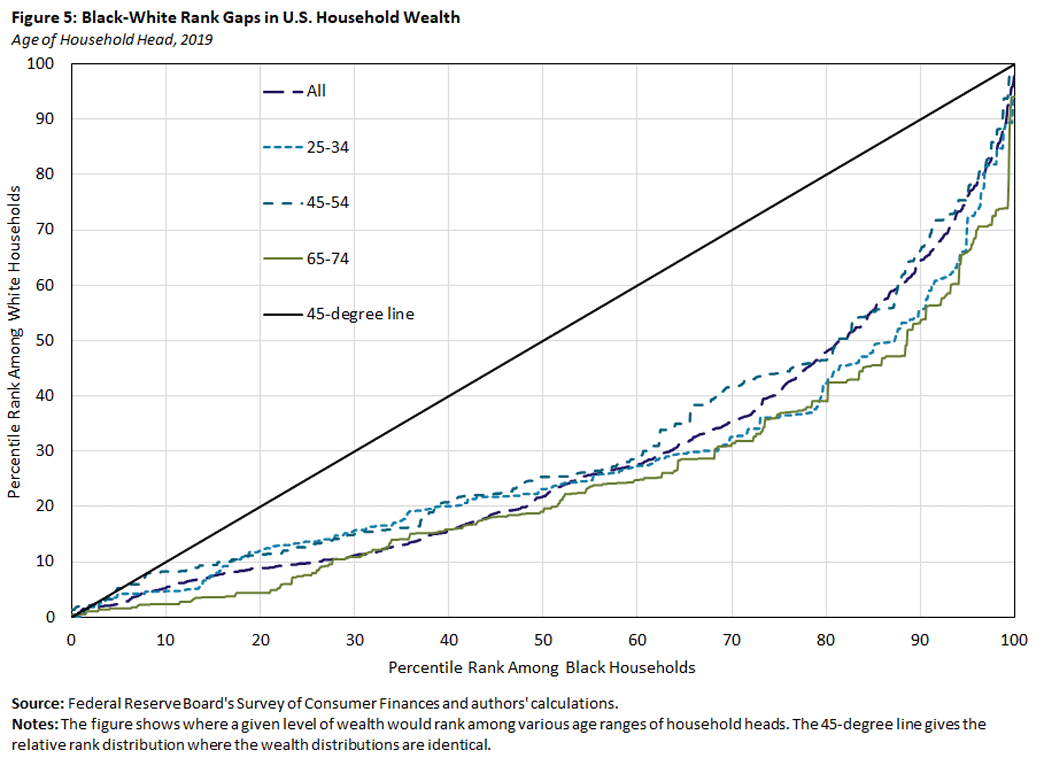
Figure 5 shows that rank inequality is lower for the middle-aged (ages 45-54) than for the young or the newly retired.
Wealth Inequality Over Time
The 2018 paper "Divergent Paths: A New Perspective on Earnings Differences Between Black and White Men Since 1940" points out that while the Black-White gap in median earnings has increased in recent decades, the rank gap has changed very little. The paper's authors take these findings to imply that most of the change in the level gap has been due to forces that have stretched the overall earnings distribution, such as changes in the returns to education or the distribution of wages across different occupations.
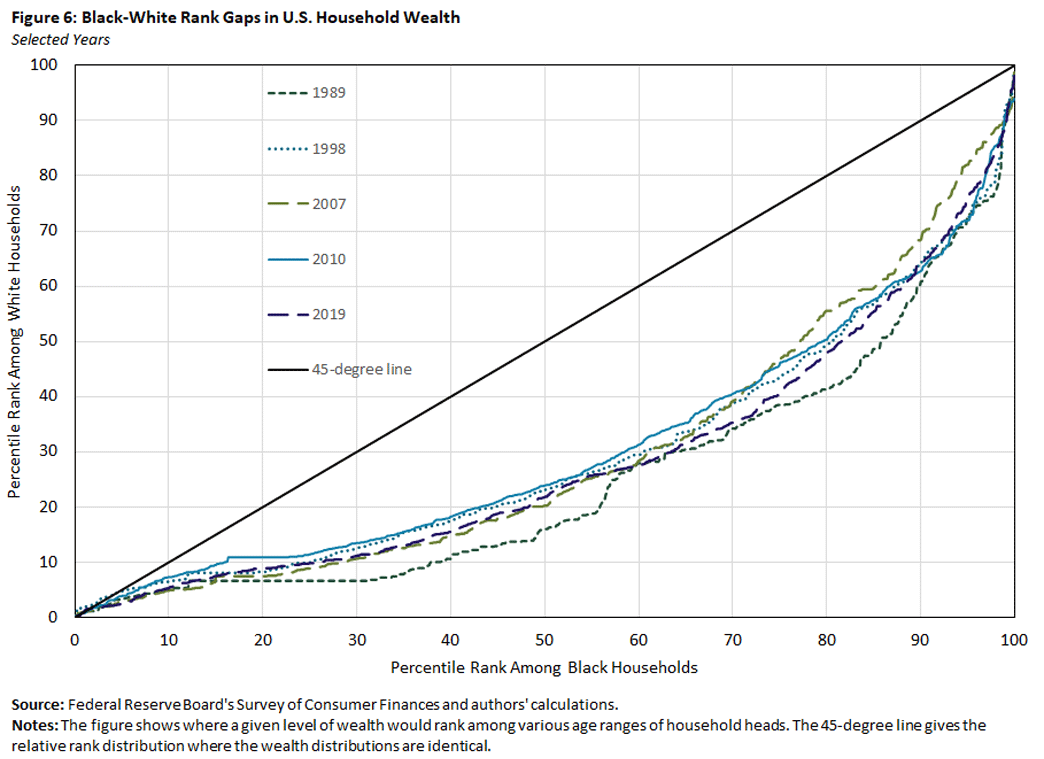
Figure 6 — which shows the rank gaps in wealth for selected years between 1989 and 2019 — paints a similar picture. Rank inequality decreased between 1989 and 1998, with the Gini coefficient falling from 0.500 to 0.415, but otherwise shows little trend.6
Conclusion
In this article, we showed how plots of the relative rank distribution and the relative rank Gini coefficients quickly summarize Black-White wealth gaps. These tools reveal that the wealth rank gaps are biggest in the middle of the wealth distribution (as opposed to its upper or lower tail), are largest among college graduates and are larger among households whose heads are young or recently retired. Comparisons over the past 30 years show the wealth rank gaps to be stable.
We finish with two caveats. First, rank gaps are not the same as level gaps. A small difference in rank may imply a large change in wealth levels, especially at the top of the distribution. Alternatively, a large change in rank may imply a small change in wealth levels, especially at the bottom. Both types of inequality measures have their purposes.
Second, White and Black households differ along many dimensions besides income and wealth. Age and education are just two such dimensions. As we have noted, the disaggregated results shown above do not decompose the rank gaps between "within-group" and "between-group" inequality.
In upcoming work, we intend to apply a methodology — the DiNardo-Fortin-Lemieux decomposition — that allows us to perform that task.
John Bailey Jones is a vice president and economist and Urvi Neelakantan is a senior policy economist in the Research Department of the Federal Reserve Bank of Richmond.
1
A comprehensive review of racial differences in wages and employment appears in the chapter "Race and Gender in the Labor Market" from the 1999 Handbook of Labor Economics. Descriptive reviews of the racial wealth gap include the 2019 working paper "Accounting for Racial Wealth Disparities in the United States" and the 2021 paper "A New Look at Racial Disparities Using a More Comprehensive Wealth Measure."
2
The use of relative ranks to characterize racial disparities in earnings was introduced by the 2018 paper "Divergent Paths: A New Perspective on Earnings Differences Between Black and White Men Since 1940." The graphical approach used in this paper is adapted from the 2019 paper "Wealth Inequality and Retirement Preparedness: A Cross-Cohort Perspective."
3
Although expressing the gaps as ratios or percentage differences is often quite informative, minor changes in dollar values can lead to large changes in relative values at small or negative values of income and wealth.
4
See the aforementioned 2021 paper "A New Look at Racial Disparities Using a More Comprehensive Wealth Measure" and the 2018 working paper "The Decline of African-American and Hispanic Wealth Since the Great Recession."
5
We characterize a household by the education level of its head.
6
The measured wealth gaps are also erratic, attaining the Gini coefficient values of 0.473, 0.462 and 0.470 in 1995, 2001 and 2013, respectively.
To cite this Economic Brief, please use the following format: Jones, John Bailey; and Neelakantan, Urvi. (May 2022) "A More Comprehensive Measure of the Black-White Wealth Gap" Federal Reserve Bank of Richmond Economic Brief, No. 22-17.
This article may be photocopied or reprinted in its entirety. Please credit the authors, source, and the Federal Reserve Bank of Richmond and include the italicized statement below.
Views expressed in this article are those of the authors and not necessarily those of the Federal Reserve Bank of Richmond or the Federal Reserve System.
Subscribe to Economic Brief
Receive a notification when Economic Brief is posted online.
Contact Us