Commuting Patterns and Economic Connectivity in the Fifth District
Economic Brief
November 2022, No. 22-47
One way of measuring economic connectivity across locations is by examining the commuting behavior of residents. This article explores how connected counties in the Fifth District are by focusing on commuting.
One important factor that has long been recognized to improve economic opportunities for residents in smaller urban and rural areas is their ability to access larger regional markets. Distance isn't necessarily the biggest factor in how connected locations are to their regional economies. Some may be significantly connected, while others that are no farther may tend to be more isolated.
Densely populated areas can offer broader ranges of local labor opportunities, goods and services. Locations with higher concentrations of people also attract businesses and can provide functions such as health services, education services and transportation more efficiently than more sparsely populated areas. Thus, residents in smaller urban and rural communities who interact with these areas can benefit from access to a larger labor market and a wider array of local goods and services.
And these benefits don't necessarily flow only one direction: Larger urban areas can benefit from their economic interactions with surrounding smaller urban towns and rural areas. As markets expand, urban areas become more productive, increase their production capabilities and gain further advantages of concentrating economic activities at their locations.
Taking advantage of these benefits may require tailored policies, as the ability of smaller urban and rural areas to benefit is far from uniform. Thus, it is important to understand how connected these smaller urban and rural areas are to regional economies.
One way of assessing economic linkages across areas is by examining intercounty commuting flows. This article classifies urban and rural areas based on observed commuting patterns and uses this information to establish the degree of spatial interactions or connectivity across areas.
Measuring Economic Connectivity Through Commuting Patterns
Studying commuting patterns allows researchers to assess the economic linkages between regions. These flows contain information on how labor markets spread across geographies and provide employment opportunities to residents in neighboring jurisdictions.
At the same time, workers' willingness to travel to a location for work indicates that regular travel to that location for broader reasons — such as commerce or recreation — is feasible. Commuting patterns should therefore reflect the degree of economic interactions or connectivity across locations and indicate the ability of these communities to share the benefits of belonging to a larger regional economy.
Data and Methodology
We analyze commuting patterns using the 2019 Longitudinal Employer-Household Dynamics (LEHD) data. The U.S. Census Bureau manages and publishes this dataset, which contains data on how many workers live and work in pairs of locations. Researchers use these data to evaluate commuting patterns and trends.
We consider three types of commuting flows:
- Intracounty commuting, or workers living and working in the same county
- Worker outflows, or workers commuting from a specific county to other counties
- Employee inflows, or workers commuting into a specific county from other counties
To compare commuting flows across counties, we calculate outflows of a county as a percentage of total workers who live in the county and inflows as a percentage of total workers who work in the county.
Throughout the analysis, we intend to distinguish smaller urban and rural areas from larger urban areas using the USDA Rural-Urban Continuum Classification (RUCC) categorization. Specifically, we consider counties with RUCC codes 1 or 2 as large urban areas (urban hereafter) and counties with codes between 3 and 9 smaller urban and rural (rural hereafter).
Connectivity in the Fifth District
Connectivity Within States
Overall, the Fifth District's median outflow is 69 percent, and the median inflow is 56 percent, as seen in Figure 1.
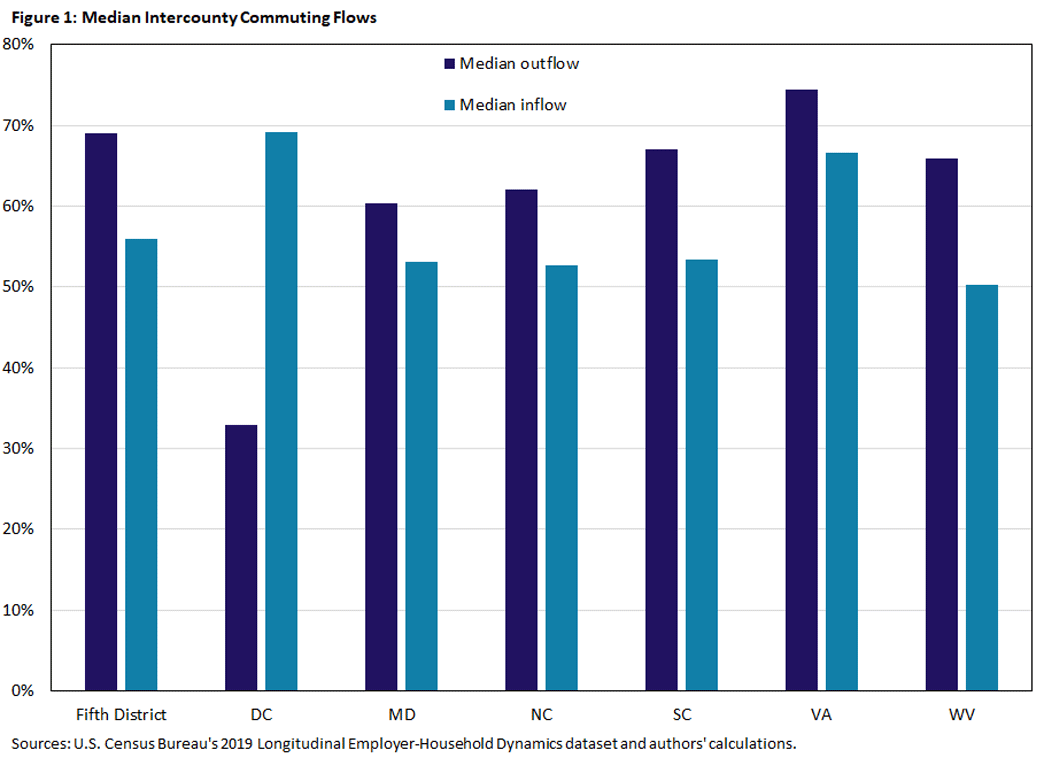
The median inflows and outflows differ across states. Washington, D.C., consists of a single county, and it has relatively low outflows — indicating that most residents work in the city — and relatively high inflows. Median county outflows in the remainder of Fifth District states range from 60 percent in Maryland to 74 percent in Virginia, while median inflows range from 50 percent in West Virginia to 67 percent in Virginia.
We observe high outflows and inflows in Virginia due in part to the state's treatment of independent cities as counties.1 Because of this, commuters who travel between independent cities and the surrounding county contribute to inflows and outflows in Virginia, whereas the same type of travel would likely be considered intracounty commuting in other states.
Connectivity of Urban and Rural Counties
The percentages of inflows and outflows differ across urban and rural counties: The median outflow rate is 72 percent in urban areas and 65 percent in rural areas, and the median inflow rate is 60 percent in urban areas and 53 percent in rural areas. Overall, this means that rural residents (compared to urban residents) more often live and work in the same county and are therefore less connected to other counties. However, the distributions of outflow, inflow and intracounty shares for rural and urban areas overlap to a large degree, suggesting that some rural counties are just as connected as some urban counties.
Clustered Connectivity
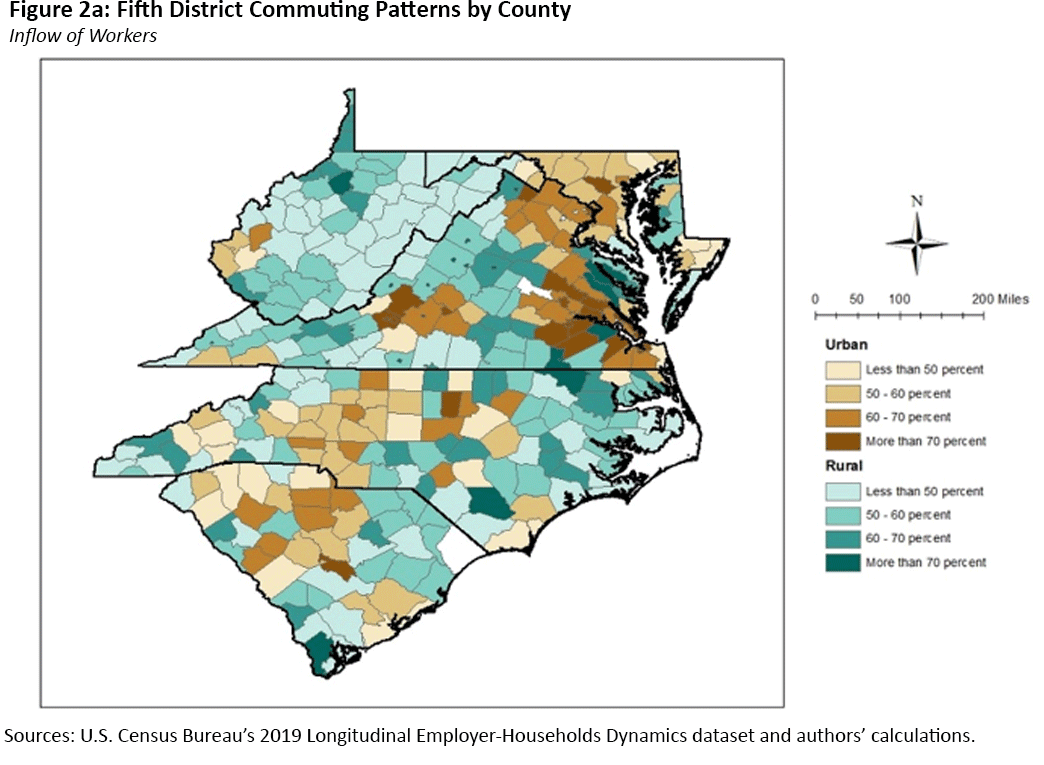
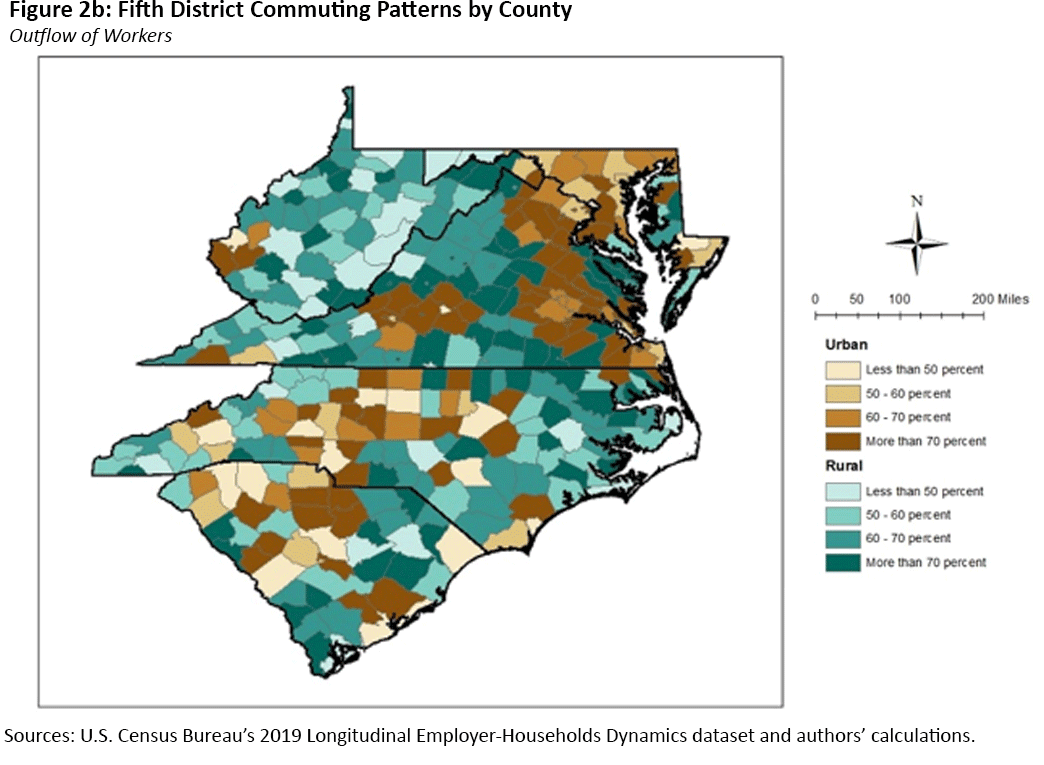
In the Fifth District, rural counties with low worker inflow and outflow shares tend to be clustered, particularly in mountainous areas that are relatively more difficult to traverse, as seen in Figures 2a and 2b.
The tables below show rural and urban counties in each state with the highest and lowest inflow and outflow rates. In both urban and rural counties, the level of outflows in the most connected counties tends to exceed the level of inflows in the most connected counties.
Among both urban and rural counties, Virginia's most connected counties tend to have the highest shares of inflows and outflows. In several states, counties appear on both least connected lists, such as Garrett and Allegany Counties in Maryland. These counties have a high degree of intracounty commuting and relatively self-sufficient labor markets. On the other hand, counties that appear in both most connected lists — such as Caroline and Dorchester counties in Maryland — are more strongly integrated into a larger, regional labor market.
| Table 1: Most and Least Connected Rural Counties | ||||
|---|---|---|---|---|
| State | Most Connected | Least Connected | ||
| Inflow | Outflow | Inflow | Outflow | |
| Maryland | Talbot (61%) Caroline (59%) Dorchester (54%) | Caroline (78%) Dorchester (66%) Talbot (60%) | Garrett (37%) Allegany (39%) St. Mary's (40%) | Allegany (36%) Garrett (39%) Kent (54%) |
| North Carolina | Bladen (75%) Northampton (71%) Jones (68%) | Camden (90%) Caswell (88%) Jones (88%) | Macon (36%) Onslow (37%) Graham (38%) | Dare (37%) Pitt (40%) Watauga (42%) |
| South Carolina | Jasper (77%) Allendale (67%) Lee (63%) | Lee (81%) McCormick (81%) Jasper (77%) | Beaufort (33%) Sumter (44%) Oconee (44%) | Beaufort (32%) Florence (41%) Sumter (48%) |
| Virginia | Norton City (89%) Winchester City (86%) Martinsville City (83%) | King and Queen (92%) Cumberland (88%) Greensville (86%) | Highland (33%) Page (36%) Lee (37%) | Montgomery (42%) Smyth (49%) Bath (49%) |
| West Virginia | Doddridge (74%) Pleasants (70%) Marshall (64%) | Wirt (86%) Taylor (80%) Doddridge (78%) | Pendleton (34%) Pocahontas (38%) Hampshire (40%) | Kanawha (27%) Monongalia (30%) Raleigh (36%) |
| Sources: U.S. Census Bureau's 2019 Longitudinal Employer-Households Dynamics dataset and authors' calculations. | ||||
| Table 2: Most and Least Connected Urban Counties | ||||
|---|---|---|---|---|
| State | Most Connected | Least Connected | ||
| Inflow | Outflow | Inflow | Outflow | |
| Maryland | Howard (74%) Baltimore City (67%) Prince George's (62%) | Charles (78%) Queen Anne's (74%) Somerset (71%) | Calvert (44%) Wicomico (45%) Worcester (47%) | Wicomico (46%) Montgomery (50%) Worcester (51%) |
| North Carolina | Orange (71%) Durham (68%) Davie (67%) | Stokes (86%) Franklin (84%) Hoke (84%) | Haywood (38%) Brunswick (42%) Buncombe (42%) | Mecklenburg (28%) New Hanover (31%) Buncombe (31%) |
| South Carolina | Calhoun (75%) Saluda (66%) Fairfield (64%) | Calhoun (84%) Edgefield (83%) Fairfield (79%) | Horry (26%) Anderson (44%) Aiken (45%) | Charleston (27%) Horry (27%) Greenville (31%) |
| Virginia | Fairfax City (96%) Falls Church City (95%) Williamsburg City (92%) | Manassas Park City (94%) Fairfax City (91%) Falls Church City (91%) | Craig (39%) Franklin (44%) Virginia Beach City (46%) | Lynchburg City (49%) Virginia Beach City (51%) Fairfax (53%) |
| West Virginia | Putnam (66%) Wayne (60%) Cabell (57%) | Lincoln (82%) Wayne (76%) Jefferson (72%) | Berkeley (37%) Lincoln (49%) Jefferson (55%) | Cabell (38%) Berkeley (59%) Putnam (70%) |
| Sources: U.S. Census Bureau's 2019 Longitudinal Employer-Households Dynamics dataset and authors' calculations. | ||||
Categorizing Connectedness
Next, we classify counties into four categories according to their degree and the type of connectivity. For this purpose, we combine inflow and outflow measures. We use the overall Fifth District median inflow and outflow shares as the thresholds for each category.
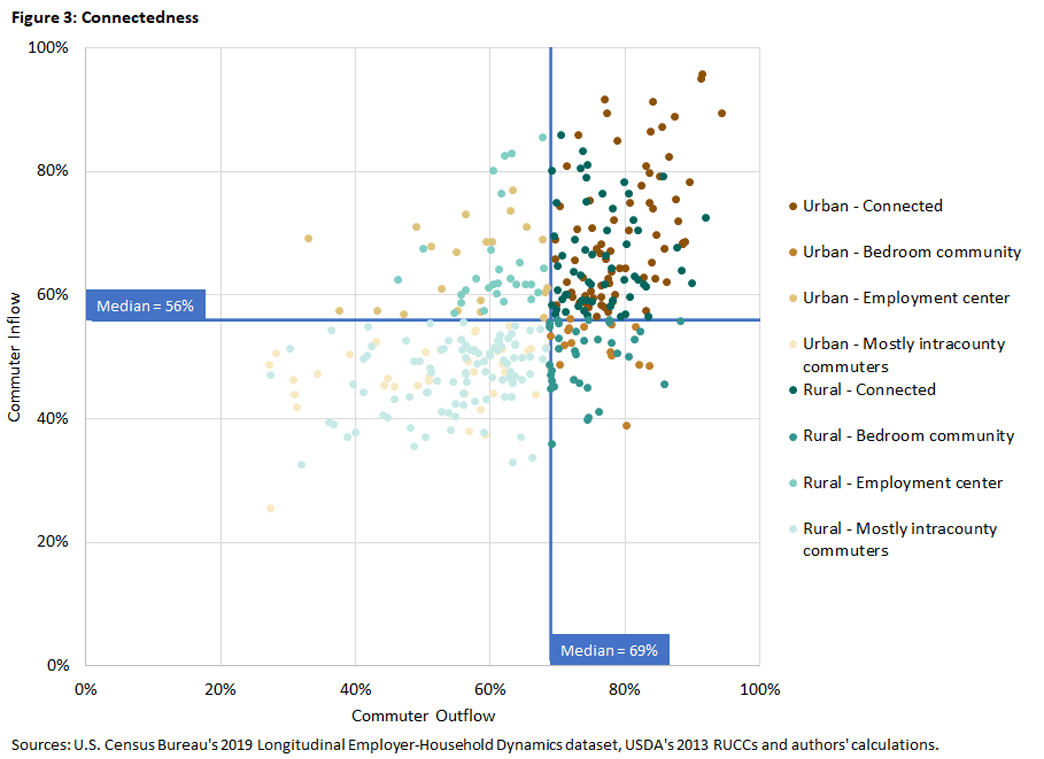
The quadrants in the graph determined by the medians define four groups, which can be described as follows.
Connected Counties
These counties have both high inflows and high outflows and are located in the top right quadrant of Figure 3. Relatively high shares of people commute both into and out of these counties. These counties have the potential to benefit from increased productive capacity by integrating their labor markets with surrounding counties.
Bedroom Communities
These counties have low inflows and high outflows and locate in the bottom right quadrant of Figure 3. Relatively few of the employees in these counties commute in from outside counties, but a relatively high share of employed residents commutes out of the county. These counties serve residents who prefer to live in communities that are more residential than commercial.
Employment Centers
These counties have high inflows and low outflows and are in the top left quadrant of Figure 3. The opposite of a bedroom community, a large share of employees commutes in from outside counties, but a small share of employed residents commutes out of the county for work. These counties are more likely to have collocated employment opportunities that may complement one another, and they benefit from an expanded labor market beyond what the county itself has to offer.
Mostly Intracounty Commuters
These counties are low inflow and low outflow and are in the bottom left quadrant of Figure 3. Relatively low shares of employed people commute both into and out of these counties, as these communities are characterized by high levels of intracounty commuting. Counties with mostly intracounty commuters may be at a disadvantage to other types of communities, or they may be economically self-sufficient.
Urban and rural communities are represented in all four categories. However, urban counties are more likely to be Connected or Employment Centers, whereas rural counties are more likely to be Mostly Intracounty Commuter or Bedroom Community counties, as seen in Figure 4.
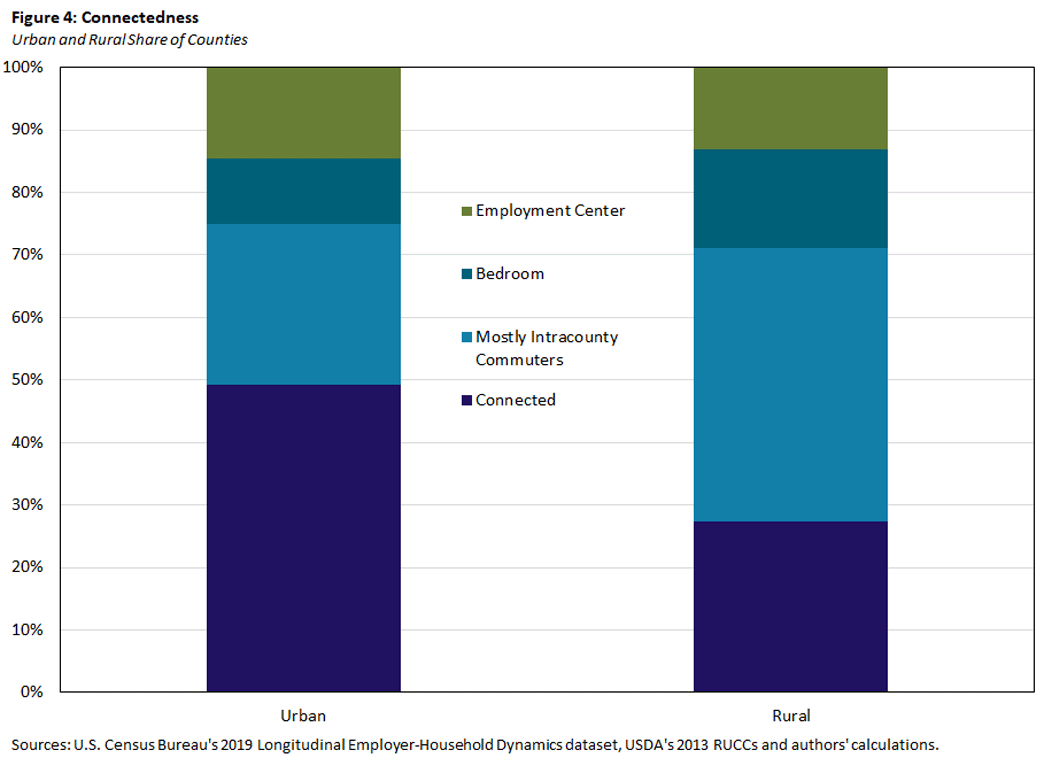
Geographically, connected communities tend to be clustered in eastern and central Virginia, and dispersed throughout Maryland, West Virginia and the Carolinas.
Where Do Workers Commute?
Commuting destinations seem to depend on whether workers reside in urban or rural areas. For the Fifth District, residents in rural areas are more likely to commute intracounty (35 percent) or to another rural county (36 percent) than to an urban county (29 percent). In the case of urban areas, about two-thirds of residents tend to commute to a different urban area.
A closer look at the Fifth District reveals that the behavior across states is far from uniform. As shown in Figure 5, residents in rural counties in Maryland, central Virginia, and central North and South Carolina counties are more likely to commute to urban counties. This is likely attributable to the fact that these counties usually border one or more urban counties.
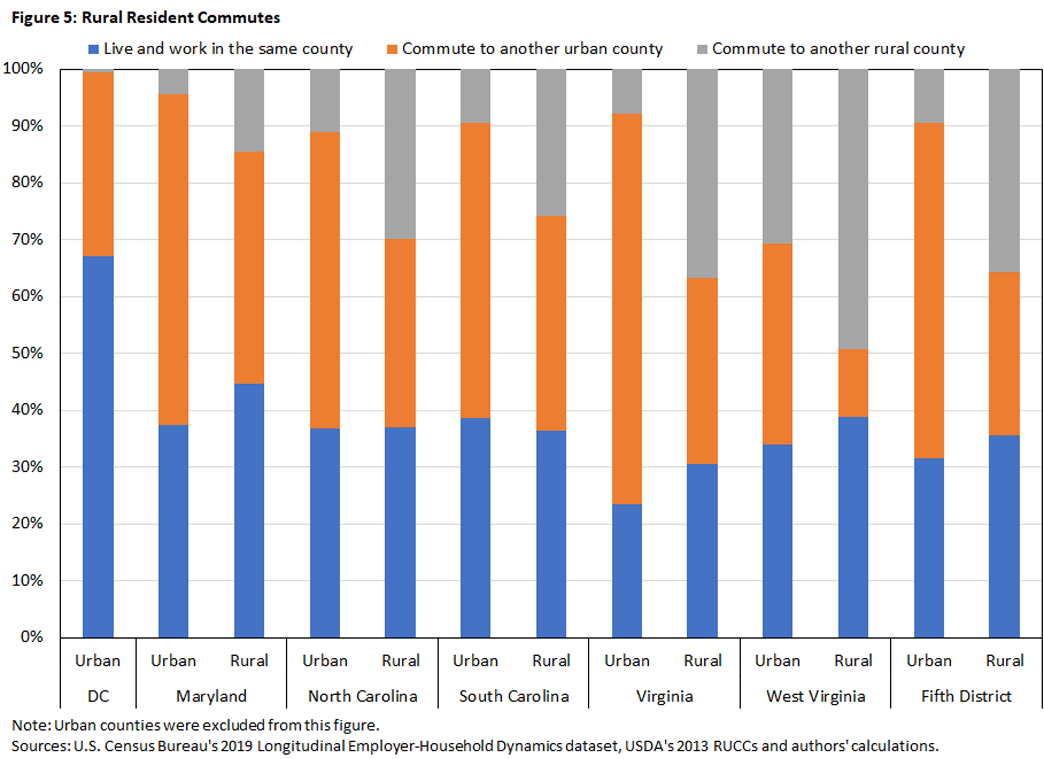
On the other hand, residents in rural West Virginia, western Virginia and eastern North Carolina counties are more likely to commute to other rural counties. These areas are characterized by clustered rural counties and include some rural counties that do not border any urban counties at all.
Conclusion
Communities differ, among other things, on their level of economic connectivity to other jurisdictions. A high level of economic interaction with surrounding areas offers access to expanded employment opportunities and a wider range of local goods. Both factors are key to explaining why certain areas can retain people and grow.
However, the ability of some small towns and rural areas to benefit from all these economic opportunities is far from uniform across space. Regional policies aimed at supporting different geographic areas should differentiate between those regions that are closely attached and connected to other areas from those with limited economic interactions. For example, the 2008 paper "Distance From Urban Agglomeration Economies and Rural Poverty" found that the benefits associated with agglomeration — including higher wages and employment growth — attenuate with distance from an urban core.
However, a more recent paper — "Local Employment Impacts of Connectivity to Regional Economies: The Role of Industry Clusters in Bridging the Urban-Rural Divide," published in 2022 — finds that rural communities benefit from their connections to larger regional economies when they align their economic development strategies with the industry clusters already prevalent in the region. This suggests that connectivity to regional markets contributes meaningfully to rural and small-town economic development and that distance from an urban center need not be a limitation.
The present analysis helps identify regions that would benefit from policies and actions that would improve accessibility to a broader set of economic prospects. For instance, investment in transportation infrastructure and other communication networks would allow households residing at distant locations to take advantage of economic opportunities typically available at more densely populated urban areas.
An important caveat is that the present analysis uses pre-pandemic data on commuting flows. To the extent that COVID has permanently shifted people's commuting patterns, then it would be necessary to incorporate other information to understand the degree of economic interactions between residents in different communities.
Sierra Latham is a senior research analyst and Santiago Pinto is a senior economist and policy advisor in the Research Department at the Federal Reserve Bank of Richmond.
1
Other states in the Fifth District have not treated cities as a standalone county, except for Baltimore City in Maryland.
To cite this Economic Brief, please use the following format: Latham, Sierra; and Pinto, Santiago. (November 2022) "Commuting Patterns and Economic Connectivity in the Fifth District." Federal Reserve Bank of Richmond Economic Brief, No. 22-47.
This article may be photocopied or reprinted in its entirety. Please credit the authors, source, and the Federal Reserve Bank of Richmond and include the italicized statement below.
Views expressed in this article are those of the authors and not necessarily those of the Federal Reserve Bank of Richmond or the Federal Reserve System.
Subscribe to Economic Brief
Receive a notification when Economic Brief is posted online.
Contact Us