These posts examine local, regional and national data that matter to the Fifth District economy and our communities.
What do Diffusion Indices Tell Us?
The Richmond Fed conducts monthly surveys of business conditions in the Fifth Federal Reserve District to obtain timely information about regional economic conditions and to provide context to data obtained from other sources. The two most important surveys in terms of number of participants are the Fifth District Survey of Manufacturing Activity (Manufacturing Survey) and the Fifth District Survey of Service Sector Activity (Service Survey). The qualitative information collected through these surveys is later aggregated and combined into several individual diffusion indices (DIs), defined as the percentage of participants who responded "up" minus the percentage who responded "down." The Richmond Fed also reports a composite DI for the Manufacturing Survey that is defined as the weighted sum of three individual DIs: employment, shipments, and orders. (For a more detailed look at diffusion indexes, see our prior Regional Matters post: "Measuring Economic Activity: How the Richmond Fed Uses Diffusion Indices.")
But what kind of information do DIs reveal? A forthcoming paper titled "The Information Content and Statistical Properties of Diffusion Indices" by Santiago Pinto, Pierre-Daniel G. Sarte, and Robert Sharp (2019) examines this issue. The paper not only attempts to uncover and describe the informational content of DIs, but it also explores their statistical foundations. The paper develops a methodology, based on the data used to construct DIs, to construct a measure of uncertainty. Specifically, this indicator measures an aspect of uncertainty that captures polarization or (dis)agreement among survey participants. The paper argues that this kind of framework can be readily applied to the surveys of business activities conducted by central banks. The information provided by the uncertainty indicator based on the proposed methodology, combined with the information offered by the DIs, could help enhance our understanding of regional economic conditions.
Informational Content of Diffusion Indices
The paper by Pinto, Sarte, and Sharp (2019) consists of four parts. In the first part, the paper highlights the relationship between actual changes of a given variable and its breadth of change. DIs, in this case, can be interpreted as estimates of changes in an extensive margin. In the second part, the paper characterizes the statistical distribution of individual DIs. Deriving such distribution is of course important for statistical inference. Moreover, the paper shows that the variance of the DI captures uncertainty implied by polarization or (dis)agreement of participants' responses. The third part of the paper characterizes the distribution of composite DIs. The last part of the paper illustrates the methodology using data from the Michigan Survey of Consumers.
The rest of this article describes how the methodology developed in that paper can be applied to the surveys conducted by the Richmond Fed.
Actual Change and Breadth of Change
In principle, overall growth of a variable can be explained by the interaction between two factors: (1) the difference between how fast "up" sectors grew and how badly "down" sectors declined (differences in growth intensity or intensive margin); and (2) the difference between the proportion of sectors that expanded versus those that declined (the breadth of the expansion or extensive margin).
DIs are likely to capture this second effect. In other words, to the extent that the growth of a variable is mostly driven by the factors described in (2) above, DIs would accurately reflect its behavior. For instance, the paper by Gourio and Kashyap (2007) states, "The number of establishments undergoing investment spikes (the 'extensive margin') account for the bulk of variation in aggregate investment."
Previous work by Pinto, Ravindranath Waddell, and Sarte (2015) identified DIs that are more likely to serve as reliable real-time indicators of economic activity. The paper showed that changes in the extensive margin accounted for the bulk of changes in aggregate employment growth in the Fifth District. The behavior of some variables, however, was mostly driven by the intensity of the change (i.e., factors described in (1) above). In this case, the usefulness of DIs was rather limited. This is the case, the paper showed, of changes in average wages.
Individual Diffusion Indices
The forthcoming paper by Pinto, Sarte, and Sharp (2019) derives the statistical distribution of individual DIs. It shows that the variance of a DI reflects the polarization or (dis)agreement across responses by survey participants on changes in an economic variable of interest, which is commonly thought of as a possible source of uncertainty. It also shows that uncertainty in the measured direction of change decreases with the value of the DI itself and decreases as responses become less polarized.
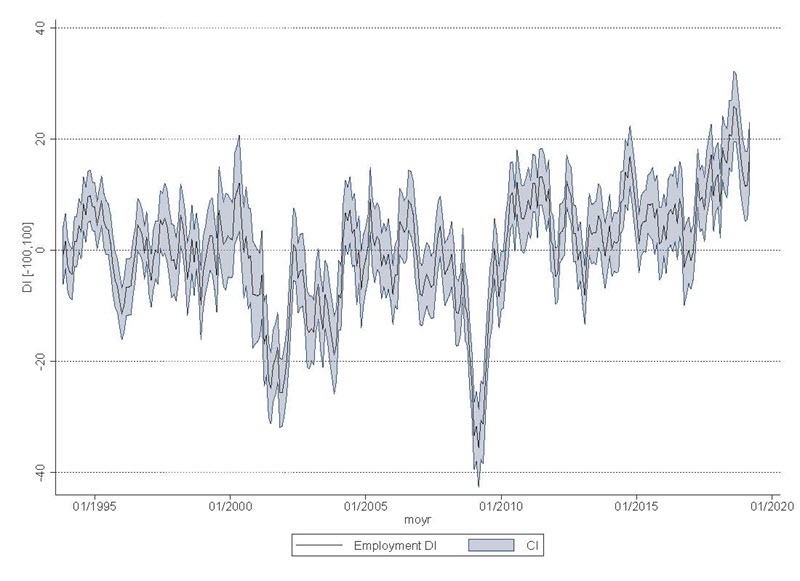
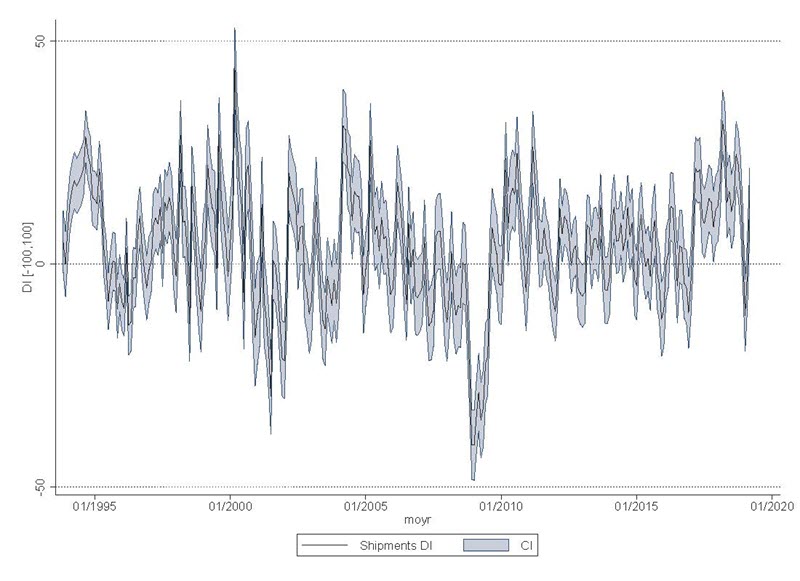
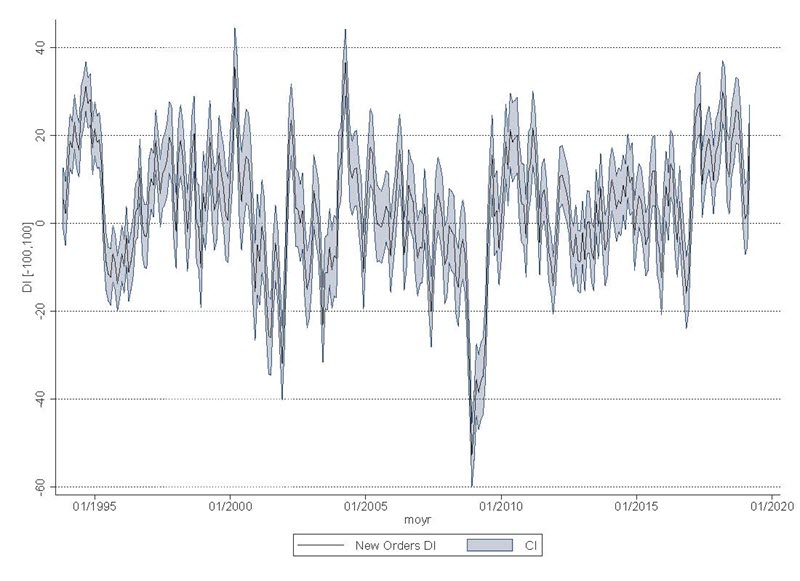
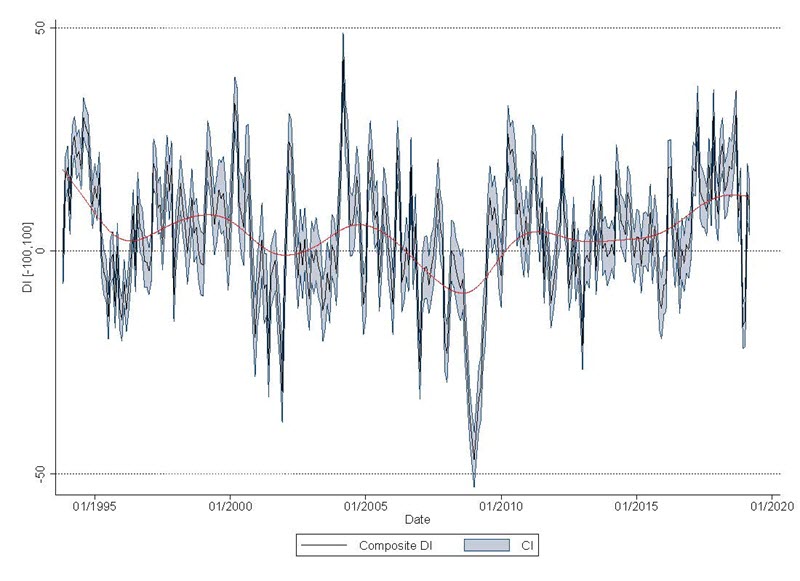
In the case of the DI reported by the Richmond Fed, a value of the index above zero would be indicative of expansion and a value less than zero would show a contraction of the relevant variable. Therefore, it becomes relevant to determine, in a statistical sense, when the DI is significantly different from zero. For average values of the Richmond Fed Manufacturing Survey, it follows that the DI would be significantly different from zero at a 68 percent confidence when the DI is greater than 5 or less than -5.
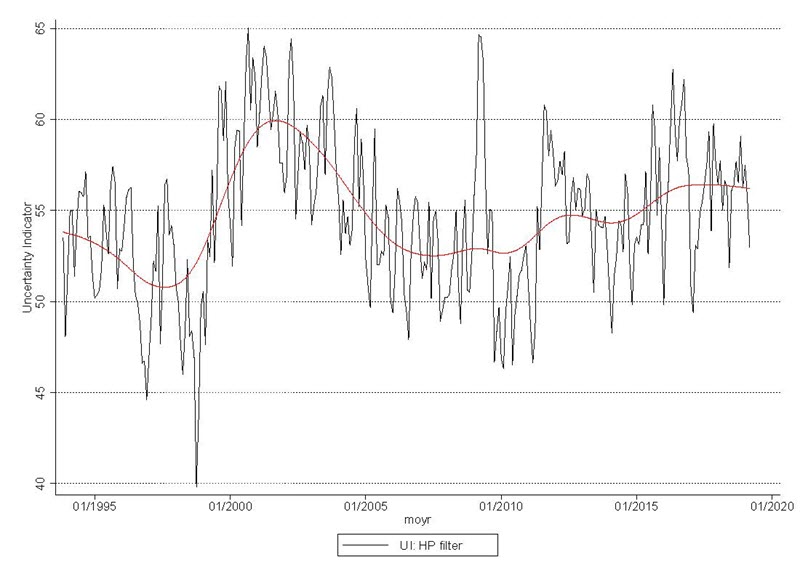
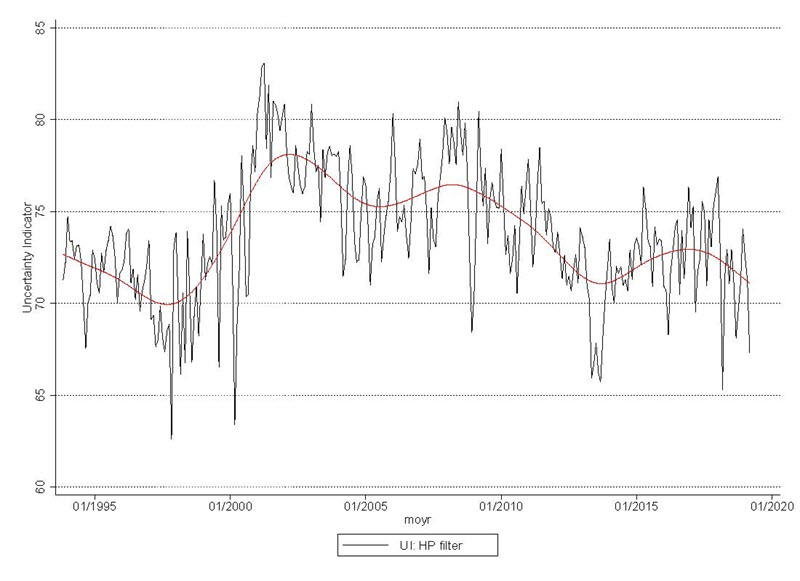
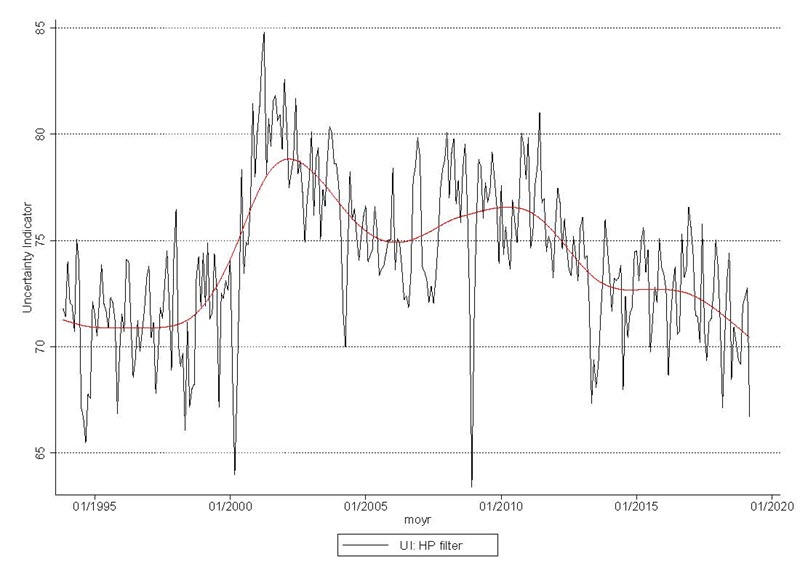
DIs and uncertainty indicators convey different information. As mentioned earlier, the variance of a DI or uncertainty decreases when the value of the DI, everything else constant, is higher. We should expect, as a result, a negative correlation between them. However, for most Richmond Fed DIs, the correlation is zero or just weakly negative. In the case of employment, both the employment DI and the associated uncertainty indicator (UI) have tended to rise since 2010. This means that the two indicators sometimes behave in conflicting ways. Identifying and recognizing time periods in which such behavior is observed could shed light on the evolution of other economic variables.
Charts: Diffusion Indices with Confidence Intervals and HP Filters
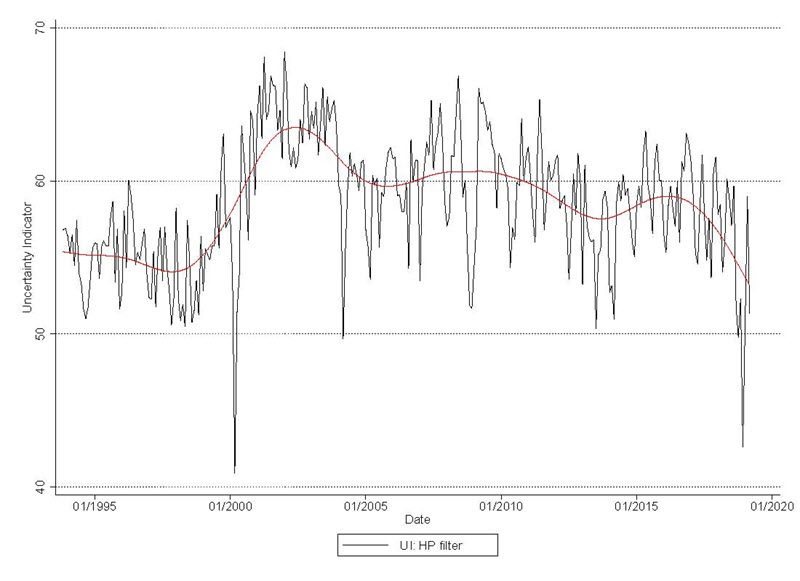
Charts: Uncertainty Indicators with HP Filters
Composite Diffusion Index
The derivation of the statistical distribution of a composite DI is more complicated. In this case, the variances of the composite DI and, as a result, the uncertainty indicator are also affected by the covariance of polarization or (dis)agreement across responses to different questions (or individual DIs).
As in the case of individual DIs, the composite DI reported by the Richmond Fed and the UI follow different behavior. From 2011 until 2016, the composite DI was quite stable; it has started rising since then. The UI, however, declined from 2011 until 2014, then increased until 2016, and has been declining since that year.
In addition to providing additional information about changes in uncertainty, the approach developed by Pinto, Sarte, and Sharp (2019) for composite DIs quantifies the contribution to uncertainty of each individual DI and of the pairwise correlations among them. For the composite DI reported by the Richmond Fed, a large portion of the uncertainty is explained by the correlation between shipments and new orders DIs. These conclusions could be useful, for instance, when considering the individual DIs that should be included in the composite DI.
Conclusion
Overall, the DIs constructed and reported by the Richmond Fed perform reasonably well at explaining the national and the regional economy (see, for instance, Lazaryan and Pinto [2017] for a thorough evaluation of the performance of DIs). Constructing and reporting uncertainty indicators like those suggested in Pinto, Sarte, and Sharp (2019) using the data collected from the business surveys could provide additional useful information about changes in economic conditions in a timely manner.
Have a question or comment about this article? We'd love to hear from you!
Views expressed are those of the authors and do not necessarily reflect those of the Federal Reserve Bank of Richmond or the Federal Reserve System.


