These posts examine local, regional and national data that matter to the Fifth District economy and our communities.
Measuring Economic Activity: How the Richmond Fed Uses Diffusion Indices
An important part of the mission of each Federal Reserve Bank is to understand the economy of its district. One of the tools that the Richmond Fed uses to understand the Fifth Federal Reserve District (D.C., Maryland, Virginia, North Carolina, South Carolina, and most of West Virginia) is a survey of manufacturing and service sector firms located throughout the region.
The surveys are administered monthly and participants are asked whether business conditions improved, worsened, or stayed the same across a variety of indicators. Through these surveys, we are able to collect information that is not otherwise available as well as information that is timelier than other available regional data. A Richmond Fed Economic Brief entitled "The Richmond Fed Manufacturing and Service Sector Surveys: A User’s Guide" provides additional background information on our surveys.
How Long Have the Surveys Been Around, and What Do They Measure?
The survey of manufacturing firms began in June 1986 and took its current monthly form in November 1993. The manufacturing survey asks firms questions about shipments of finished products, new order volumes, order backlogs, capacity utilization (use of equipment), lead times of suppliers, number of employees, average work week, wages, inventories of finished goods, and expectations of capital expenditures.
The survey of service sector firms began in 1993 and asks questions regarding revenues, number of employees, average wages, and prices received. For retailers, the survey includes questions on current inventory activity, big ticket sales, and shopper traffic.
At times, special questions are added to the survey to better understand changing economic conditions or the impact of policy changes, such as the impact of the overtime rule on firms' behavior. The questions take very little time to answer and there is a space on the survey for comments, which provide additional context to the responses.
We also publish surveys that specifically address economic conditions in Maryland and the Carolinas.
The Use of Diffusion Indices
So once we have gathered the responses to the questions, how do we use them to understand the Fifth District economy? The way we do it is to develop indices out of the responses. For each question, respondents are asked about a change in activity: increase, decrease, or no change. Results are reported as diffusion indices that are calculated by subtracting the share of respondents who said that activity decreased from the share who said that activity increased.
For example, say 120 contacts respond to the question about employment activity and 78 (65 percent) indicate that employment increased, 24 (20 percent) report that employment decreased, and 18 indicate no change. In this case, the diffusion index for the question would be 65 minus 20, or a reading of 45. If a diffusion index is positive, then that is generally interpreted as an expansion in activity (because more firms are reporting expansion) while negative values are interpreted as a contraction (because more firms are reporting contraction.)
Why use diffusion indices? Primarily because they are a simple and concise way of summarizing information. The Richmond Fed is not the only organization to use diffusion indices. In fact, the manufacturing survey was modeled after a similar survey done by the Institute for Supply Management (ISM).
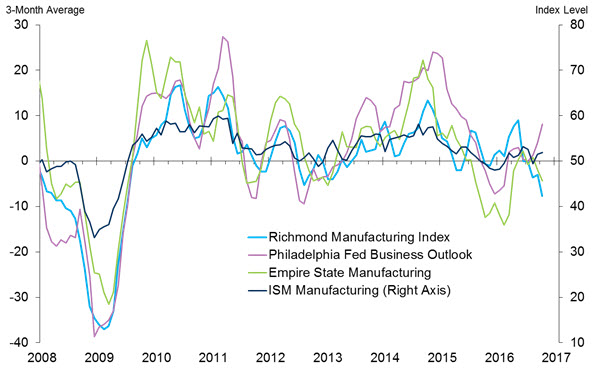
The Richmond Fed is one of several Federal Reserve Banks that administer surveys and summarize the information using diffusion indices. The oldest manufacturing survey is produced by the Philadelphia Fed. The chart below shows the Richmond Fed Manufacturing Index (composite) alongside the indices for the ISM survey, the Philadelphia Fed's Manufacturing Business Outlook Survey, and the New York Fed's Empire State Manufacturing Survey.
Diffusion indices are one way to summarize the data provided from survey respondents. The monthly survey reports written by the Regional Economics unit of the Richmond Fed provide timely data on economic activity in the region. In addition, economists have used the Fifth District diffusion indices to better understand what they can tell us about the Fifth District, their ability to predict economic activity, and as a means through which to study qualitative survey methodology more generally.
Are you a firm that is interested in responding to our monthly survey? If so, click here.
Have a question or comment about this article? We'd love to hear from you!
Views expressed are those of the authors and do not necessarily reflect those of the Federal Reserve Bank of Richmond or the Federal Reserve System.


