What Might Cuts to the Federal Government Workforce Mean for the Fifth District?
Regional Matters
March 4, 2025
Federal government employment spans the country, but there is a concentration in the District of Columbia and spread through the surrounding counties in Maryland, Virginia, and West Virginia. Historically, the federal government presence has both insulated the region from the effects of economic downturns and also created additional challenges in the case of sequestration in 2013 or during short-lived government shutdowns.
Understanding the economy of the Fifth District, therefore, requires sizing and preparing for any adverse economic impact of cuts in federal government employment and spending. Naturally, the impact of cuts depends both on which agencies are affected and the share of employment in those agencies. Across the board, cuts to departments such as the Department of Defense, Department of the Army, Department of the Navy, and Veterans Affairs have the potential for the most impact on Fifth District regions. There are particular counties and areas that would likely be more affected by federal employment declines than others — not surprisingly, most of those are in the areas immediately around D.C., such as Charles County, Md., or King George County, Va. In addition, many of the federal government jobs are relatively well-educated, well-paying jobs, the loss of which could challenge state and local finances.
Federal Government Presence in the Fifth District
As of January 2025, the Bureau of Labor Statistics (BLS) reported 3,024,000 federal government employees, or 1.9 percent of all employed individuals. This includes about 2.4 million employed by federal agencies and about 600,000 employed by the United States Postal Service (USPS). This does not include the approximately 1.3 million active-duty armed forces members and certain intelligence agencies, such as the Central Intelligence Agency (CIA), National Security Agency (NSA), National Geospatial-Intelligence Agency (NGA), and Defense Intelligence Agency (DIA). If temporary employment related to the decennial census is excluded, federal employment has been below 2 percent of all employment since January 2014.
The Fifth District has a large presence of civilian federal government employment. The chart below takes the number of civilian federal government employees from the Office of Personnel Management (OPM) and compares it to the total number of employees in each state using data from the BLS. The share of state employment is a floor — OPM data do not include some large employing agencies, such as the USPS. In Ohio, for example, about a quarter of federal government workers were employed by the USPS, according to the BLS.
| Total federal government employment | Share of all federal government employment | Share of state employment | |
|---|---|---|---|
| District of Columbia | 162,144 | 7.23 | 21.2 |
| California | 147,487 | 6.58 | 0.8 |
| Virginia | 144,483 | 6.45 | 3.5 |
| Maryland | 142,876 | 6.37 | 5.3 |
| Texas | 129,738 | 5.79 | 0.9 |
| Florida | 94,014 | 4.19 | 0.9 |
| Georgia | 79,686 | 3.56 | 1.6 |
| Pennsylvania | 66,079 | 2.95 | 1.1 |
| Washington | 56,772 | 2.53 | 1.6 |
| Ohio | 55,487 | 2.48 | 1.0 |
| New York | 53,600 | 2.39 | 0.6 |
| North Carolina | 51,013 | 2.28 | 1.0 |
| Source: OPM (federal government employment) and BLS (total state employment); author's calculations. Notes: The share of state employment is OPM data divided into BLS data, so it is a floor for the share of federal government employment in the state, since OPM does not include USPS or other major sources of federal government employment. See footnote 3 for the treatment of the District of Columbia in the employment data — much of this employment might be in surrounding counties in Virginia and Maryland. |
|||
About one-fifth of federal government employment is in the DC-MD-VA region, according to OPM. Although federal government employment numbers in these states are either less than or in line with federal government employment in California or Texas, the economies of Virginia and Maryland are much smaller — thus, the federal government has a much higher share of total employment.
The larger share could have an impact. To illustrate, if we assume for a moment that all federal government employees employed in the states above live in those states, we can use a blanket approach1 to calculate how much a state's unemployment rate could increase with a 75 percent decrease in federal government employment.2 For example, if California experienced a blanket 75 percent reduction in federal government employment, the state's unemployment rate would rise from its current 5.3 percent to 5.9 percent. Virginia's unemployment rate, on the other hand, would almost double from its current 3 percent to 5.4 percent, and the Maryland rate would more than double from 2.4 percent to 5.7 percent.
The impact on the District of Columbia is hard to gauge because of its small size and the fact that some of the federal government employment counted in D.C. is actually in one of the surrounding states.3 An Urban Institute analysis estimated that a proposed 75 percent reduction would increase the unemployment rate in the Washington, D.C., metro area (which includes parts of Maryland, Virginia, and West Virginia) from 2.8 percent4 to 9.6 percent. They also found that the areas that would experience the highest increases in unemployment rates are smaller communities with military installations or bases.
Many federal government jobs in the Fifth District are well-paying jobs with long-tenured employees. The average federal government employee in Virginia earns $119,277 and almost 60 percent have a bachelor's degree. In comparison, the 2023 annual mean wage in Virginia was about $70,000 and a little over 40 percent of Virginians age 25 and older have at least bachelor's degree. Importantly, this varies a lot by region — salaries in the Virginia suburbs of Washington, D.C. (Northern Virginia) are a lot higher than those in other parts of the state. Furthermore, the jobs tend to be long-tenured: the average length of service in federal government jobs ranges from 10.6 years (N.C.) to 14.1 years (D.C.).
| Average Salary, Federal Government Employees (OPM) | Average Annual Earnings, All Workers (BLS) | Average Length of Service for Federal Government Employees (Years) | Share of Federal Government Employees with At Least an Associate Degree | Share of Federal Government Employees with At Least a Bachelor's Degree | |
|---|---|---|---|---|---|
| District of Columbia | $145,489 | $102,380 | 14.1 | 71.7 | 67.5 |
| Maryland | $137,624 | $69,340 | 13.9 | 74.5 | 69.5 |
| North Carolina | $87,444 | $63,920 | 10.6 | 63.6 | 52.6 |
| South Carolina | $86,962 | $60,280 | 11.0 | 64.9 | 55.7 |
| Virginia | $116,015 | $67,460 | 12.2 | 65.8 | 58.8 |
| West Virginia | $89,860 | $58,500 | 11.4 | 58.6 | 46.6 |
| Source: OPM, BLS/Haver Analytics; author's calculations. | |||||
Which Agencies are Big in the Fifth District?
Defense or defense-affiliated agencies have the largest employment presence in the DC-MD-VA area, particularly in Virginia.
| Virginia | Maryland | District of Columbia | |||
|---|---|---|---|---|---|
| Federal Agency | Share % | Federal Agency | Share % | Federal Agency | Share % |
| Department of the Navy | 31.4 | Department of Health and Human Services | 28.1 | Department of Homeland Security | 16.7 |
| Department of Defense | 19.5 | Department of the Navy | 11.9 | Department of Justice | 13.5 |
| Department of the Army | 10.5 | Department of the Army | 10.6 | Department of the Navy | 7.2 |
| Department of Veterans Affairs | 8.2 | Department of Commerce | 9.4 | Department of State | 6.4 |
| Department of Homeland Security | 6.0 | Department of Defense | 7.1 | Department of the Treasury | 4.8 |
| Department of the Air Force | 4.4 | Social Security Administration | 7.0 | Department of Transportation | 4.7 |
| Department of Commerce | 4.4 | Department of Veterans Affairs | 4.5 | Department of Veterans Affairs | 4.6 |
| Department of the Interior | 2.1 | Department of the Treasury | 3.8 | Department of Health and Human Services | 2.8 |
| Department of Agriculture | 1.6 | Department of Homeland Security | 3.2 | Department of Energy | 2.7 |
| Department of Transportation | 1.6 | Department of Agriculture | 2.3 | Environmental Protection Agency | 2.6 |
| National Aeronautics and Space Administration | 1.5 | National Aeronautics and Space Administration | 2.1 | Department of Agriculture | 2.2 |
| Department of Justice | 1.2 | Department of the Air Force | 1.9 | Smithsonian Institution | 2.2 |
| Department of Health and Human Services | 1.2 | Nuclear Regulatory Commission | 1.2 | Department of Commerce | 2.1 |
| National Science Foundation | 1.0 | Department of Energy | 0.8 | Department of Housing and Urban Development | 1.9 |
| Department of the Treasury | 1.0 | General Services Administration | 0.7 | Department of Labor | 1.8 |
| Cumulative | 95.5 | Cumulative | 94.7 | Cumulative | 76.1 |
| Source: OPM; author's calculations. | |||||
The departments of the Navy, Defense, and Army account for about half of all federal government employment in Virginia and almost a third in Maryland. Maryland also houses the headquarters for the Centers for Medicaid and Medicare (CMS), National Institutes of Health (NIH), and the Food and Drug Administration (FDA), thus a large share of employment in the Department of Health and Human Services is in Maryland. The U.S. Census Bureau and the Bureau of Economic Analysis — both Commerce Department agencies — are headquartered in Prince George's County, Md. Although a lot of the employment is concentrated in the D.C. metro area, there are federal agencies with sites across the district. For example, Norfolk, Va., is home to the largest U.S. naval station, which includes both the civilian personnel captured in the OPM data above and the military personnel who are not captured in this data.
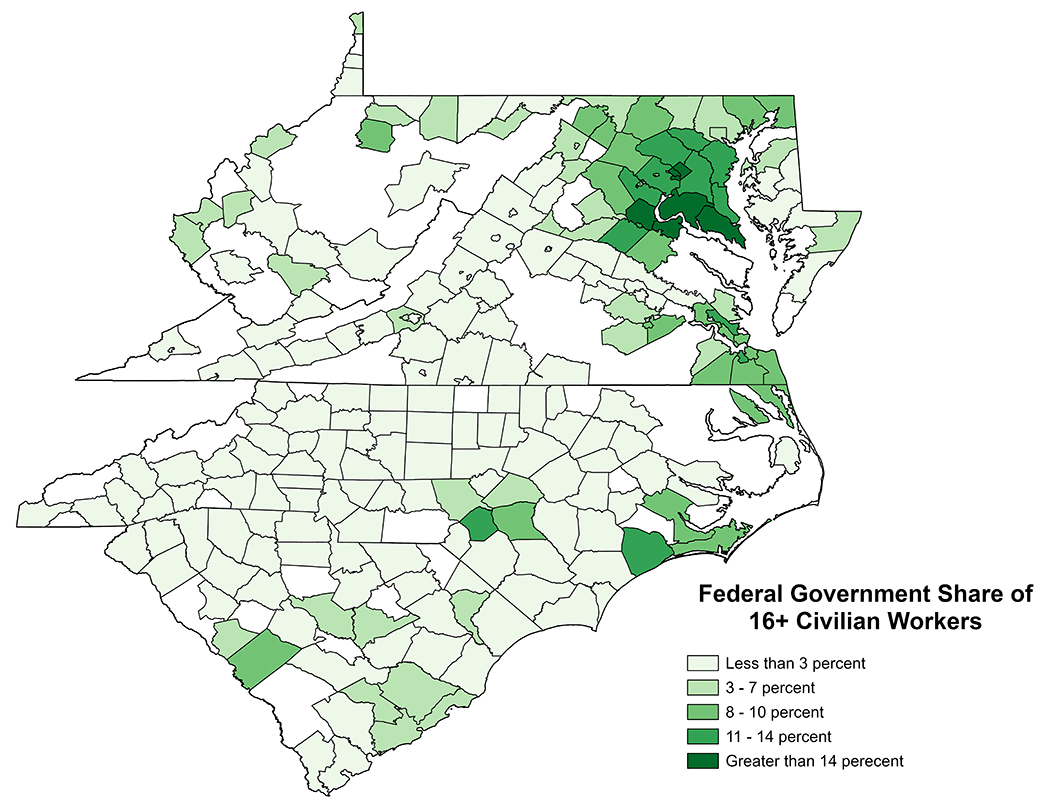
Where Do the Federal Government Workers Live?
The available OPM data identify employment by work location rather than location of residence. The most comprehensive, publicly available data showing where federal workers live is the 2023 American Community Survey 5-Year Estimates. As was the case when exploring data by place of work, the states (or state equivalents) with the highest share of civilian workers employed by the federal government are Maryland, Virginia, and the District of Columbia. West Virginia ranked eighth nationally. The Fifth District was home to just 10 percent of all U.S. civilian workers but 22 percent of civilian workers employed by the federal government.
| Rank (/51) | State/Jurisdiction | Civilian Workers Age 16+ | Civilian Workers Age 16+ Employed by Federal Government | Share of Civilian Workers Age 16+ Employed by Federal Government |
|---|---|---|---|---|
| 1 | District of Columbia | 371,410 | 69,940 | 18.8 |
| 2 | Maryland | 3,133,266 | 325,201 | 10.4 |
| 3 | Virginia | 4,258,744 | 347,959 | 8.2 |
| 4 | Hawaii | 668,094 | 46,382 | 6.9 |
| 5 | New Mexico | 912,332 | 62,613 | 6.9 |
| 6 | Alaska | 338,252 | 22,019 | 6.5 |
| 7 | Oklahoma | 1,808,400 | 85,244 | 4.7 |
| 8 | West Virginia | 740,597 | 31,802 | 4.3 |
| 9 | Alabama | 2,229,912 | 84,348 | 3.8 |
| 10 | Montana | 539,136 | 19,558 | 3.6 |
| ... | ||||
| 23 | South Carolina | 2,388,777 | 61,786 | 2.6 |
| ... | ||||
| 35 | North Carolina | 4,990,710 | 108,329 | 2.2 |
| Source: U.S. Census Bureau 2023 American Community Survey 5-Year Estimates; author's calculations. In many cases, margins of error for federal employment estimates are high for small counties; interpret with caution. | ||||
There are, of course, certain communities that will be more impacted by a cut to federal employment. As illustrated below, 10 counties (excluding D.C.) in the Fifth District account for almost half (46 percent) of the federal government workforce in the district. (See table). Counties like Fairfax (Va.), Montgomery (Md.), and Prince George's (Md.) have very large numbers of residents working for the federal government.
| Rank | County | Civilian Workers Age 16+ | Civilian Workers Age 16+ Employed by Federal Government | Share of Civilian Workers Age 16+ Employed by Federal Government |
|---|---|---|---|---|
| 1 | Fairfax County, Virginia | 610,330 | 81,752 | 13.4 |
| 2 | Montgomery County, Maryland | 559,184 | 74,040 | 13.2 |
| 3 | Prince George's County, Maryland | 498,220 | 70,139 | 14.1 |
| 4 | Anne Arundel County, Maryland | 303,008 | 35,852 | 11.8 |
| 5 | Prince William County, Virginia | 249,301 | 32,197 | 12.9 |
| 6 | Arlington County, Virginia | 145,584 | 27,088 | 18.6 |
| 7 | Baltimore County, Maryland | 428,418 | 24,953 | 5.8 |
| 8 | Howard County, Maryland | 174,635 | 20,620 | 11.8 |
| 9 | Loudoun County, Virginia | 232,066 | 20,383 | 8.8 |
| 10 | Virginia Beach city, Virginia | 223,094 | 19,014 | 8.5 |
| Top 10 5E Counties | 3,423,840 | 406,038 | 11.9 | |
| Rest of 5E (Excluding D.C.) | 12,088,254 | 469,039 | 3.9 | |
| Source: U.S. Census Bureau 2023 American Community Survey 5-Year Estimates; author's calculations. District of Columbia is excluded in county rankings. In many cases, margins of error for federal employment estimates are high for small counties; interpret with caution. | ||||
There are also smaller counties that might have a smaller federal government workforce but that workforce plays a disproportionate role in the local economy. These are often the small counties where, as mentioned by the Urban Institute, military installations or bases drive a lot of the economy. For example, Hoke County, which is just outside Fayetteville, N.C., is home to part of the Fort Bragg military installation. This also includes Perquimans County in eastern North Carolina, which is within driving distance of the Virginia Beach-Norfolk-Newport News metro area and is home to some military testing facilities.
| Rank | County | Civilian Workers Age 16+ | Civilian Workers Age 16+ Employed by Federal Government | Share of Civilian Workers Age 16+ Employed by Federal Government |
|---|---|---|---|---|
| 1 | Los Alamos County, New Mexico | 10,346 | 3,332 | 32.2 |
| 2 | King George County, Virginia | 13,649 | 3,235 | 23.7 |
| 3 | Charles County, Maryland | 85,993 | 18,760 | 21.8 |
| 4 | St. Mary's County, Maryland | 56,954 | 12,079 | 21.2 |
| 5 | Pulaski County, Missouri | 19,195 | 3,971 | 20.7 |
| 6 | Stafford County, Virginia | 77,628 | 15,615 | 20.1 |
| 7 | Rio Arriba County, New Mexico | 15,834 | 3,131 | 19.8 |
| 8 | Todd County, South Dakota | 2,328 | 440 | 18.9 |
| 9 | Alexandria city, Virginia | 95,601 | 17,884 | 18.7 |
| 10 | Arlington County, Virginia | 145,584 | 27,088 | 18.6 |
| 11 | Glacier County, Montana | 4,963 | 919 | 18.5 |
| 12 | Rolette County, North Dakota | 4,319 | 781 | 18.1 |
| 13 | Oglala Lakota County, South Dakota | 3,100 | 533 | 17.2 |
| 14 | Brewster County, Texas | 4,809 | 810 | 16.8 |
| 15 | Roosevelt County, Montana | 3,638 | 612 | 16.8 |
| 16 | Falls Church city, Virginia | 7,778 | 1,265 | 16.3 |
| 17 | Kitsap County, Washington | 121,151 | 19,622 | 16.2 |
| 18 | Bleckley County, Georgia | 4,896 | 790 | 16.1 |
| 19 | Apache County, Arizona | 18,475 | 2,976 | 16.1 |
| 20 | Kinney County, Texas | 1,459 | 230 | 15.8 |
| Source: U.S. Census Bureau 2023 American Community Survey 5-Year Estimates; author's calculations. District of Columbia is excluded in county rankings. In many cases, margins of error for federal employment estimates are high for small counties; interpret with caution. | ||||
What Will the Impact Be?
There are other ways in which federal government spending affects the Fifth District. For example, Virginia and Maryland (in addition to California and Texas) have consistently been some of the top recipients of federal contract dollars. Furthermore, reductions in research grants and spending on medical or biotech research from the federal government might disproportionately impact regions of the Fifth District such as the Research Triangle in North Carolina. Employment counts in this article are lower-bound estimates, since contractors are paid through federal contract money and there are grant-funded positions throughout the country. A reduction in direct federal government employment and spending will undoubtedly affect D.C., Maryland, and Virginia more extensively than the rest of the country, but much depends on how and where the spending reductions are implemented.
1
We do not account for the type of job cuts or other labor market adjustments in the state, such as employees finding different roles.
2
We chose 75 percent because of an early proposal to cut the federal workforce by 75 percent and because other analysis has used that criteria.
3
OPM does not provide detailed location information for a number of Justice and Treasury Department agencies. Employees of these agencies who work in the Washington, DC-MD-VA-WV metropolitan statistical area (see metropolitan statistical area), which includes parts of Maryland, Virginia, and West Virginia, are all reported as working in the District of Columbia (under the United States category). The location of employees in other states is suppressed. Thus, employment in D.C. will be overestimated and employment in other states underestimated.
4
According to the BLS Local Area Unemployment Statistics, the unemployment rate in the Washington, D.C., metro area in the most recent release (December 2024) was 3.2%.
Views expressed are those of the author(s) and do not necessarily reflect those of the Federal Reserve Bank of Richmond or the Federal Reserve System.
Contact Us