How Does USDA Funding Flow into the Fifth District?
Regional Matters
April 17, 2025
Federal funding for economic and community development in rural communities is distributed across over 400 programs. But one agency is technically charged with directing rural policy: the US Department of Agriculture (USDA). In a fragmented federal funding landscape, USDA Rural Development (RD) is the largest source of federal funding for rural economic and community development. To understand how changes to USDA funding might flow through to national and Fifth District communities, it's important to understand where money has gone in the past. How much money are we talking about when we talk about rural development funding? What does the money fund, and where does it go?
How has USDA Rural Development funding trended over time nationally?
USDA RD funding is a collection of individual programs structured in different ways for different purposes. For example, USDA RD programs include direct loans and loan guarantees for housing and community facilities, grants and loans for small businesses, and funding for broadband and physical infrastructure projects. These programs are for qualifying homes, businesses, and communities in rural areas, which are defined at the census tract level. The total dollar value of USDA RD funding nationwide peaked in fiscal year 2020 (FY2020) at $38.4 billion because of pandemic-era special programs and funding increases. This pandemic-era peak was primarily driven by increased funding for single-family housing programs. In FY2020, 62 percent of rural development funding — or about $23.8 billion — supported home purchase, repair, and refinancing.
In the last few years, as the economy returned to a more normal state, so too did RD spending. Total funding in FY2023 and FY2024 moderated to levels roughly equivalent to pre-pandemic funding levels ($26.3 billion and $24.1 billion, respectively). Perhaps not surprisingly, this moderation was primarily driven by funding decreases to single-family housing programs. Single-family housing funding dropped below pre-pandemic levels in FY2022, FY2023, and FY2024. While single-family housing was the highest-dollar program area from FY2012-FY2023, by FY2024, funding for electric grid expansion programs ($9.4 billion) exceeded funding for single-family housing programs ($7.2 billion).
Because we are currently in FY2025, funding data are not yet available, although funding was recently approved by the Full-Year Continuing Appropriations and Extensions Act, 2025. The continuing resolution funds federal programs for FY2025 through Sept. 30 at FY2024 levels and reflects some shifts in program funding. For example, the bill provides $1.6 billion for USDA rental assistance, partially funded by shifting money from other USDA Rural Housing Service programs. Beyond the continuing resolution, it is unclear how rural development funding may be impacted by future federal spending reduction efforts, although early funding cuts have included the Local Food Purchase Assistance (LFPA) and Local Food for Schools (LFS) programs.
How did USDA Rural Development funding flow to Fifth District states?
As was the case with national funding, the Fifth Federal Reserve District — which includes Maryland, Virginia, North Carolina, South Carolina, and most of West Virginia — saw a spike in total rural development dollars through the pandemic, with a post-pandemic normalization. The chart below shows the large drop-off from 2021 to 2022 in both single-family housing funds and in business programs.
In the Fifth District — as is the case nationally — single-family housing programs are a substantial portion of RD funding, accounting for 59 percent ($229.9 billion) of total investment from FY2012-2024. Single-family housing funding is so large that it can make it hard to see funding trends in other program areas, including funding for small businesses, community facilities, and infrastructure.
When we drill down on non-housing program funding levels over time in the Fifth District, we see general program fluctuation as well as changes related to specific shocks. For example, direct loans for community facilities — including schools and community centers — have waxed and waned over time, with dollar values peaking in FY2016, FY2017, and FY2018 and decreasing in subsequent years. Meanwhile, business loan guarantee dollars increased notably in FY2021 to support businesses through the pandemic. Outside of the pandemic, the size of the business loan guarantee program has stayed relatively steady. Infrastructure and electric programs have also been drivers of funding fluctuations, with increased infrastructure funding flowing into the Fifth District in FY2024 relative to past years.
Rural development funding is varied at the state level, with two Fifth District states standing out among all states nationwide: North Carolina received the highest total investment dollars of any state from FY2012-FY2024, and Virginia received the second highest. In FY2024, Virginia received the highest total amount of RD funding in the Fifth District at $1.3 billion.
| State | Total, FY2012-FY2024 | FY2024 |
|---|---|---|
| North Carolina | $20.0 billion | $960.1 million |
| Virginia | $18.4 billion | $1.3 billion |
| South Carolina | $12.4 billion | $933.9 million |
| Maryland | $6.9 billion | $167.6 million |
| West Virginia | $4.8 billion | $241.4 million |
When we examine rural development funding relative to state population, West Virginia has the highest per capita investment among Fifth District states at $2,713/person. Although states like North Carolina and Virginia attract a higher level of investment, they are far more populous. Per capita figures provide a more nuanced sense of rural development funding in less populous, more rural states.
| State | Total, FY2012-FY2024 |
|---|---|
| West Virginia | $2,713 |
| South Carolina | $2,303 |
| Virginia | $2,213 |
| North Carolina | $1,847 |
| Maryland | $1,116 |
| Note: Per capita investments are calculated by dividing total state rural development funding (FY2024) by total state population (2023). | |
How did USDA Rural Development funding flow to Fifth District counties?
Funding varies across counties in the Fifth District as well and, in some cases, specific counties have received considerably more funding than others. For example, when we look at total spending over the last 12 years in single-family and multifamily programs, we see notable differences. The map below shows that county-level funding for single-family and multifamily programs ranges from less than $40,000 in Hampton City, Va., to $1.3 billion in Berkeley County, W. Va. A few other counties saw investments over $1 billion, including Wake and Johnston counties in North Carolina and Spartanburg County, S.C.
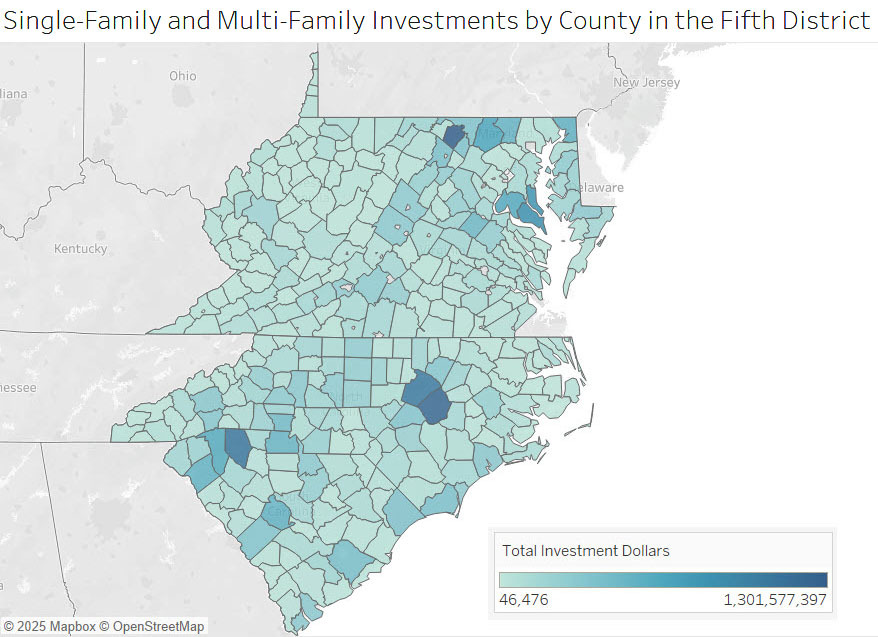
To be eligible for any of these housing programs, the home must be in a rural area as determined by the USDA. And because the USDA defines rural areas at the census tract level and not at the county level, we see some funding going to counties with high population density. For example, less than 1 percent of Hampton City, Va.'s population lives in a rural area according to this definition, but a small amount of USDA housing program funding went to the city.
The counties of Wake and Johnston in North Carolina are both part of the Raleigh metro area and both received large amounts of funding over the last 12 years despite a large difference in the number of qualifying rural areas in each county. In Wake County, only about 5 percent of the population live in rural areas, whereas in Johnston County that figure is about 53 percent. Despite this difference, Wake received almost 5,300 investments worth just over $1 billion and Johnston received about 6,500 investments worth about $1.2 billion. Both counties have seen significant population growth since 2010, growing around 48 percent compared to statewide growth of 16 percent.
Funding for non-housing programs for businesses, community development, and environmental and water projects also varies but is distributed across more counties. The map below shows that there is still a considerable range of investment dollars by county, with only about $20,000 going to Chesapeake City, Va., and over $182 million going to Beaufort County, S.C. Again, this is partly due to the rural eligibility requirements and some counties in the Fifth District, like many of Virginia's independent cities, having much less qualifying area. Nevertheless, the map also shows more dispersion of funding across counties than we saw in housing programs.
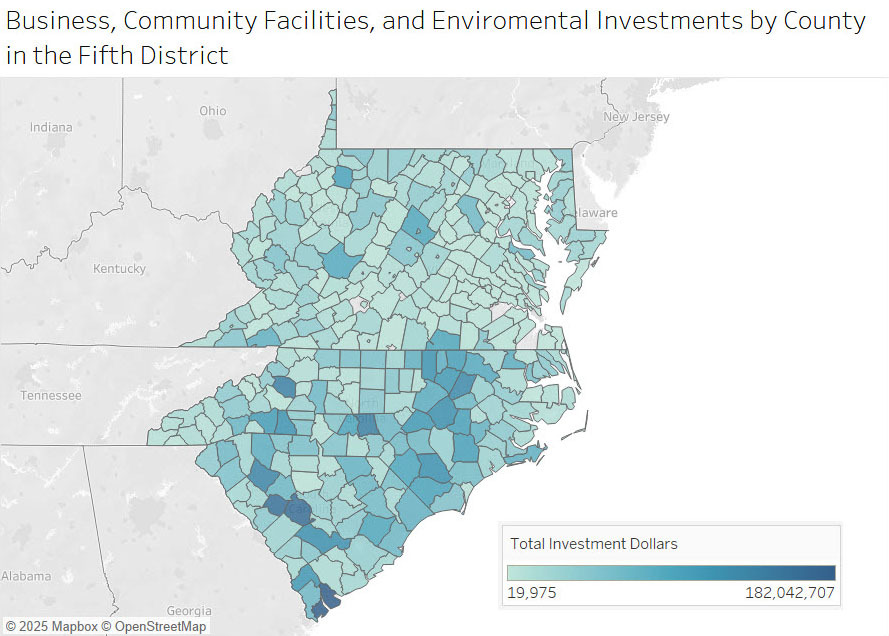
Unlike housing programs, the total value of non-housing program dollars received by a county can largely be driven by a few high-value investments. For example, in Beaufort County, S.C., about $118 million of the total funding received between FY2012-2024 were loans for building and expanding two educational facilities in the county as part of the community facility direct loan program. The largest loan in Beaufort in one fiscal year was almost $40 million for building a leadership academy.
The distinction between loans (that have to be repaid to the government) and grants is important: 98 percent of the total funding that went to Beaufort was for loans and not grants. In fact, the majority of USDA investments made in the Fifth District over the 12-year period was for loans, either direct or guaranteed. Investments varied across Fifth District states, but the grant investment was less than 10 percent in every state.
Conclusion
After a pandemic-era peak in USDA Rural Development funding both nationwide and in the Fifth District, funding levels have normalized. Single-family housing programs are the single largest investment area for RD funding overall, although funding for single-family housing declined in recent years to below pre-pandemic levels. Fifth District states have attracted a sizeable portion of USDA RD funding over time, with North Carolina and Virginia leading the Fifth District — and the nation — in total funding and West Virginia leading the Fifth District in per capita funding. Some of the largest-dollar investments went to Fifth District counties that we would consider urban, although the funds are only available to the rural census tracts within those counties.
Once available, FY2025 data will shed light on RD funding changes nationally and in the Fifth District. In the meantime, understanding RD funding distribution by geography and program area remains critical for determining the impact of potential funding changes for rural areas.
Views expressed are those of the author(s) and do not necessarily reflect those of the Federal Reserve Bank of Richmond or the Federal Reserve System.
Contact Us