Getting the Job Done ... From Home
Many employers changed their work arrangements during 2020 in response to the COVID-19 pandemic. In particular, the number of people working from home increased substantially. But as we'll see in this post, there is some discrepancy between our two main sources of information about this labor market development.
"Comparing 2019 and 2020 ... average work time increased or stayed the same for all education groups. What changed was where people worked."
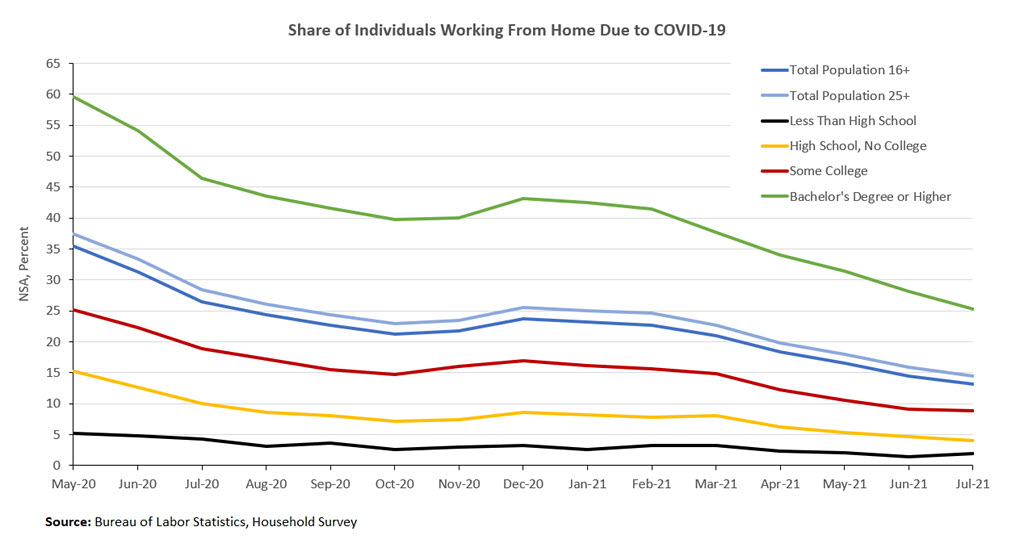
To keep track of the alternative work arrangements that arose during the pandemic, the Bureau of Labor Statistics (BLS) added a new question to the Household Survey and asked participants whether they were working from home for pandemic-related reasons at any time in the four weeks preceding the interview. Figure 1 below plots the fraction of people working from home in the overall population ages 16 and older as well as in four education categories — less than high school, high school, some college, and a bachelor's degree or higher — in the population ages 25 and older. (The BLS survey distinguishes groups by education only for this age group.) The fraction of those working at home (WaH) was initially quite high, especially for those with more education, but has been declining continuously since May 2020. One exception was the late 2020 resurgence of COVID-19, and as of July 2021, 13 percent continue to work from home. From May to December 2020, on average about 26 percent of those employed were working from home for pandemic-related reasons.
In July 2021, the BLS published the annual American Time Use Survey (ATUS) for 2020. This survey, which is a follow-up for participants in the Household Survey, provides additional detail on how Americans use their time on an average day in a year.
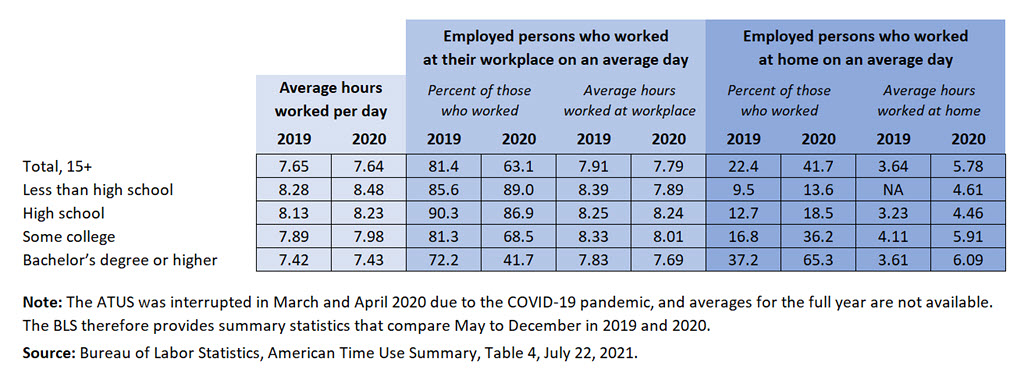
Table 1 below lists the average hours worked on an average day for those ages 15 and older and by education for those ages 25 and older in 2019 and 2020. The first two columns list the average hours worked for those working on an average day. The next eight columns provide additional detail on where people worked, either at their workplace or at home, and the average time worked at each location.
It is worth making two points. First, the fraction of those WaH includes both people working exclusively at home and people who take some of their work home from the office. Thus, the fraction of those WaH and at the workplace adds up to more than 100 percent. Second, the workplace and home are not the only places people work. There is a third category — other places — that is not listed here. This would include, for example, a real estate agent meeting a client at a coffee shop.
Comparing 2019 and 2020, we see that for the people who worked, average work time was essentially the same in both years, and in the population ages 25 and older, average work time increased or stayed the same for all education groups. What changed was where people worked.
In 2019, roughly 80 percent worked at their workplace, and roughly 20 percent did some or all of their work at home. WaH was more prevalent among those with higher education: More than a third of those with at least a college degree did some work at home, whereas less than 10 percent of those with less than a high school diploma worked some time at home. People with a college education also tended to work longer at home. But overall, the average time worked at home was only about half the time worked at the workplace.
Looking at 2020, we see that the share of those WaH roughly doubled to about 40 percent. It increased for all education groups, but relatively more for those with more education. Furthermore, the average time spent working at the workplace declined and the time spent WaH increased by roughly 60 percent. Nevertheless, on average those WaH worked roughly 25 percent less than those working at the workplace.
Finally, it appears that ATUS and the Household Survey disagree on the fraction of people WaH because of the pandemic. According to ATUS, in the population ages 15 and older, the fraction of those WaH for some time increased by about 20 percentage points from 2019 to 2020. But according to the Household Survey, from May to December 2020, on average 26 percent of all employed worked at home for some time because of the pandemic. This discrepancy is even bigger for those ages 25 and older with a college degree. For this group, the fraction of those WaH for some time increased by 28 percentage points from 2019 to 2020, according to ATUS. But according to the Household Survey, for the year 2020, on average 46 percent spent some time WaH because of the pandemic.
These differences underscore the challenges of gathering complete and accurate data about the labor market, particularly during periods of heightened uncertainty, and thus the challenges facing policymakers who must act on those data.
Views expressed in this article are those of the author and not necessarily those of the Federal Reserve Bank of Richmond or the Federal Reserve System.


