Phantom Figures: Missing Data in October
Macro Minute
December 16, 2025
According to the Bureau of Labor Statistics (BLS), the government shutdown interrupted the collection of price data in October, resulting in the cancellation of the October consumer price index (CPI) print. Additionally, the BLS was unable to collect data used to calculate the unemployment rate and labor force participation rate in October, saying that "household survey data from the Current Population Survey were not collected for the October 2025 reference period due to a lapse in appropriations and will not be collected retroactively." The resulting missing values for these series are historically unprecedented: The (not seasonally adjusted) monthly CPI series has been published continuously since January 1921, and the monthly unemployment rate has been published continuously since January 1948.
Fortunately, November data will be published fully, with the unemployment rate released this morning (Dec. 16) and CPI coming out Dec. 18. While a simple way to plug in the missing hole would be to draw a straight line between September and November, what would "actual" conditions have looked like in October if data were available? In this week's post, we look at some alternative indicators which might be used to infer inflation and unemployment conditions in October.
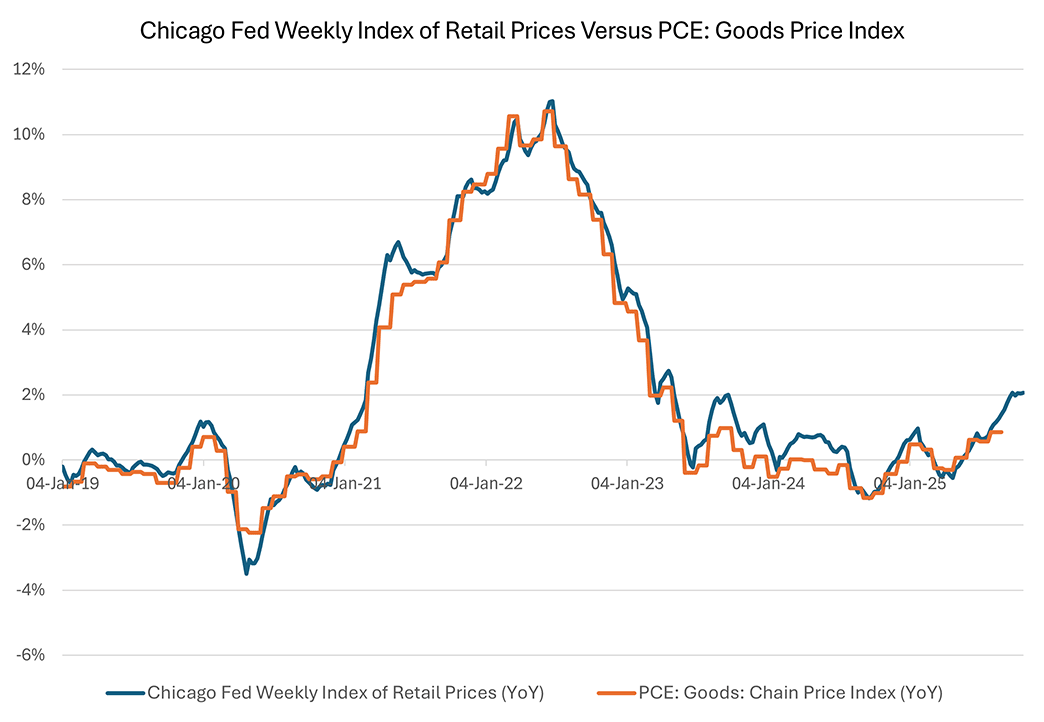
High-frequency data available from several sources can signal goods prices. One measure produced by the Chicago Fed — the Chicago Fed Advance Retail Trade Summary (CARTS) — compiles data from several public and private sector sources to generate a weekly measure of retail prices. As shown in Figure 1 below, this measure provides a reasonable signal for the official goods price index in PCE. The latest weekly CARTS (available through Oct. 28 at the time this post was written) suggests that year-over-year goods inflation likely increased further in the month of October.
For services inflation, there are fewer reliable high-frequency price indicators available. However, labor is the largest input for many services-providing businesses, and thus measures of labor compensation growth could provide useful information about the trajectory of services prices.
One source of alternative data for compensation growth is the ADP Pay Insights report, which breaks down median year-over-year change in annual pay across various industries. Figure 2 below plots the weighted average of pay growth in services-providing industries — trade, transportation, and utilities; information; financial activities; professional and business services; education and health services; leisure and hospitality; and other services — weighted by each industry's share of nonfarm payroll employment. Figure 2 shows that this measure captures the broad movement of services inflation over the past six years. In October, services pay growth increased slightly, which may indicate that official services inflation could have remained elevated in October.

Finally, we turn to the unemployment rate. The government shutdown revealed a lack of good substitutes for the nationally representative, systematically collected information in the CPS (or "household survey"). However, state-level data on unemployment claims continued to be produced. The share of unemployment insurance-covered individuals collecting claims is known as the insured unemployment rate, and Figure 3 below shows that the insured unemployment rate has historically moved in tandem with the official U-3 unemployment rate (which is the most commonly reported unemployment rate) computed from the monthly household survey.
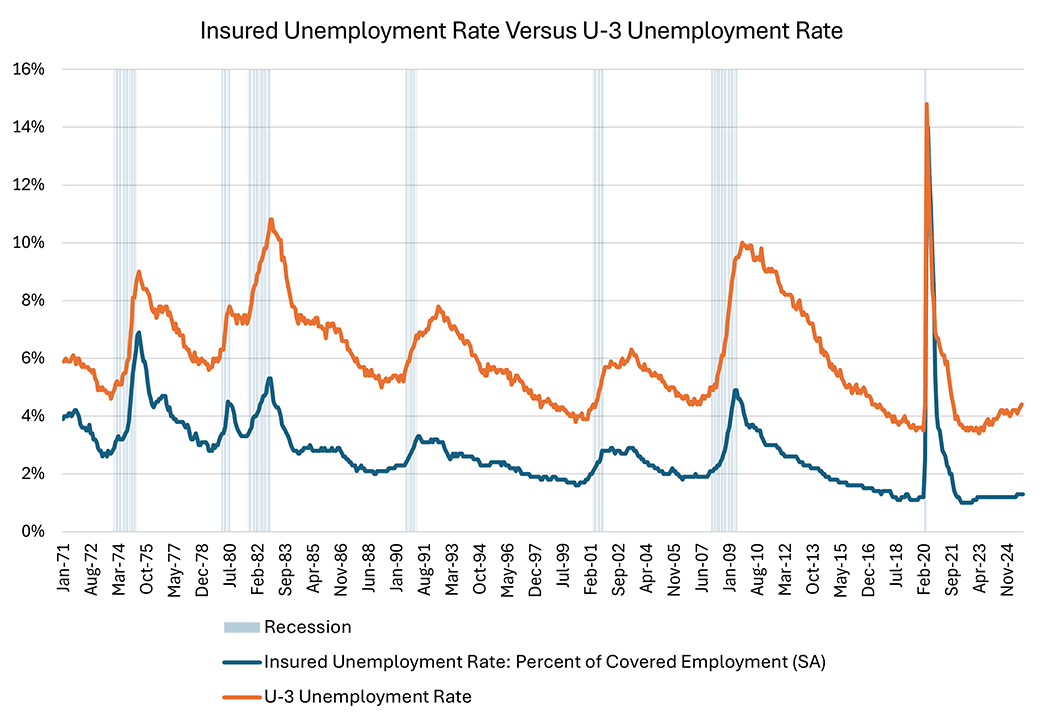
In recent weeks, the insured unemployment rate has remained flat at 1.3 percent, which suggests that the overall labor market has generally been stable through October. However, Figure 3 shows that, in the most recent monthly data, the U-3 has ticked up while the insured unemployment rate has remained flat.
This divergence may be due to two factors. First, the insured unemployment rate may miss signs of a weaker labor market affecting the newest entrants into the labor force: In general, workers have to build up several months of work history before becoming eligible for unemployment insurance. Second, the insured unemployment rate may also miss signs of a weaker labor market for the longest-unemployed workers: Because unemployment benefits are capped at a certain duration, the longest-unemployed workers may no longer be able to claim benefits. As a result, the insured unemployment rate can provide only a limited picture of labor market conditions affecting the broader population.
This exercise reveals the challenges of replacing official data with alternative measures. Economy-watchers may not be flying totally blind when it comes to economic conditions in October, but alternative data are an imperfect substitute for the fuller picture given by official public data.
Note: Macro Minute will take a break for the holidays. The blog will return Jan. 13, 2026. Happy holidays, and see you in the new year!
Views expressed in this article are those of the author and not necessarily those of the Federal Reserve Bank of Richmond or the Federal Reserve System.
Contact Us