How COVID-19 is Affecting Main Street
Special Report
April 17, 2020
Local businesses and hourly workers appear to be particularly vulnerable to social distancing measures and the economic shut down that has followed the COVID-19 outbreak in the United States. Further, many local businesses employ hourly workers, amplifying these effects. We present some high frequency statistics describing the reaction of local businesses and their hourly employees to COVID-19. Our source is the online data made available by Homebase, which tracks more than 100,000 local businesses and their hourly employees around the U.S. The data consist primarily of restaurants, food and beverage, retail and services businesses. We present data for (i) local businesses open; (ii) hourly employees working; (iii) hours worked by hourly employees; and (iv) monthly income lost by hourly employees. With the exception of monthly income lost by hourly employees, all figures report the percentage change in the variable of interest in a particular day compared to the median for that day of the week for the period Jan. 4 to Jan. 31.
Main Street and the U.S. Economy
Figure 1 below shows the overall economy’s response to COVID-19, with hours worked by hourly employees, the number of local businesses open, and the number of employees working. All three series show sharp declines relative to the same day of the week in January. For example, between March 8 and April 5, hours worked by hourly employees fell by 70 percent, while only 50 percent of local businesses remained open at the end of the period. This highlights the massive effect of COVID-19 on Main Street. Further, the decline in hours worked by hourly employees and the decline in the number of employees are almost identical. This implies that almost all of the adjustment in the labor force of local businesses occurred through the extensive margin of labor.
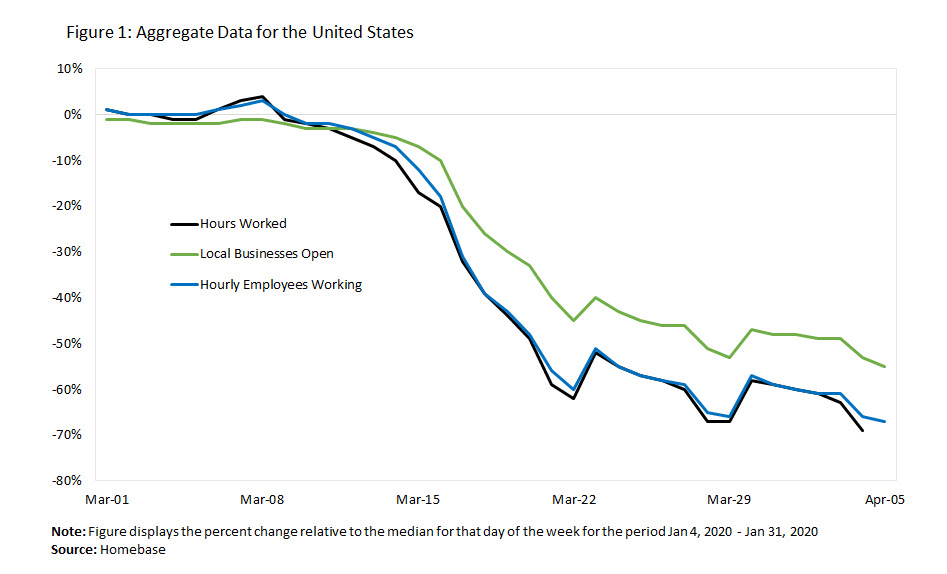
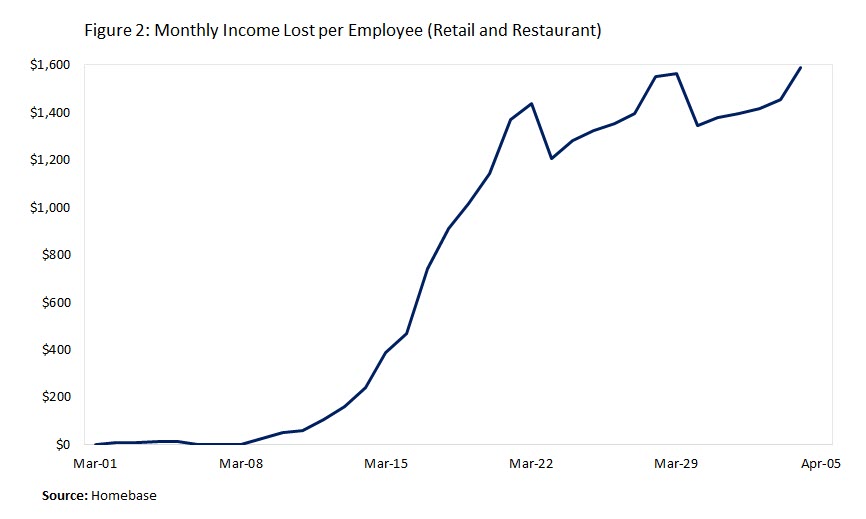
Figure 2 presents the average monthly income lost per employee in the retail and restaurant sector, which as of April 5, stood at $1,600. It is interesting to compare this number to the amount unemployed workers can receive from the recently expanded unemployment insurance (UI) system. Based on the expanded UI benefits provided in Virginia, we estimate that an unemployed worker can receive a monthly transfer of around $4,000. Workers who qualify for the stimulus check provided by the Coronavirus Aid, Relief, and Economic Security (CARES) Act may receive up to $5,200 in the month they receive the check.
Main Street and Industries
The data made available by Homebase allow us to study the severity of COVID-19's impact on hours worked by hourly employees and the number of local businesses open across industries. Figure 3 presents hours worked by hourly employees for Food Services, Leisure & Entertainment, and Transportation. For comparison, we have also included the series for the aggregate U.S. economy (originally presented in Figure 1). As expected, activity fell across the board. However, there is wide heterogeneity across sectors. While Food Services closely tracks the U.S. economy — with a fall of 70 percent in daily hours worked — the fall in hours worked by hourly employees in Transportation was about 25 percentage points less than the fall in hours worked by hourly employees overall. The fall in hours worked by hourly employees in Leisure & Entertainment dwarfed the decline for the aggregate economy, with a decline of around 90 percent.
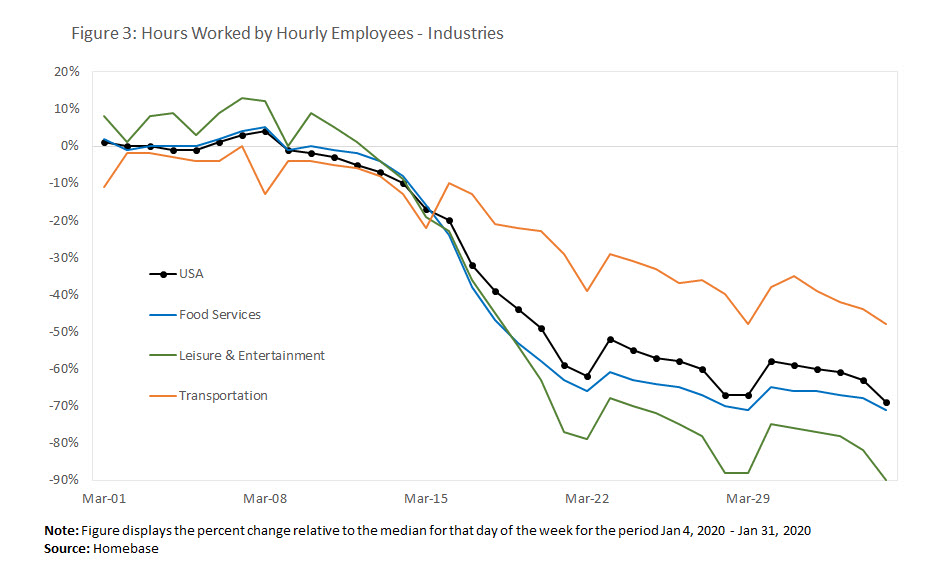
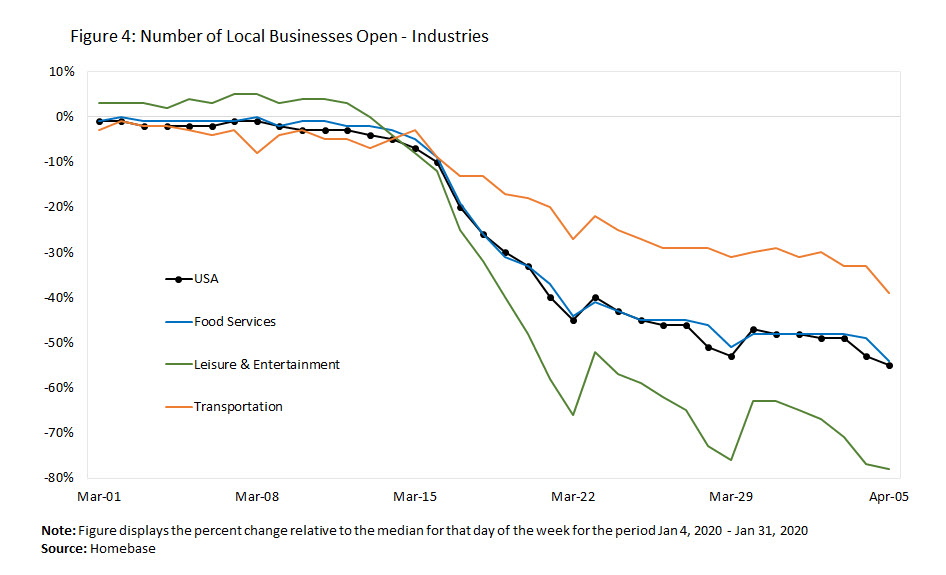
Figure 4 tracks the number of local businesses open in the same four sectors. Figures 3 and 4 show similar trends. Notably, nearly 55 percent of local businesses that were typically open on Sundays in January were closed on Sunday, April 5.
The Geography of Main Street
As with industries, Homebase allows us to study the effect of COVID-19 across space. Figure 5 presents hours worked by hourly employees for New York, Richmond, and Washington, D.C. As before, for reference, we include a series for the aggregate U.S. economy, also produced by Homebase. The figure shows that while the fall in hours worked by hourly employees in Washington, D.C., closely tracks the decline for the U.S. economy, the decline in Richmond is smaller and the decline in New York is significantly larger.
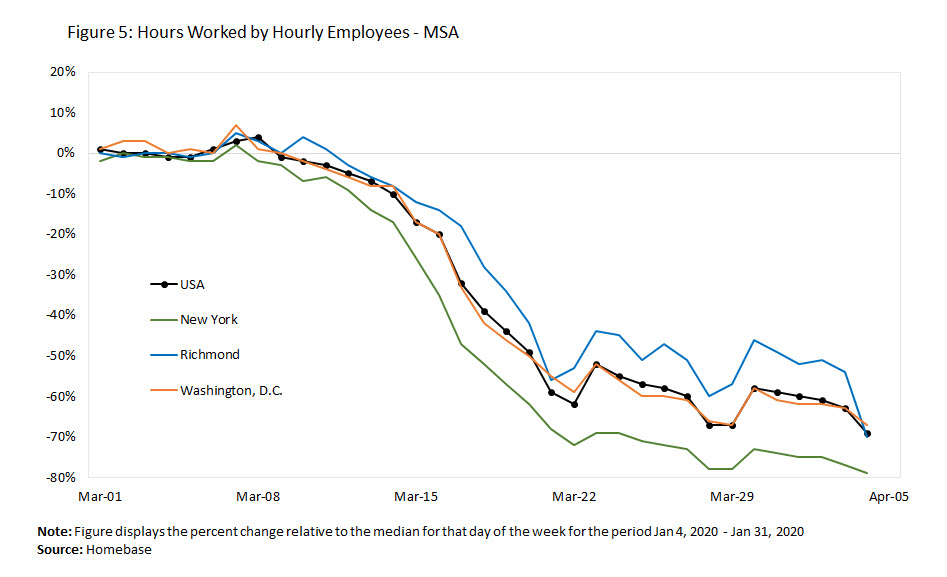
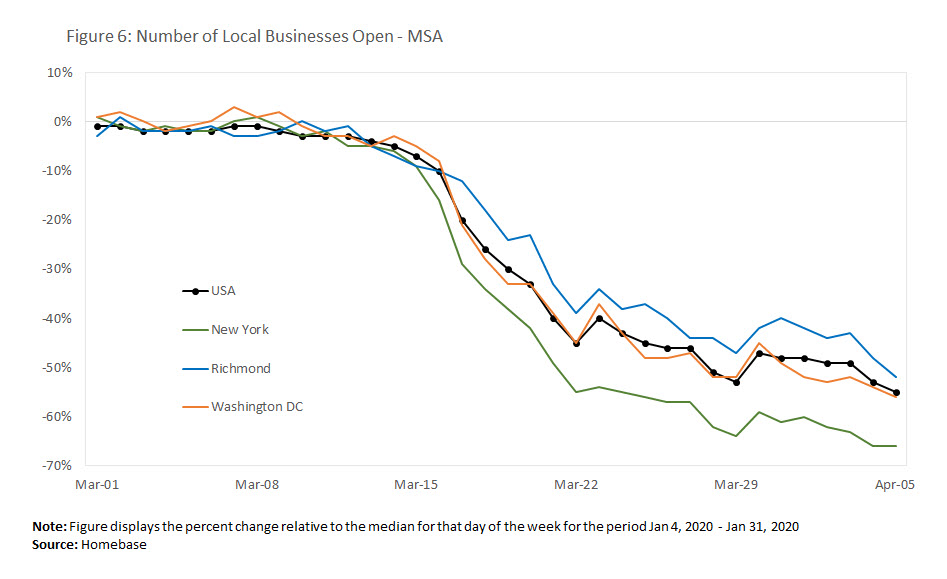
Figure 6 presents the number of local businesses open across metropolitan statistical areas (MSAs). While Richmond and Washington, D.C., experienced a 50 percent and 55 percent decline in the number of businesses open, respectively, New York’s decline was greater at around 65 percent.
The geographical heterogeneity of COVID-19’s economic impact is worth analyzing further. One very reasonable explanation is that denser cities were affected earlier than cities with low population density. If this is true, we should expect all cities to eventually track New York’s path. Under this scenario, we should expect further downward trajectories for hours worked by hourly employees and the number of local businesses open in Washington, D.C., and Richmond. Another possibility is that cities have persistently different trajectories. One popular explanation for this scenario builds on the assumption that job composition varies across cities, and that some cities (i.e., New York) have a larger share of jobs that are more exposed to COVID-19 than other cities (i.e., Richmond). For example, if New York has a larger share of jobs in the service industry than Richmond, New York will be more affected than Richmond when the service industry contracts as a result of COVID-19. Although this argument is reasonable, Homebase collects data primarily for the most exposed industries (i.e., food and retail). As a result, it seems that the data are "controlling" for industry composition, at least at a very basic level. Thus, there may be alternative explanations for differences across cities and within industries. One possibility is that jobs and firms across cities are diversely exposed to the pandemic. For example, restaurants in New York may be more dependent on tourism than restaurants in Richmond. Or, the available space in a city (its population density) affects the likelihood of exposure to the virus and hence, economic activity. For example, navigating around a crowded shopping center is more dangerous than navigating around an empty shopping center of the same size. That is, for a given amount of space, it may be that newly infected individuals increase disproportionately to the number of those already infected.
We recognize that these ideas can only be rigorously analyzed in the context of fully specified models, which is not the purpose of this simple analysis. Further, we did not consider differences in the implementation dates of the mandatory shutdowns across cities as potential explanations of the heterogeneous trajectories that we observe across cities. In the future, we hope to study this in further detail, and revisit the ideas discussed above as more data become available.
Final Observations
We have presented evidence of the effect of COVID-19 on Main Street. In particular, we observe a pronounced fall in activity and employment in local businesses. The extent of the decline varies across industries and across geographies. Although hourly employees seem to be properly insured by the expanded UI system, it is unclear what the long run effect of COVID-19 will be on local businesses and, eventually, on its employees. Relative to January, around 50 percent of these local businesses are now closed. If the fall in demand persists for a long time, the viability of these (likely more cash and credit constrained) businesses remains to be seen. Will these businesses reopen? Will new businesses take the opportunity to enter the market? Will larger firms expand their footprint in the location? Or will there be a new equilibrium with fewer businesses and establishments? As a result, the medium- and long-run situation of the hourly workers that worked for these local businesses is highly uncertain.
At a basic level, the figures presented above reveal interesting shopping patterns. In particular, on weekends (e.g., March 21-22 or March 28-29) there is a further decline in economic activity, with a small rebound at the beginning of each week. This is perhaps because in a typical month like January (the comparison month for the Homebase study), shopping and entertainment are concentrated on the weekends since the value of time is higher in weekdays in normal times. During the pandemic, however, economic activity (at least shopping) is spread around the week due to more availability, and the fact that there are stronger reasons to avoid going to the supermarket when everyone is doing the same.
Finally, we observe a sharp decline in hours worked by hourly employees, the number of local businesses open, and the number of employees working during the first two weeks of March, followed by a stabilization period starting in mid-March until now. A conjecture is that economic activity, at least in these industries, is not going to deteriorate further, but will rather stabilize at the current level of underutilization. It remains to be seen if the conjecture holds true in the data, which we will explore in a few weeks as more data become available.
Marios Karabarbounis is an economist and Nicholas Trachter is a senior economist in the Research Department of the Federal Reserve Bank of Richmond
This article may be photocopied or reprinted in its entirety. Please credit the authors, source, and the Federal Reserve Bank of Richmond and include the italicized statement below.
Views expressed in this article are those of the authors and not necessarily those of the Federal Reserve Bank of Richmond or the Federal Reserve System.