Skip to Main Content

Business Dynamics in the United States and the Fifth District

Econ Focus
First Quarter 2017
District Digest

The dynamics of firm creation and exit are an important engine of economic growth. Entrepreneurs identify an opportunity, enter the market, and increase competition by offering new goods and services. In the process, they add to the demand for labor, make investments in equipment and software, and contract for services from other businesses. At the same time, some businesses become obsolete either because consumers are no longer interested in their products or services or because their competitors are able to offer a higher-quality product or service or a lower price; in such cases, the firms exit and the resources they utilized, such as labor, are then freed to be used by more productive firms. Studies have shown a prominent role of business startups in job growth and have found a positive relationship between entry and exit and productivity growth.

Researchers have noted that there has been a slowing in business dynamics in the United States in recent decades. Job creation and job destruction rates have declined since the late 1970s, and net job creation has trended lower as well. Lower business startup activity is one of the factors responsible for this slowdown. The rate at which new firms are created has declined since the late 1970s, and their contribution to employment growth has decreased as well. The Great Recession of 2007-2009 further contributed to this decline; job creation and destruction rates, as well as new business formation, dropped sharply and have remained at levels well below those prior to the recession.

Slowdown in Business Dynamics

While there are noticeable changes during recessions, when new business formation drops and the exit rate of existing firms increases, the general trend over the last four decades is fairly clear: The rate of decline for job creation has been slightly faster than job destruction resulting in a slowing in the net job creation rate over time. These trends for the United States and the Fifth District are highlighted in the chart below on job creation and destruction rates. The data are from the Census Bureau's Business Dynamics Statistics (BDS) database, which is based on an annual survey of the more than 6 million establishments in the United States. The survey, taken since 1976, captures information on establishment openings and closings; firm startups; job creation and destruction by firm size, age, and industrial sector; and other data related to business dynamics.

When looking at job creation and destruction, a couple of things stand out. First, the overall trend and movements for the United States and the Fifth District are very similar. This is not unexpected. Given the industry composition and diversity of the regional economies, the Fifth District economy is fairly representative of the broader national economy.

Second, while job creation, job destruction, and net job creation have all declined since 1977, the job creation rate declined considerably faster than the job destruction rate. In the late 1970s, the job creation rate averaged 20.9 percent and then declined steadily to 13.4 percent from 2010-2014 — a cumulative decline of 7.5 percentage points. The decline in the job destruction rate was not as pronounced. After averaging 14.8 percent from 1977-1979, the job destruction rate averaged 16.2 percent in the 1980s, 14.8 percent for next two decades, and 12 percent from 2010-2014 — a much smaller cumulative decline of just 2.8 percentage points from the late 1970s or 4.1 percentage points from the 1980s. Thus, there has been a decline in the net job creation rate over this period.

Lastly, the severity of the recessions in the early 1980s and the Great Recession are readily apparent from the sharp decline in job creation and the notable increase in job destruction during those periods. A major difference between the two is that the job destruction rate returned to its pre-recession level following the 1980s recession but not following the Great Recession. Instead, both the job destruction rate and the job creation rate returned to levels below where they were prior to the recession — reflecting the moderate growth and less dynamic economy during the recovery. Since both rates dropped, however, the net job creation rate returned to above 2 percent from 2011 to 2014 (2.2 percent average), close to the average for the 2000s expansion.

Slowdown in Startup Activity

Underlying the slowdown in job creation has been a slowdown in startup activity. The major break came during the Great Recession: The number of new firms in the economy each year had been steady at around 500,000 from 1977 through the mid-2000s, but there was then a notable drop during the Great Recession and entrepreneurial activity has remained subdued since; the number of new firms each year since the recession has averaged roughly 400,000. When compared with a growing economy, the fact that the number of startups was relatively steady over such a long period of time reflected declining entrepreneurial activity.

Startups have declined not only in absolute numbers, but also as a proportion of all firms. The 564,000 startups in 1977 represented 16.5 percent of firms in the economy, whereas the 557,000 new firms in 2006 represented just 10.8 percent of firms. That percentage fell further during the Great Recession to 8.0 percent, where it has remained. (See chart below.)

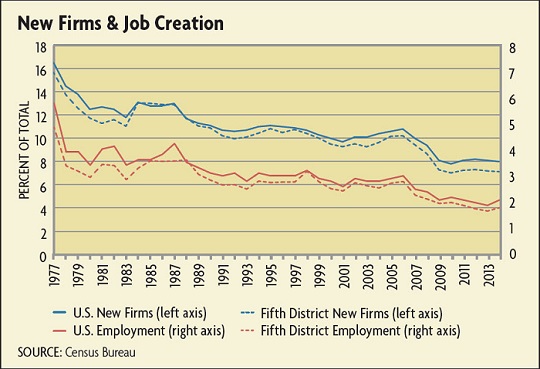
Declining startup activity has hurt job growth. In a 2010 National Bureau of Economic Research working paper, John Haltiwanger of the University of Maryland and Ron Jarmin and Javier Miranda of the Census Bureau found that "firm births contribute substantially to both gross and net job creation" and that startups play a "critical role" in U.S. employment growth dynamics. For those startups and younger firms that survive, their growth rate is considerably higher than that of more mature firms. In that paper, they found that business startups account for roughly 3 percent of total employment in any year from 1992 to 2005. But that percentage was higher prior to 1992, averaging close to 4 percent prior and averaging just 2 percent from 2006 to 2014.

So what has been the cause of the slowdown in business dynamics and the decline in new firm formation? There has been no definitive accounting for the dynamics of firm entry and exit and the trends observed in the data. In a 2013 National Bureau of Economic Research working paper, Daron Acemoglu of the Massachusetts Institute of Technology, Ufuk Akcigit of the University of Chicago, Nicholas Bloom of Stanford University, and William Kerr of Harvard Business School looked at innovation and productivity growth to explain firm entry and exit. They found that policies that subsidize either the research and development or the continued operation of incumbent firms stifle the formation of new firms. They argued that incumbent firms that are slow to innovate use research and development resources inefficiently. Eliminating subsidies would free up these resources for incumbent firms that are more innovative as well as for new firms.

Similarly, a 2006 article by Haltiwanger and Lucia Foster and C.J. Krizan of the Census Bureau in the Review of Economics and Statistics looked at the restructuring in the retail trade sector in the 1990s and found that much of the restructuring was due to more productive establishments entering the market to displace existing establishments that are less productive. They noted that the "productivity gap between low-productivity exiting single-unit establishments and entering high-productivity establishments from large, national chains plays a disproportionate role in these dynamics."

In a 2004 article in Annals of Regional Science that examined the determinants of new firm formation in the manufacturing sector in Texas from 1970 to 1991, Donald Hicks of the University of Texas at Dallas and Vinod Sutaria, then a doctoral student there, looked at a number of factors to explain firm formation: demographics, labor market conditions, industrial restructuring, availability of local finance, local government spending, and local business dynamics. They found that new firm formation was reduced by rising unemployment rates in a metro region and was boosted by higher average establishment size and availability of capital (as measured by local per capita bank deposits) in a metro region. They also found that population and per capita personal income growth were not factors that influenced new firm formation.

In a 2014 paper, Ian Hathaway of the Brookings Institution and Robert Litan, formerly at Brookings, used the BDS data to look at the variation in startup rates across U.S. metropolitan areas and found two prominent drivers of regional differences: population growth and business consolidation. Contrary to the results of Sutaria and Hicks, Hathaway and Litan found that firm formation tends to be higher in regions with greater population and real per capita income growth. They noted that regions with the highest firm entry rates in the late 1970s were strongly correlated with population growth in the 1970s, and the opposite was true for regions with lower firm formation rates. They ran several regressions and in one found that the change in population from the late 1970s to the mid-2000s had a large positive effect on startups. When they accounted for region-specific effects, they found that the estimated impact of population change over the prior three years is reduced but still strong and statistically significant. They also find that income per capita is a significant factor, although they estimate that the impact of population change is three times greater than income per capita.

Hathaway and Litan also looked at the possible effect of an aging population. Prior research has suggested that individuals age 35 to 44 have the highest propensity to start a new business. To examine the possible impact of an aging population on startup activity, they included that age group in their regressions and found that when controlling for regional factors, the share of the population between 35 and 44 does greatly influence firm formation rates — and the impact is greater than that of per capita income growth.

The other significant driver of new firm formation in their results is business consolidation. In previous work, Hathaway and Litan documented an increase in business consolidation across geographies and sectors over the past few decades. They found that the firm formation tends to be higher in regions with less business consolidation. They defined business consolidation as an increase in the ratio of the average firm size to the average establishment size. A ratio of 1.0 would indicate no consolidation as each firm has one establishment. As the ratio increases, there are more multi-establishment firms. They argue that greater concentration would be associated with higher barriers to entry and thus would reduce firm formation.

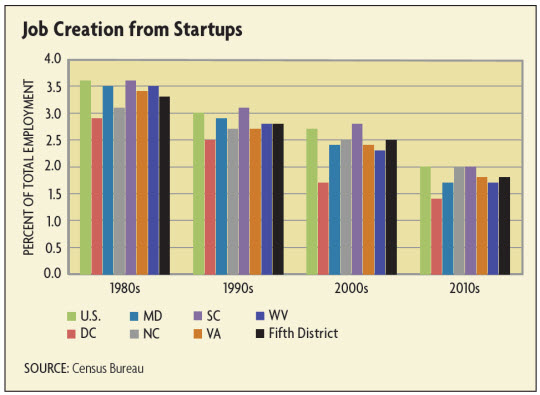
Slowdown Across Sectors

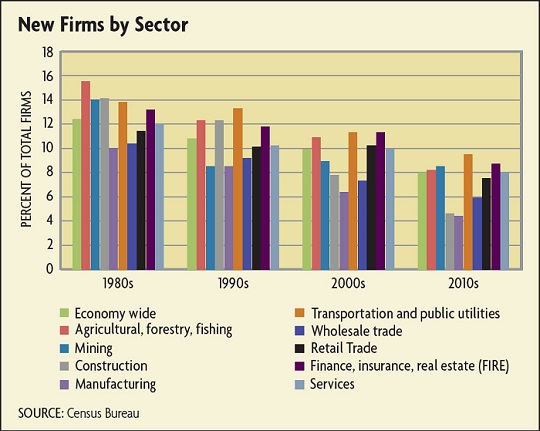
The long-term slowdown in business dynamism and startup activity has been observed across industries. Each industry sector has experienced a decline in its firm formation rate, although there are some notable differences across industries. (See chart below.) Comparing the 1980s to 2010-2014, the average decline was 5.4 percentage points, with the goods-producing sectors experiencing the largest declines. The greatest decline was in the construction sector. In the 1980s, the startup rate in the construction sector averaged 14.1 percent — the second-highest rate after agricultural, forestry, and fishing and just slightly above mining. The construction startup rate fell by 9.6 percentage points to an average of 4.6 percent in 2010-2014, the second-lowest rate among all industries. Startup activity in the agricultural, forestry, and fishing sector experienced the second-largest decline, by 7.3 percentage points.

In contrast, declines in service-oriented industries were less severe although still significant, ranging between 3.9 percentage points and 4.5 percentage points. Retail trade and services (a broad category that includes professional workers, research and development, information technology, education and health, and leisure and hospitality) experienced the smallest declines of 3.9 and 4.0 percentage points. It should be noted, however, that in the case of the finance, real estate, and insurance sector, the 2010 to 2014 period average masks a strong decline in recent years. The startup rate in this category fell 4 percentage points during this period and as a result declined by a cumulative 7.5 percentage points from 1980 to 2014 — the second-largest decline after construction.

In light of the research looking at firm entry and exit, one explanation for the sizeable decline in new entry in construction and agriculture would be the increased role of larger, multi-establishment firms. As argued by Hathaway and Litan, greater business consolidation would inhibit new firm entry and in both industries larger firms have become more prominent, although there remain a sizeable number of smaller firms in both industries. Subsidies — which are sizeable in the agriculture sector — would also depress new entry as well. Subsidies to incumbents encourage the survival and expansion of these firms at the expense of potential new firms with higher rates of innovation and productivity. The subsidized incumbent firms utilize labor and funding that otherwise would be available to new firms. The relatively smaller decline in services would perhaps be not unexpected as increased innovation due to greater adoption of information technology, smaller-sized firms (startup costs), and less business consolidation would foster greater firm entry.

Slowdown in the Fifth District

The Fifth District has experienced trends in business dynamics and startup activity similar to those of the nation. (See chart below.) The new firm formation rate for the Fifth District was only 0.4 percentage point lower than that of the nation in the 1980s and 1990s and 0.6 and 0.8 percentage point lower in the 2000s and 2010-2014, respectively. Among Fifth District jurisdictions, North Carolina, Virginia, and South Carolina have had the strongest startup rates, followed by Maryland and then West Virginia and the District of Columbia. The startup rates for North and South Carolina and Virginia have been fairly close since 1980, with the period averages usually within a few tenths of a percentage point of one another. The District of Columbia has historically had the lowest startup rate until 2010-2014 when the West Virginia rate dropped a full 2 percentage points from the 2000s to a low of 5.4 percent.

Accounting for the differences, as the research literature suggests, is challenging. But the findings of past research, if applied to the Fifth District, may suggest some partial explanations. North and South Carolina have been the two fastest-growing jurisdictions within the Fifth District while West Virginia and the District of Columbia have been the slowest. Virginia has had relatively strong population growth, as well, particularly in the northern part of the state. As discussed by Hathaway and Litan, population growth differentials would explain some of the variation in entry rates. Sutaria and Hicks argue that average firm size is related to new firm formation as large firms may find it more efficient to outsource some production. The experience of South Carolina is in line with this view; the state has seen an increase in large manufacturing firms, and a sizeable supplier base has been built to service these firms.

Finally, Acemoglu and his co-authors note the negative impact of subsidies and policies that favor incumbent firms as they create inefficiencies in the allocation of resources for research and development. The federal government has a large presence in the northern half of the district with a large number of federal institutions and facilities in Maryland, the District of Columbia, and Virginia. All three receive a large amount of federal contract spending. The extent to which this funding is not being allocated to the most productive entities would impact the availability of resources for new firms looking to enter the market. This could partially explain the lower entry rates in Maryland and the District of Columbia. Additional likely factors are taxes, regulations, and other state policies.

The decline in startup activity and job creation has been fairly uniform across the Fifth District. From the 1980s to 2010-2014, the decrease in startup activity in the Fifth District was 4.9 percentage points (comparing period averages), slightly greater than the 4.4 percentage point drop for the United States. Most Fifth District jurisdictions experienced a decline close to the district average, with South Carolina having the greatest at 5.2 percentage points, although Maryland, Virginia, and West Virginia were only slightly smaller. (See chart below.) Startup activity declined the least in the District of Columbia, by 3.5 percentage points.

As would be expected, the decline in startup activity was reflected in job creation. The percentage of employment created by new firms in the Fifth District fell from 3.3 percent in the 1980s, just slightly less than the U.S. rate of 3.6 percent, to 1.8 percent in 2010-2014. Although there was a moderate upward trend in the absolute number of jobs created by new firms from the 1980s through the mid- 2000s (from 245,000 in the 1980s to 275,000 in the 2000s and peaking at 322,000 in 2006), the increase did not match the growth in overall employment, so the job creation rate by startups slowed each decade before dropping after the Great Recession (to an average of 203,000 in 2010-2014).

There was notable variation in the decline in the new firm job creation rate across the Fifth District. From the 1980s to 2010-2014, the number of new jobs created declined by 17 percent — a 1.5 percentage point decline in the new firm job creation rate. West Virginia, the District of Columbia, and Maryland experienced larger decreases of 37, 34, and 27 percent, respectively, while North Carolina had the smallest change, 4.4 percent, or just a 1.1 percentage point decline in the new firm job creation rate.

Conclusion

Over the last several decades, the rate which jobs are created and destroyed has diminished and fewer new firms are created each year. This slowing in business dynamics is taking place in the Fifth District and across all industry sectors. Research has highlighted the recent trends and has offered some insights into factors that may be impacting firm entry and exit, entrepreneurship, and business dynamics more broadly, but there has yet to be a definitive accounting of the current trends. The Great Recession accentuated the slowdown and new startups and job creation from new firms remain well below pre-recession levels.

Subscribe to Econ Focus

Receive an email notification when Econ Focus is posted online.

Subscribe to Econ Focus

By submitting this form you agree to the Bank's Terms & Conditions and Privacy Notice.

Phone Icon Contact Us

David A. Price (804) 697-8018