Inflation Expectations: Separating the Signal from the Noise
Economic Brief
October 2021, No. 21-33
Inflation expectations are measured in a variety of ways. In this Economic Brief, Richmond Fed economists compare survey-based forecasts with forecasts based on a signal extraction model. We find that, since 1980, survey forecasts have been modestly higher on average than the forecasts derived from this statistical model. Moreover, the survey forecasts have sometimes reacted less quickly than model-based forecasts to changes in actual inflation.
The Fed devotes significant effort toward understanding inflation, which is no easy endeavor. Much like peeling an onion, each layer of analysis seems to lead to yet another layer with its own idiosyncrasies.
One layer is that different price indexes produce different readings of inflation, so it's important to pay attention to multiple indexes. For example, one of the Fed's preferred measures is the personal consumption expenditure (PCE) price deflator, while the Fed also closely monitors the more publicized consumer price index (CPI).
Another layer is the challenge of trying to differentiate inflation's transitory and persistent elements. Indexes account for this issue by having several versions, including ones that exclude consumption goods with highly volatile prices. The core CPE index and core CPI measures — which exclude food and energy prices — are prime examples.
Yet another layer involves forecasts of future inflation. Here, economists draw inferences from surveys of inflation expectations (and there are many). Economists also use "signal extraction" techniques to make inflation forecasts.
This Economic Brief discusses signal extraction and how it relates to various notions of inflation, including underlying inflation, trend inflation, inflation expectations and inflation forecasts. This essay also illustrates how various measures of expected inflation — including surveys of expectations and statistically derived forecasts — have fared against each other and where they might be heading.
What Is Signal Extraction?
Any time a new observation about inflation arrives, two questions arise:
- To what extent does the observation reflect something fundamental about inflation that is likely to persist?
- To what extent does it reflect noise in the sense of being driven by transitory forces?
This is where signal extraction comes in, which is a statistical technique for separating the "signal" (or the meaningful information) from the "noise" (or the random information that isn't meaningful). The simplest signal extraction framework for inflation is one that models inflation as being equal to the sum of two components — one persistent and the other transitory:
- The persistent component is modelled as moving according to a "random walk," so its value today equals its value yesterday plus a random number.
- The transitory component is simply modelled as random number.
This framework can be used to estimate expected inflation, which is equal to both the underlying and trend rates of inflation in the context of the random walk model. In particular, the "signal-to-noise" ratio — or the amount of meaningful information versus the amount of random information — takes on significant importance. Higher signal-to-noise ratios allow statisticians to more accurately estimate underlying inflation.1
Comparing Forecasts
It is interesting to compare the inflation forecasts produced by signal extraction techniques with other measures of inflation expectations and forecasts. For our model, we use core CPI and core PCE inflation measures to exclude the transitory volatility associated with food and energy prices. The inflation data that we use to estimate the model start in the first quarters of 1947 and 1959 for the core CPI and core PCE series, respectively, and run through the first quarter of 2021.
Figures 1a and 1b show the statistical estimates of expected inflation from the signal extraction model using core PCE and core CPI inflation, respectively.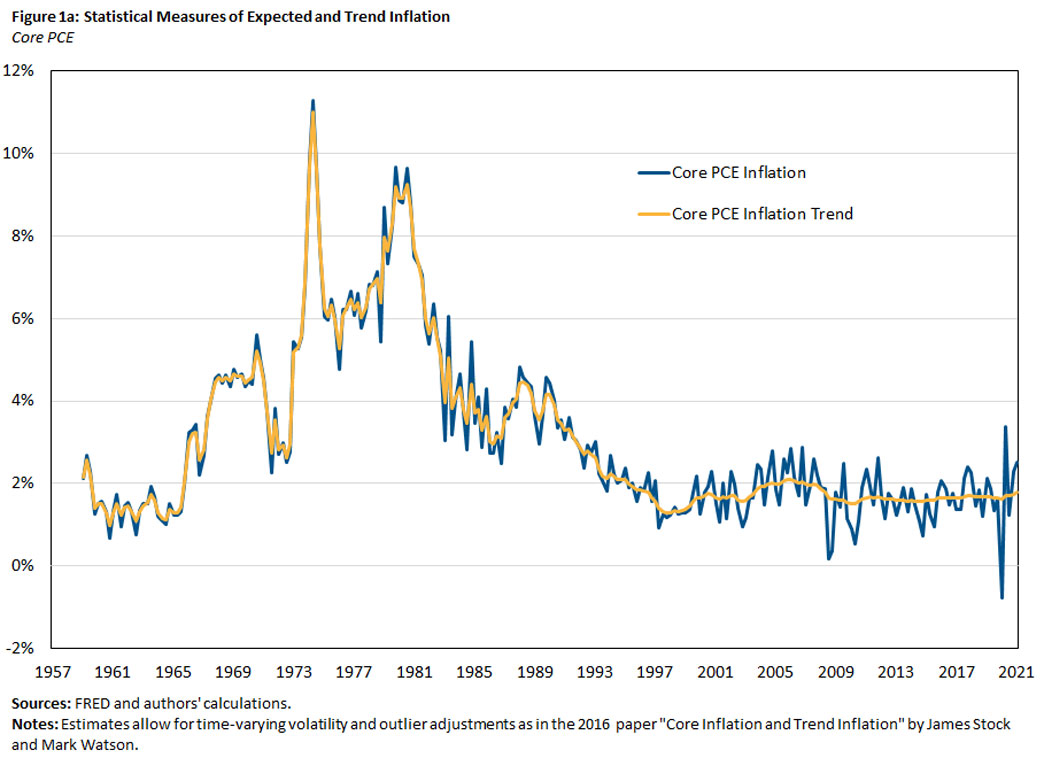
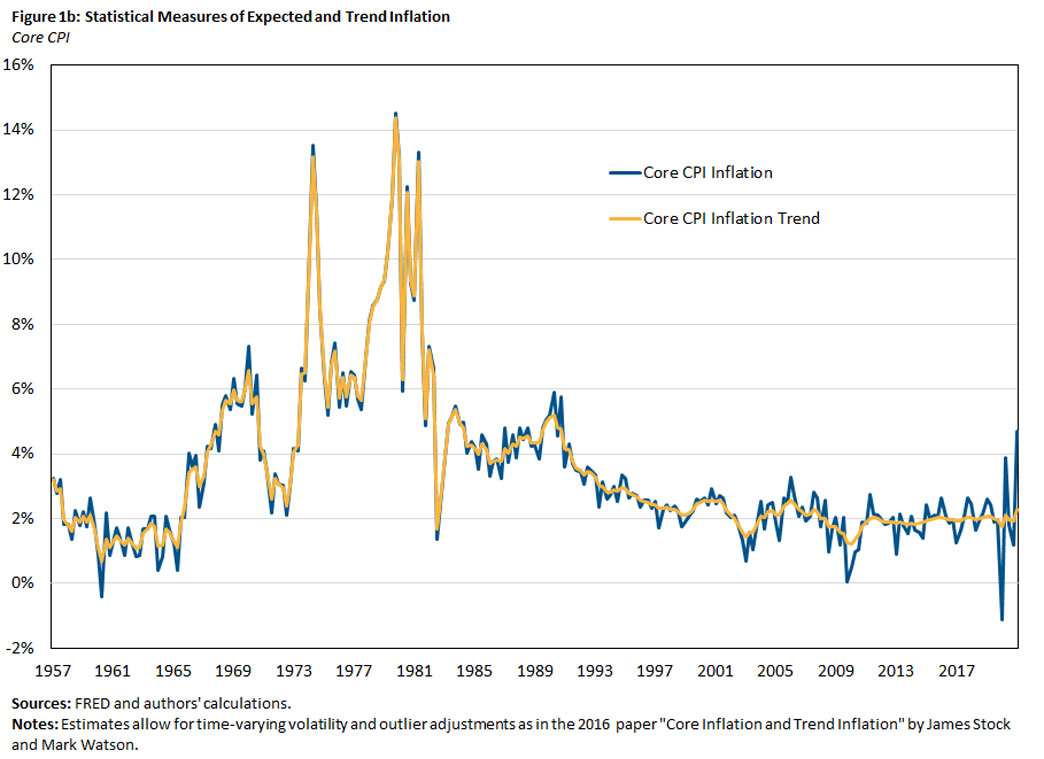
From around the 1990s to today, these estimates are generally stable and show little variation. The model's inflation forecasts during this period do not appear to respond substantially to actual inflation's relatively modest upticks and downticks relative to trend. These ups and downs are generally treated as "noise" by the statistical model during this period.
However, the story was much different from the 1960s through the 1980s. Actual inflation trended upward substantially, and the model's inflation forecasts were highly responsive to the upticks and downticks of actual inflation.
Signal Extraction Model and Inflation Expectations
Next, we compare the model's forecasts of inflation to the following measures of medium- and long-term inflation expectations:
- The expected inflation rate over the next five years from the University of Michigan Survey of Consumers
- The median expectations of both CPI and PCE inflation over the next 10 years from the Survey of Professional Forecasters (SPF)
- The average CPI inflation forecast over the next 10 years from the Livingston Survey of Economists' Forecasts
- The expected inflation rate over the next 10 years implied by market yields for Treasury notes and Treasury inflation-protected securities, based on the 2018 paper "Tips from TIPS: The Informational Content of Treasury Inflation-Protected Security Prices"
Figure 2 shows how the various measures of expected inflation compare to each other.
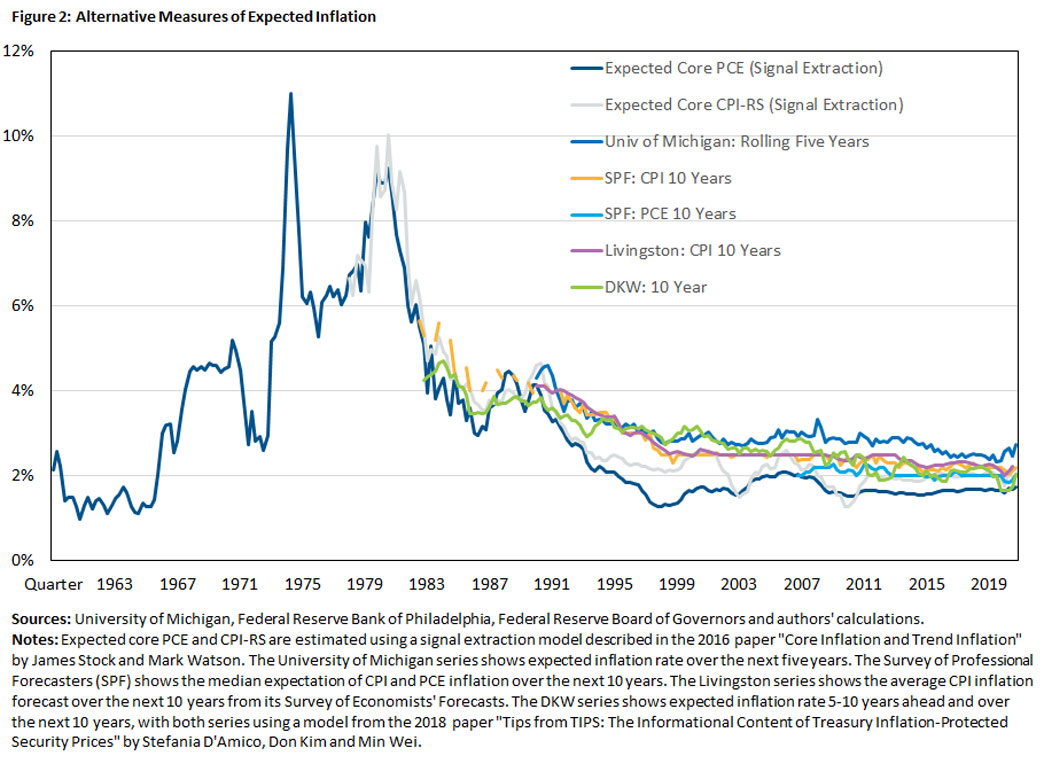
Unfortunately, most series that are survey-based or implied by financial market data are not available prior to 1980. This means that we cannot learn about the behavior of expected inflation during the late 1960s and 1970s without using statistical methods.
It also means that what we do learn about the differences between statistical and other measures of expected inflation is based on an era of declining and then relatively stable inflation. This data limitation may create a false sense of "sameness" among the different series.
The most significant difference between the statistical measures of expected inflation and those that arise by other means is essentially a level shift. For example, for most of the period since 1980, our model-based forecasts of PCE inflation are about 0.5 percentage points lower on average than the non-statistically based series.
Interestingly, the persistence properties of the series (as measured by serial correlations) appear to be remarkably similar. If anything, the statistical-based forecasts tend to react a little more to the data. For example, the run-up in forecast PCE inflation between 1998 and 2008 was mostly ignored by the survey-based series.
Additional Insights
Further analysis yields additional insights into the differences among the measures. The longest period of overlap (1980 to present) comes from our model-based CPI forecasts and the CPI forecasts provided by the SPF. Both the signal from the statistical model and the (median) forecast from the survey decline at remarkably similar rates over the period. In a way, this is perhaps not all that surprising because both series likely draw heavily from past inflation data (although it should be noted that statistical tools available to professional forecasters have changed over time).
More generally, the expected inflation series we examined were surprisingly similar in terms of their time-series properties (as measured by the series' variances and serial correlations). The biggest exception to this pattern occurred in the period 1998-2008, when our statistical-based estimates were somewhat more variable than the forecasts based on surveys and financial-market data. In addition, our statistical-based forecast of PCE inflation declines somewhat more aggressively than survey-based measures in the 1980s, then stabilizes below those measures.
It is also interesting to examine the distribution of deviations between the forecasts produced by our model and those derived from surveys. As previously mentioned, our model-based estimates of expected inflation tend to be 0.5 percentage points below their survey counterparts with no obvious skewness either on the upside or downside. When this difference is removed, the variation in those deviations is generally small. One exception is the early 1980s, when the statistical measure of expected inflation was declining somewhat faster than its survey-based counterpart.
Policy Changes and Impact on Inflation Forecasting
The properties of inflation forecasts may change with the Fed's new monetary policy framework, which was announced in August 2020. This new framework has the Fed targeting 2 percent inflation over the longer run, rather than trying to get to 2 percent and hold steady. An implication is that, for example, the Fed may target inflation of higher than 2 percent if it has been below that mark for an extended period, thus bringing the average to 2 percent over a longer period.
Such a shift may cause inflation forecasts to shift as well, which we've seen with prior announcements. Following the Fed's January 2012 announcement of an explicit 2 percent inflation target, for example, the variability of our model-based inflation forecasts declined.
Changes in fiscal policy may also matter, particularly if we are heading toward a new fiscal regime. If we are indeed in such a new regime and it eventually contributes to persistently higher inflation, the Stock and Watson framework would start translating a portion of these readings into higher inflation forecasts. In turn, this would likely be reflected in higher survey readings of expected inflation.
Current Inflation Forecasts
So far, such changes or potential changes don't seem to have significantly impacted inflation forecasts. Forecasts from surveys appear to have been remarkably stable through the first quarter of 2021, although perhaps edging a little higher as of late. As of the first quarter of 2021, all survey-based measures of expected inflation as well as those implied by financial market variables are around or above 2.0 percent. That is not a change relative to the recent past.
However, the most recent year-over-year reading of CPI inflation (4.6 percent in April) would cause the statistical measure of expected inflation to increase to 2.25 percent if sustained through the entire second quarter of 2021. This would be its highest reading since the fourth quarter of 2018.
Expected PCE inflation has hovered somewhat lower at around 1.7 percent on average for most of this period. Taking the last monthly reading on PCE inflation as the reading for the entire second quarter of 2021, the statistical-based measure of expected inflation now stands at 2.0 percent, its highest reading since the fourth quarter of 2018.
Of course, these are merely forecasts. Time will tell whether some of the aforementioned policy changes will end up having a more significant impact on inflation than is currently being projected. We should have better clarity on such impacts to inflation and inflation expectations a year from now.
John Mullin is a writer, John O'Trakoun is a senior policy economist, and Pierre-Daniel G. Sarte is a senior adviser in the Research Department at the Federal Reserve Bank of Richmond.
1
More sophisticated versions of this framework exist, such as a model by James Stock and Mark Watson where the volatilities of both the noise and the signal are modeled as time varying and where there are occasional spikes in inflation unrelated to "fundamental" inflation. This is covered in their 2016 paper "Core Inflation and Trend Inflation."
This article may be photocopied or reprinted in its entirety. Please credit the authors, source, and the Federal Reserve Bank of Richmond and include the italicized statement below.
Views expressed in this article are those of the authors and not necessarily those of the Federal Reserve Bank of Richmond or the Federal Reserve System.
Subscribe to Economic Brief
Receive a notification when Economic Brief is posted online.
Contact Us