The Borrower of Last Resort: What Explains the Rise of ON RRP Facility Usage?
This article explains why the Fed has been borrowing more than $1.4 trillion from its borrower-of-last-resort facility: the Overnight Reverse Repo. We compare the roles of five channels potentially driving Fed borrowing (such as saving glut, quantitative easing, regulation, etc.) and find that one channel — the Treasury General Account drawdown — is associated with most of the current usage. We also find this channel's impact could be partially moderated if the Fed tapers quantitative easing accordingly.
The Federal Reserve's Overnight Reverse Repo (ON RRP) facility provides a floor to implement its interest rate target (i.e., the federal funds rate) in abundant reserve environments. (For an explanation of repo markets, see the 2020 article "The Repo Market Is Changing (and What Is a Repo, Anyway?)")
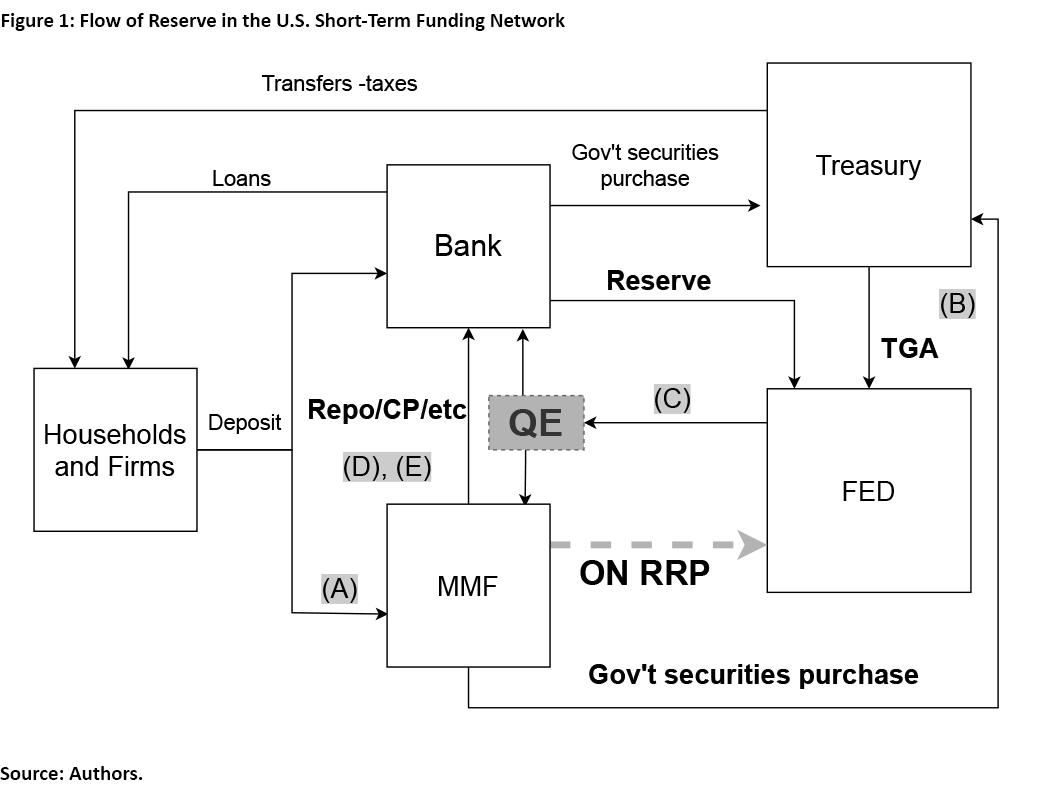
The idea is that the ON RRP facility gives participants in the short-term funding market the risk-free overnight option of lending to the Fed at the guaranteed ON RRP rate. Thus, other lending rates — like the fed funds rate — will be above the ON RRP rate.1 Figure 1 illustrates how the short-term funding network functions in the U.S.
In the original design, ON RRP was a backstop, as market participants should lend to banks or others (via federal funds, repo, wholesale deposits, commercial papers, etc.) before lending to the Fed.2 This was the case during the early stage of the pandemic: The daily usage of ON RRP averaged $8.7 billion from March 2020 to March 2021.
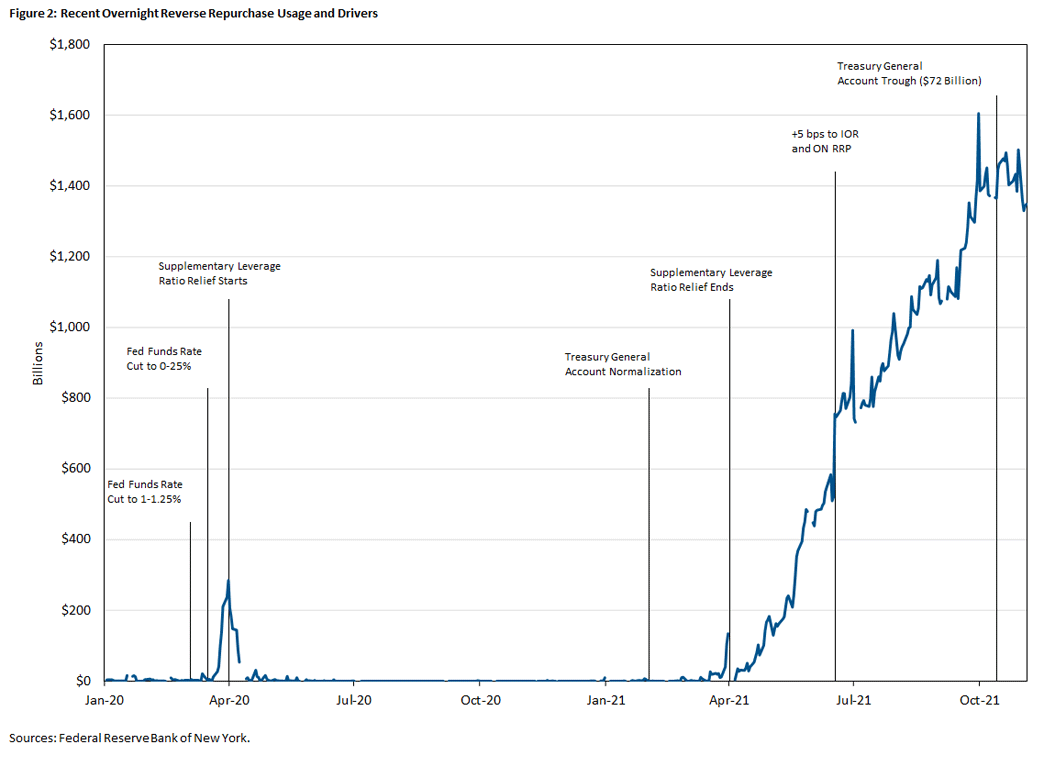
However, ON RRP usage steadily increased after March 2021 and reached an unprecedented $1.6 trillion in September 2021. This hints at an excess supply of nonbank savings that is not intermediated by banks or absorbed by Treasuries, which has ultimately flowed into the ON RRP facility. The Fed becoming the borrower-of-last-resort has prompted concerns about how the U.S. banking system is functioning during the pandemic. Concerns include, for example, bank capital regulation being too tight or the Fed's actions creating asset dislocation.3
In what follows, we discuss and evaluate five channels and whether they explain ON RRP usage during the pandemic as well as before. If they don't, the increase in ON RRP usage may be indicative of some malfunction in the short-term funding market. The five channels (illustrated in Figure 1) are:
- The escalated supply of funds due to the saving glut in the shadow banking sector
- The reduction in the supply of Treasury bills (due to TGA drawdown) that used to absorb nonbank savings
- The dislocation and uptake of banks' balance sheet capacity due to quantitative easing
- The reduction in banks' ability to expand balance sheets due to capital regulation
- The reduction in the profit margin of banks' intermediation due to the interest rate policy
Figure 2 shows the increase in ON RRP usage along with the timing of these channels.
(A) Saving Glut in the Shadow Banking Sector
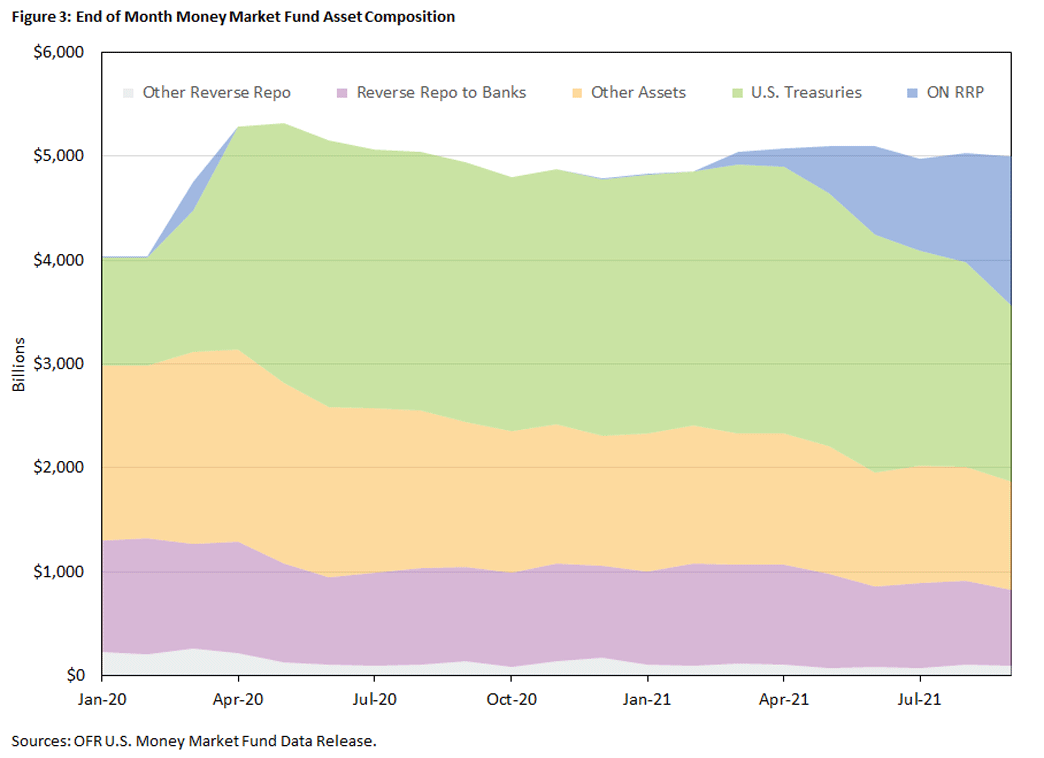
Money market funds (MMFs) are basically like interest-bearing checking accounts but are provided by nonbanks. (That's why they are referred to as part of the shadow banking sector.) They have experienced heightened demand since the beginning of the pandemic, as their assets under management exploded by close to $1 trillion from March 2020 to September 2021 (see Figure 3), compared with a $1.6 trillion increase in ON RRP usage during the same period. Since March 2021, they have been responsible for an average of 91 percent of month-end ON RRP usage.
Part of this saving glut comes from banks who are directing additional deposits to MMFs.4 MMFs, in turn, are facing a challenge with investing these deposits due to an apparent shortage of short-term high-quality investments.5
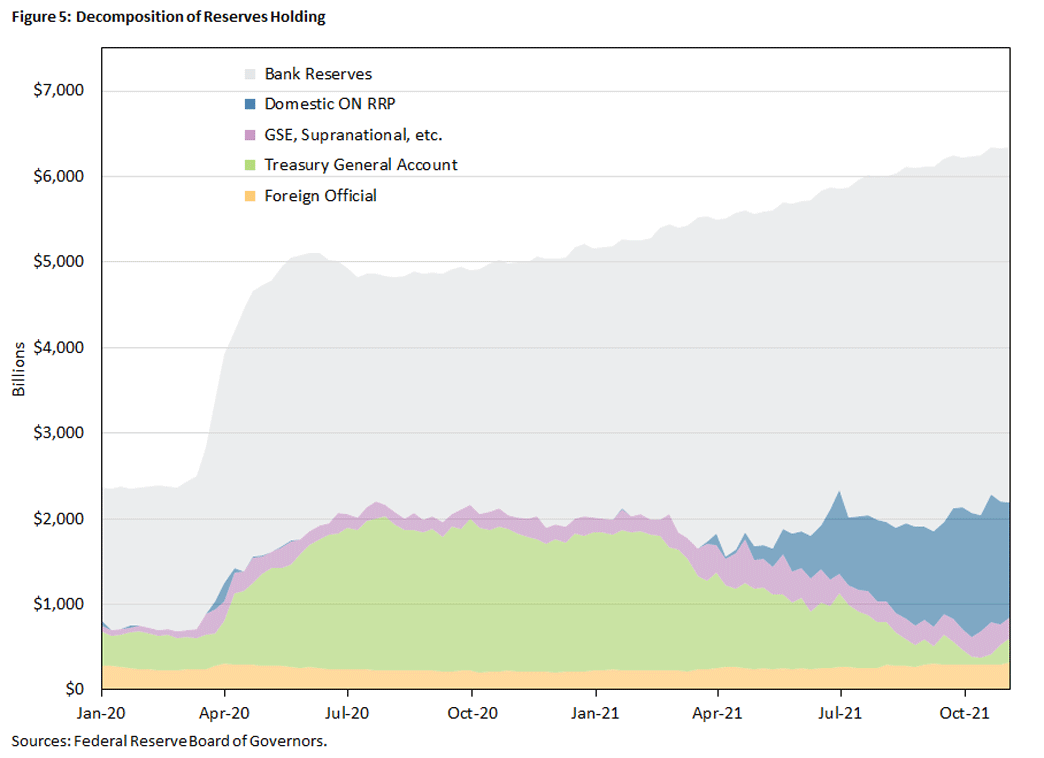
Similar to banks, MMFs are required to maintain liquidity buffers of short-term high-quality assets to handle unexpected fund outflows. MMF managers fulfill these requirements primarily by holding a mix of short-term government securities and by lending in the repo market, which can be quickly converted into cash.6 If the growth in the demand for MMFs outstrips the supply of short-term government securities (reflected in the green area in Figure 3) and the demand for borrowing (the purple and orange areas), MMFs may substitute with the ON RRP facility (blue).
(B) Treasuries
The reduction in T-bill supply is another potential reason behind the increasing demand for ON RRP.7 In particular, the Treasury has been draining reserve balances in the Treasury General Account (TGA), which is the reserve account maintained by the Treasury to make and receive payments in the banking system. The Treasury has been reducing this account with the Fed by issuing fewer T-bills, effectively releasing these reserves into the banking system.
Pre-COVID, the TGA maintained a moderate balance that averaged $290 billion in 2019 and varied with financial conditions and government spending. However, due to uncertainty around the COVID-19 pandemic and the magnitude of the fiscal response, the Treasury increased the TGA balance from approximately $380 billion in mid-March 2020 to an unprecedented $1.6 trillion by June 2020. This rapid increase was primarily facilitated by an expansion in T-bills outstanding from $2.56 trillion in March 2020 to over $5 trillion in June 2020.
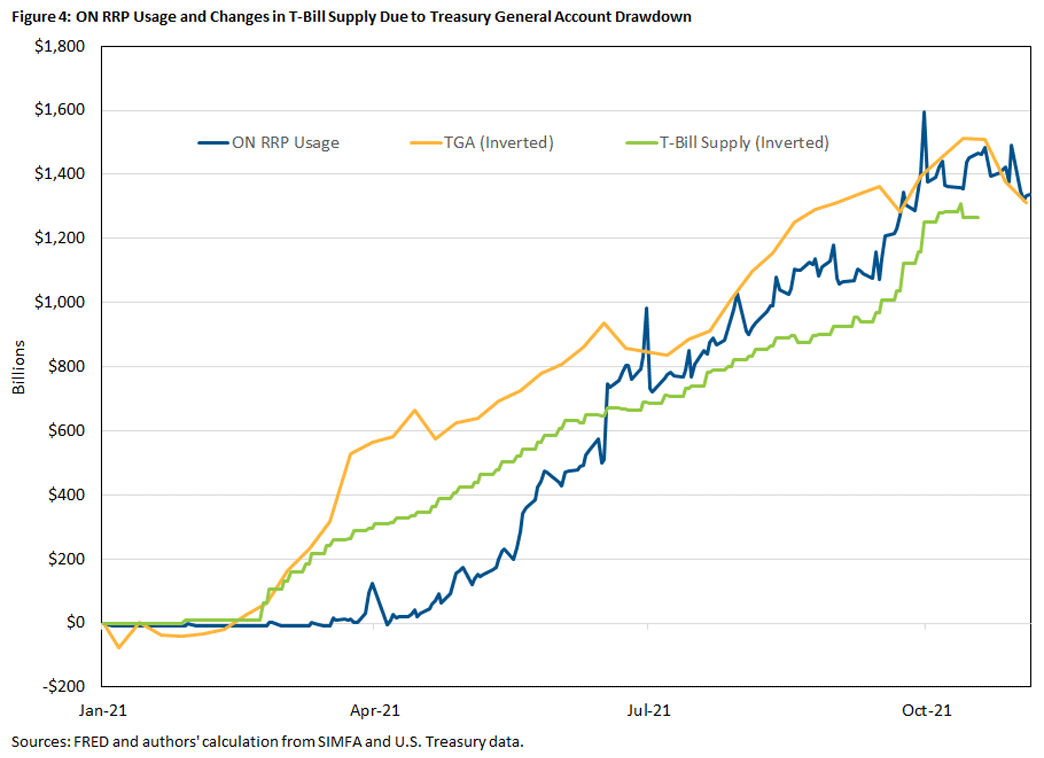
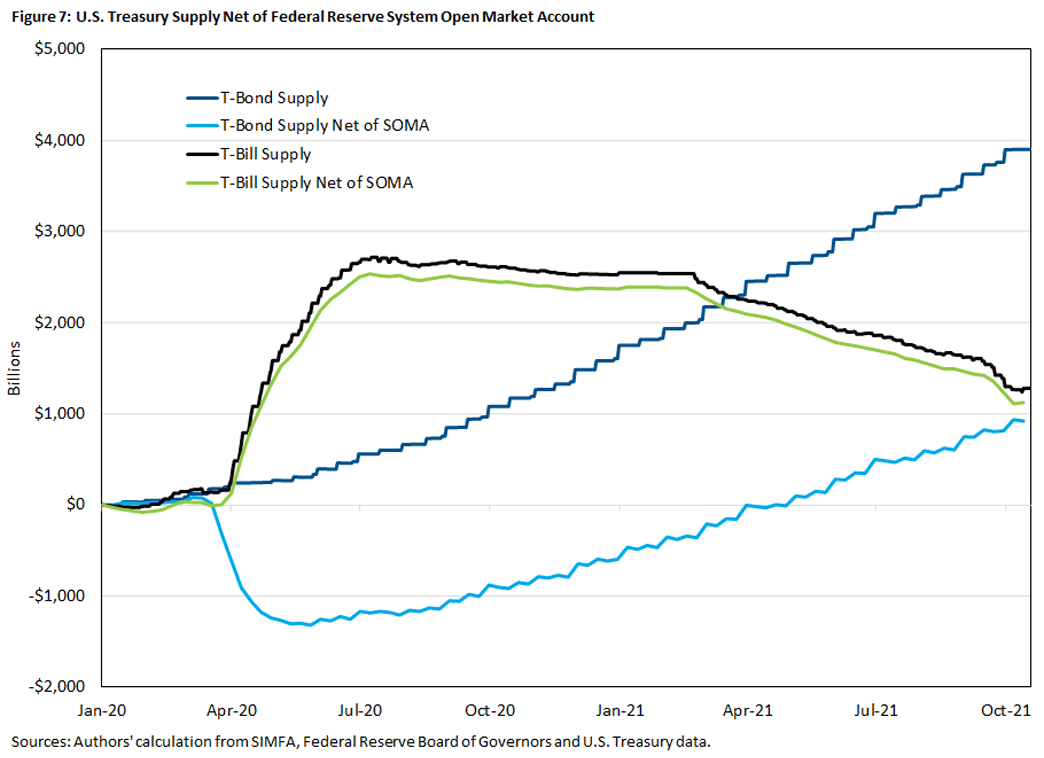
The Treasury maintained the elevated TGA balance and T-bill supply through February 2021 before normalizing via a reduction in T-bill supply.8 TGA normalization decreased the TGA from over $1.6 trillion in February 2021 to less than $100 billion by October 2021, primarily through T-bill supply falling from $5 trillion to $3.7 trillion. This effectively reduced the supply of risk-free short-term assets by $1.3 trillion and increased the supply of tradeable reserves by $1.5 trillion right as ON RRP usage picked up, illustrated in Figure 4.
(C) Reserves, Quantitative Easing and Dislocation
Since March 2020, the Fed has injected close to $4 trillion of reserves (as of Nov. 3) into the economy via its quantitative easing program and lending facilities, as seen in Figure 5.
For quantitative easing, the Fed creates reserves to buy government securities. In general, quantitative easing is not just a swap of two liquid safe assets (reserves versus government securities), and it may not be balance-sheet neutral. In particular, these government securities are not necessarily acquired from banks in the open market ultimately.
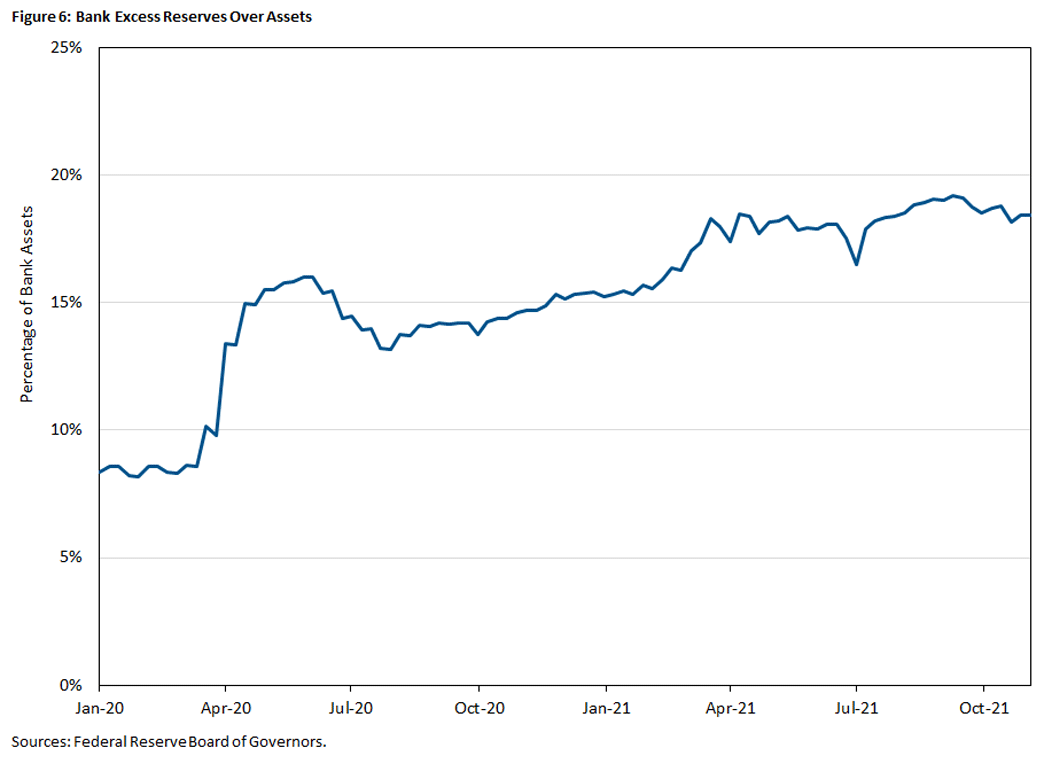
But in the equilibrium, only banks (and GSEs) can hold these newly injected reserves by expanding their balance sheets via various types of borrowing like repos, wholesale deposits or commercial papers. As a result, the overall balance sheets of banks expand. Indeed, total bank assets increased 25 percent from Feb. 26, 2020, to Nov. 3, 2021, and the share of excess reserve in bank assets doubled from 8.3 percent to 18.4 percent during the same period, as seen in Figure 6.9
Since banks face increasing marginal costs when expanding their balance sheets and diminishing marginal benefits from loading reserves, this limits banks incentives to absorb additional reserves via repo borrowing with MMFs. The lack of the demand for repo borrowing may in turn push MMFs into the ON RRP facility.10
Quantitative easing may also create a dislocation of safe assets and further urge MMFs to tap the ON RRP facility.11 Immediately before the pandemic, there was no noticeable trend in the relative supply of T-bills and T-bonds net of Fed holdings, illustrated by Figure 7. With the backdrop of the TGA drawdown since February 2021 which has tapered the supply of short-term T-bills for reserves, Fed asset purchases are exchanging long-term bonds for reserves.12 Given the different assets involved at different speeds, per Figure 7, it complicates the overall effect on ON RRP usage.
(D) Capital Regulation
Some commentators have connected the recent expiration in Supplementary Leverage Ratio (SLR) relief to the reduction in the banks' balance sheet capacity.13 The SLR requires the largest, systemically important banks to have capital equal to at least 5 percent of their assets plus select off-balance sheet exposures and requires other large banks to have capital equal to at least 3 percent of assets plus select off-balance sheet exposures.
Balance sheet constraints could have prevented banks from adding reserves and Treasuries on their balance sheet, according to the Financial Stability Board's report (PDF) on the disruptions to trading in U.S. Treasuries and other securities last March. The SLR relief policy — running from March 31, 2020, to March 31, 2021 — temporarily excluded reserves and Treasuries from the SLR calculation with the explicit purpose of mitigating these constraining effects of SLR on balance sheet growth.14
In theory, by excluding Treasuries and reserves from the SLR calculation, the exemption would enable SLR-constrained banks to temporarily increase their Treasury and reserve holdings. Indeed, the fact that the relief's expiration in March 2021 immediately preceded the recent increase in usage of ON RRP (as seen in Figure 2) suggests it as a compelling channel.
(E) Interest Rate Policy
Under the current environment, banks — not MMFs or GSEs (that is, Fannie Mae, Freddie Mac and Federal Home Loan Banks) — are eligible for interest on reserves (IOR), which is the interest the Fed pays on reserve balances. The IOR rate is always higher than the ON RRP rate.
Historically, this gave rise to an arbitrage trade in which MMFs and GSEs lend reserves to (mainly foreign) banks with the interest rate below IOR and above the ON RRP rate (after adjusting for counterparty risk, collateral benefits and balance sheet cost).15 Indeed, if repo rates are between the IOR and ON RRP rates, MMFs should lend reserves via repo and avoid using ON RRP. The spread between the IOR and ON RRP rates thus measures the joint benefit of the arbitrage trade. However, despite the potential for IOR arbitrage, banks are currently eschewing the growing level of sub-IOR reserves and even turning away some deposits, implying the current spread may not be sufficient to incentivize banks to expand their balance sheets any further.16
On the other hand, increased demand and recent decreases in the supply of short-term risk-free assets have combined to increase the price of T-bills and reverse repos in early to mid-2021, depressing short-term rates to near zero. These low levels of short-term rates proved problematic as certain MMFs experienced challenges covering their operating costs.17
In response, the Fed implemented a technical adjustment that increased the IOR 0 to 5 basis points and the ON RRP rate 10 to 15 basis points on June 16, 2021. This rate increase may also encourage higher MMF usage of the ON RRP facility (as seen in Figure 1) by supporting additional substitution from high-priced, low-yield T-bills to reverse repo.18
Estimating ON RRP Usage
To evaluate each channel, we gather data from different sources and devise a model to quantify these five channels under a unified framework. Below we summarize our method.
Data
We examine the five channels on ON RRP usage with two time series. Our baseline time series is the MMF-level usage of ON RRP leveraging data from the Office of Financial Research. Overall, there were 127 distinct MMFs that used the ON RRP facility during the sampling dates we used: January 2014 through September 2021. We check the robustness with the more-frequent time series of the aggregate ON RRP usage from New York Fed, which includes GSEs and others (amounting to the remaining 9 percent share of month-end ON RRP usage since March 2021).
We construct the controls with data from Investment Company Institute, the Board of Governors' H.4.1 "Factors Affecting Reserve Balances of Depository Institutions" and the Board's H.8 "Assets and Liabilities of Commercial Banks in the United States." The data of monetary policy and of the supply of various types of Treasuries are collected from FRED, SIMFA and the U.S. Treasury.
We extend the sampling period before March 2020 to look for general evidence of the effects of these channels rather than effects specific to the pandemic period. We also exclude the initial testing period of the ON RRP facility. This is why the data we use spans from January 2014 to September 2021.
The frequency of the MMF-level data of ON RRP usage is monthly and as of the last business day of each month. The sample size of our MMF-level panel data is 8,815. The frequency of the aggregate ON RRP usage data is weekly on each Wednesday, leading to a sample size of 405.
Model
Since ON RRP usage is subject to a zero lower bound, we use a Tobit model to estimate the cited channels with bank excess reserves, bank government and agency securities, net T-bill supply, net T-bond supply, government MMF assets, and prime MMF assets, all standardized by bank assets.19 We also include the IOR/ON RRP rate spread over the midpoint of IOR and ON RRP, a set of adjusted leverage ratio proxies for SLR and (as applicable) Treasury issuances, calendar indicators and fund fixed effects.20
For the panel regressions, we include each MMF's usage level over bank assets as the dependent variable. For the aggregate usage regressions, to limit noise arising from regular GSE and primary dealer facility usage, we construct the dependent variable by subtracting $30 billion from ON RRP usage levels, taking the maximum with 0 and then dividing by bank assets.
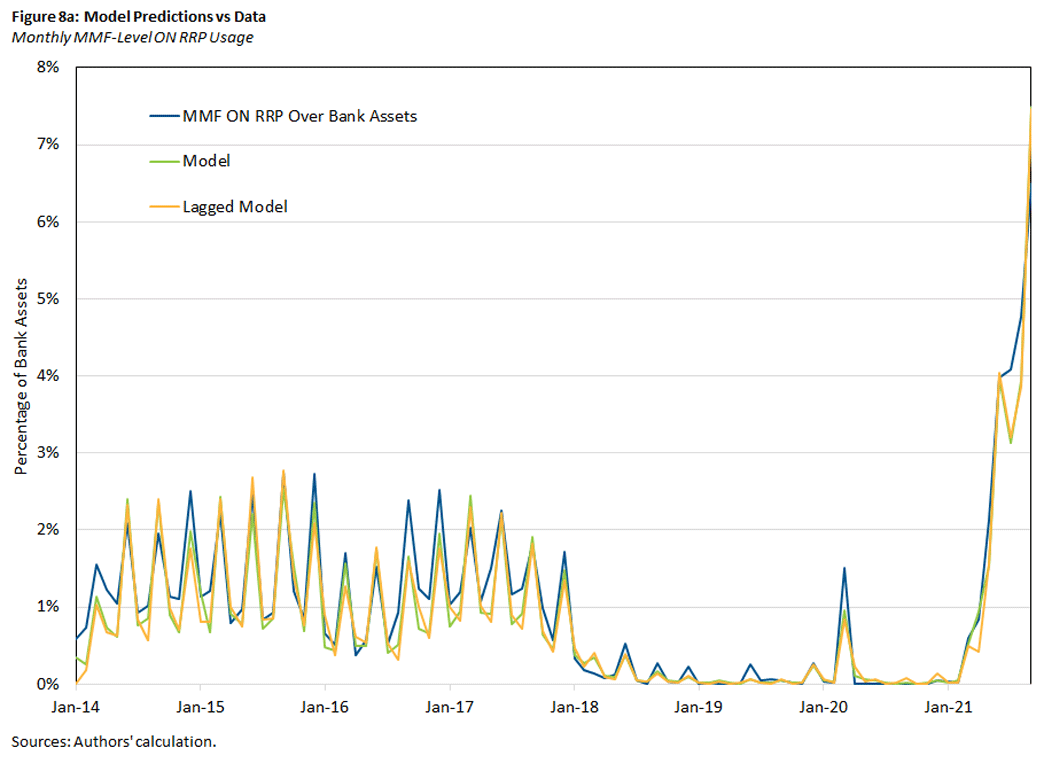
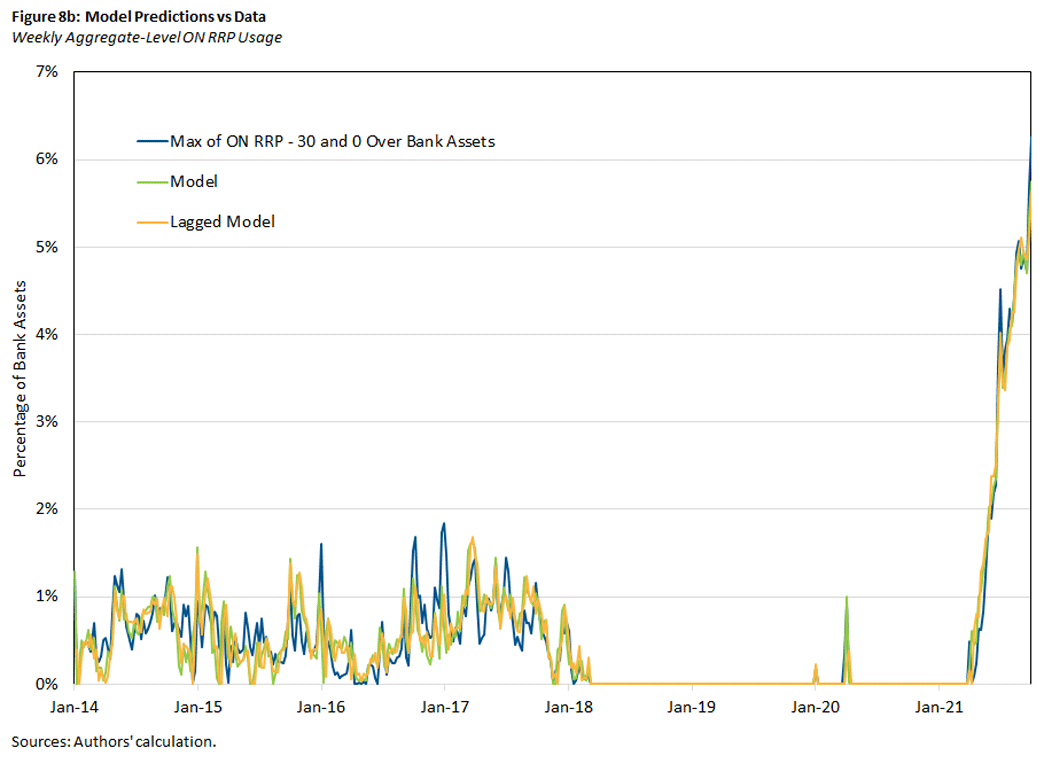
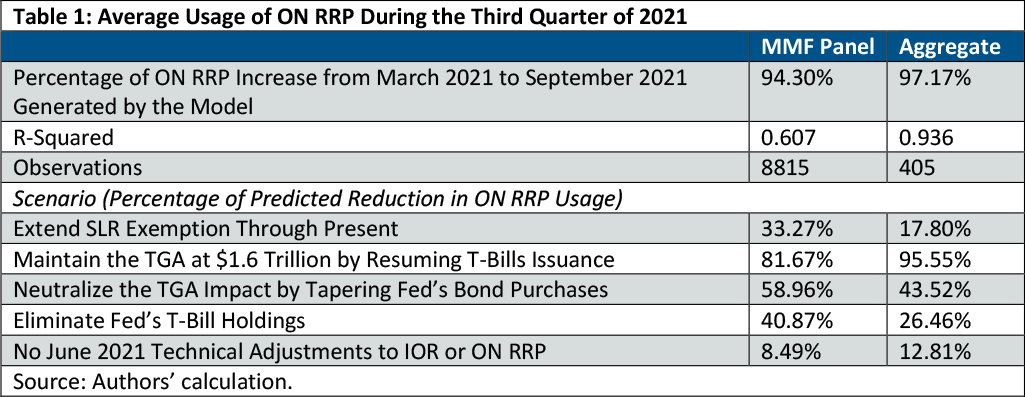
Figures 8a and 8b illustrate the fitness of our four models from January 2014 to September 2021. Overall, they show that the model clearly tracks usage throughout the period, including periods before the pandemic and the recent increase. The R2 of the panel regression is 0.607.
Notice that the model fits 127 MMFs at the monthly frequency since January 2014. Aggregating the fund-level prediction, the panel regression actually matches the aggregate ON RRP usage well, as shown in Figure 8a. Indeed, the R2 of the aggregate regression is 0.936, fitting the weekly observation since January 2014. For robustness, we also run the MMF panel regression and the aggregate regression with the lagged explanatory variables, with similar results.
Scenarios
Using the regression results, we further estimate the impacts of each channel on average ON RRP usage over the third quarter of 2020, as reported in Table 1. First, all the models can generate more than 90 percent of observed increase in ON RRP usage since April 2021, as seen in the first row of Table 1.
We find that extending the SLR relief is associated with a reduction in usage of 33.3 percent on the fund level. For the interest rate policy, reverting the June 2021 technical adjustment is associated with an approximate 8.5 percent decrease in ON RRP usage on the fund level.
The TGA drawdown has the largest effect: Reverting it would reduce the third-quarter average ON RRP usage by 95.6 percent in aggregate and 81.7 percent on the fund level, according to our model. The effect is large because it involves two channels:
- It increases reserves in circulation.
- It decreases T-bill supply.
If the Fed offsets the TGA's release of reserves by tapering its T-bond purchases accordingly, ON RRP usage would be mitigated by 43.5 percent in aggregate. Even though the taper could also revert some dislocation of T-bonds and reserves, the TGA's impact cannot be completely offset because the Fed cannot revert the reduction in T-bill supply that the market desires. This highlights how recent usage levels are notably more sensitive to net T-bill supply than net T-bond supply. The lack of circulating T-bills also cannot be completely eliminated by selling off current Fed's holding of T-bills, as it would only reduce fund-level ON RRP usage by 26.5 percent. This is because the Fed's holdings of T-bills is small ($366 million) relative to the Treasury's reduction ($1.3 trillion).
Concluding Remarks
While unprecedented, ON RRP facility usage levels are readily accounted for by our proposed channels, both before and during the pandemic. The short-term funding market during the pandemic has been functioning the same way as before, albeit in different magnitudes. In particular, the vacuum created by the Treasury's subdued borrowing has had the most pronounced effect. The rise of ON RRP epitomizes the new role of the Fed as the borrower of last resort in the short-term funding market.
Kyler Kirk is a research associate and Russell Wong is a senior economist in the Research Department at the Federal Reserve Bank of Richmond.
ON RRP eligible counterparties include banks, money market funds, primary dealers and government sponsored enterprises. For the Fed's latest facilities in the repo markets on top of ON RRP, see the 2021 article "The Fed's Evolving Involvement in the Repo Markets."
For the design principles of ON RRP, see the 2015 paper "Overnight RRP Operations as a Monetary Policy Tool: Some Design Considerations."
The recent article "Reddit's Latest Money-Making Obsession Is an Obscure Fed Facility" provides an example: "It's not risky to put your money into ON RRP. The problem is they have nowhere else to put it in. These high scores show us that something is wrong in the market, not the ON RRP." The article also provides other examples of concern and speculation triggered by the ON RRP usage in social media.
For example, see the recent article "Cash-Rich U.S. Banks Move to Reduce Corporate Deposits."
For example, see the recent articles "Debt-Limit Deal May Fail to Spur Bill-Supply Surge Market Craves" and "Derby's Take: From Already High Levels, More Money Could Hit Fed Reverse Repos."
See the 2021 article "How Do Prime MMFs Manage Their Liquidity Buffers?"
For commentary on T-bill shortages and ON RRP, see the recent articles "U.S. Fed's Reverse Repo Volume Surges to Record Half a Trillion Dollars" and "Fed Should Prepare for Autumn Financial Plumbing Problem."
For normalization announcements, see "Quarterly Refunding Statement of Deputy Assistant Secretary for Federal Finance Brian Smith" and "Treasury Announces Marketable Borrowing Estimates."
Excess reserve is the reserve balances beyond reserve requirement. On top of quantitative easing, part of the increase in the holding of excess reserve comes from the elimination of reserve requirement on March 26, 2020.
For the evidence of substitution between ON RRP and repo, see the 2018 paper "Monetary Policy Implementation and Financial Vulnerability: Evidence from the Overnight Reverse Repurchase Facility."
For example, see Michael Derby's question (PDF) during the post-FOMC press conference on June 16, 2021.
Current Fed asset purchases do not include T-bills. System Open Market Account holdings of T-bills have remained constant at March 2020 levels throughout the course of the pandemic.
For example, see the recent articles "Analysis: Fed Move Eases Pressure on Money Funds, but More May Be Needed" and "Powell Stays Silent on Extending Fed's Bank Capital Relief."
The exclusion was announced on April 1, 2020, to ease balance sheet pressures caused by significant deposit growth and by increases in Treasury holdings among large banking institutions. The exemption to the SLR — which generally applies to financial institutions with more than $250 billion in total consolidated assets — temporarily decreased holding company Tier 1 capital requirements by approximately 2 percent in aggregate.
Balance sheet costs — including regulatory constraints, transaction costs and Federal Deposit Insurance Corp. assessment fees — reduce realized gains from arbitrage trades leading to a bank reservation rate below IOR.
For examples of comments from banks, see the recent article "Cash Unwanted by Large U.S. Banks Piling Up at Federal Reserve Reverse Repo Facility."
For example, see Lorie Logan's Oct. 14, 2021, speech "Monetary Policy Implementation: Adapting to a New Environment."
For example, see the recent article "Fed Reserve Repos Surge to Record of $756 Billion After Rate Tweak."
For a related analysis on ON RRP participation and its impact on the repo rate and Fed funds rate, see the 2016 paper "Modelling Overnight RRP Participation."
To capture how the IOR/ON RRP spread may affect bank arbitrage decisions and how marginally higher returns may be more relevant in a low interest rate environment, we use the ratio of the IOR/ON RRP rate spread over the IOR/ON RRP midpoint. We only observe SLR at the quarterly frequency, so we define a SLR proxy as H.8 bank assets minus liabilities over assets during the nonexemption period and over assets minus Treasuries and reserves for the exemption period. This provides a high frequency proxy for aggregate bank SLR. We construct proxies for the total, large, small and foreign commercial bank H.8 subsets and include the total and three differences of large, small and foreign commercial with total in our regressions. We include indicator variables for end of month, end of quarter and GSE principal and interest (P&I) payment dates as applicable. We control for month-end and quarter-end because banks tend to reduce their leverage and exposure around month-end and quarter-end regulatory reporting dates, decreasing the demand for reserves and contributing to increased ON RRP usage. We control for P&I dates because Fannie Mae MBS P&I payments on the 25th or following business day and Freddie Mac MBS P&I payments on the 15th or following business day contribute to reduced reserve lending the day before and day of.
This article may be photocopied or reprinted in its entirety. Please credit the authors, source, and the Federal Reserve Bank of Richmond and include the italicized statement below.
Views expressed in this article are those of the authors and not necessarily those of the Federal Reserve Bank of Richmond or the Federal Reserve System.
Receive a notification when Economic Brief is posted online.


