Projecting the Evolution of the Fed's Balance Sheet
Economic Brief
April 2022, No. 22-15
As the Fed embarks on balance sheet policy normalization, there is natural interest in understanding the projected evolution of the Fed's asset portfolio over the next three to four years. Several important assumptions are needed to be able to predict the path of the balance sheet. Based exclusively on public information, we use alternative sets of plausible assumptions to construct and analyze several different scenarios for the future of this critical policy-relevant lever.
Part of the Fed's response to the pandemic crisis has involved purchasing large amounts of Treasuries, agency debt and mortgage-backed securities (MBSs). As a result, the System Open Market Account (SOMA) portfolio reached record levels. At the end of March, the Fed owned $5.68 trillion in Treasury and agency securities and $2.73 trillion of MBSs.1 But how will the Fed's balance sheet evolve as the normalization process gets underway?
The minutes for the March 2022 meeting of the Federal Open Market Committee (FOMC) make clear that the Fed will soon start reducing the size of its balance sheet. The minutes also provide broad guidance for how balance sheet normalization will proceed. In line with previous Fed experience, the initial plan is not to sell securities but instead to regulate the runoff process as the securities in the portfolio are paid off.
Given this approach, the evolution of the Fed's balance sheet going forward will generally depend on policy decisions about certain parameters and on the way those decisions interact with the paydown process for the Fed's asset portfolio. Among these factors are:
- The date the Fed starts rolling off net assets
- The composition of the portfolio when the roll-off starts
- The level of Treasuries and MBS paydowns that can be anticipated going forward
- The Fed's decisions to reinvest paydowns using a schedule of roll-off caps, as was done in 2014-15
- The asset composition of any reinvestments the Fed decides to make
- The Fed's decisions on selling some portfolio assets if paydowns are low, and the amount and timing of those sales
As evident from this list, there are many factors critical for predicting the evolution of the SOMA portfolio. The March FOMC minutes narrowed the uncertainty considerably, with the baseline program capping the monthly amount of securities allowed to roll off. When paydowns exceed that cap, the Fed will reinvest the proceeds in either Treasuries or MBS. The plan is to set two independent caps: one for Treasuries and one for MBS.
While the minutes helped narrow down how the normalization process would look like, there are still several possibilities. For concreteness here, we consider a set of scenarios which can give a general perspective on the way the Fed's balance sheet might evolve in the next few years.
We set the projection horizon to a maximum of four years. The Fed has expressed its intention to maintain an ample level of reserves as part of its preferred method of monetary policy implementation.2 Using the last normalization cycle as a benchmark, we estimate the evolution of the minimum level of bank reserves that is consistent with that objective in the next few years. With this rough estimate in hand, and extrapolating past behavior for the main components on the liability side of the Fed's balance sheet, we find that the pace of normalization described in the March minutes will have reserves reaching their minimum level consistent with "ample" sometime in 2025.
Before we introduce and discuss the different scenarios, we briefly recount how the Fed proceeded the last time it embarked on balance sheet normalization. We will also explain the complications associated with projecting MBS paydowns and how we estimate those.
Balance Sheet Normalization in the Past
In response to the global financial crisis, the Fed conducted several rounds of large-scale asset purchases (LSAP). As a result, the Fed's SOMA portfolio of securities increased from $0.5 trillion in November 2008 to over $4.2 trillion by October 2014, as seen in Figure 1. After the third LSAP program ended in October 2014, the SOMA portfolio had 63.8 percent in Treasuries and agency debt and 36.2 percent in MBS.3
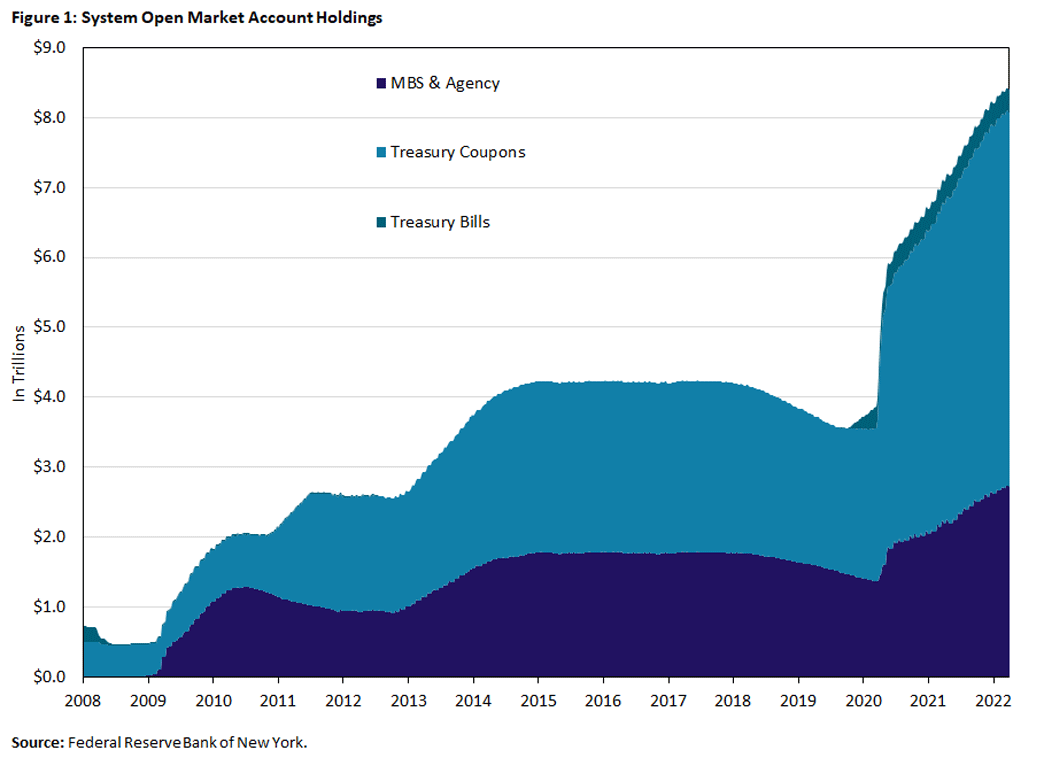
Between October 2014 and October 2017, the SOMA portfolio holdings remained constant as the Fed reinvested principal payments into the same type of security that was maturing. The idea was to keep the Fed's balance sheet level until policy increases in interest rates were well underway.
When the Fed started decreasing its balance sheet in October 2017, the plan was to gradually reduce SOMA holdings by reinvesting the portion of principal payouts above gradually increasing caps:
- For Treasury coupons, the cap started at $6 billion per month and increased by $6 billion every three months until it reached $30 billion per month in October 2018.
- For agency debt and MBS, the initial cap was set at $4 billion per month and increased by $4 billion every three months until it reached $20 billion per month.
The plan was for the caps to remain until the Fed determined that it held the minimum securities necessary to implement monetary policy efficiently and effectively using a so-called "floor system."4
Under this plan, balance sheet normalization continued until August 2019, reducing SOMA holdings from $2.5 trillion in Treasury coupon bonds and $1.8 trillion in MBS and agency securities to $2.1 trillion and $1.5 trillion, respectively.
In August 2019, the Fed stopped reducing its securities portfolio and started again reinvesting all principal payments. At this point, however, the Fed sought to gradually adjust the composition of SOMA holdings toward more Treasury securities (and less MBSs). Principal payments on agency debt and MBS up to $20 billion per month would be reinvested in Treasury bonds. If these payments amounted to more than $20 billion, then the Fed would reinvest the surplus into agency MBS.
In principle, given the secular increase in currency in circulation, the level of bank reserves would continue to gradually decrease even if the Fed keeps constant the size of its balance sheet. Signs of stress in short-term funding markets pushed the Fed to interrupt the process in October 2019: To keep the level of reserves at or above the level reached in September 2019, the Fed began purchasing Treasury bills.
In response to financial market stress that occurred at the outset of the pandemic in March 2020, the Fed began a new program of large asset purchases. As a result, SOMA holdings increased at a rapid pace until November 2021, when purchases were gradually reduced to zero over four months. By March 2022, at the end of this process, the SOMA portfolio reached $8.4 trillion ($5.7 trillion in Treasuries and $2.7 trillion in MBSs).
Plans for the Coming Balance Sheet Normalization Process
As the economy recovers from the pandemic, the Fed has started discussing a new process of balance sheet normalization. In January, the Fed released a set of principles for reducing the balance sheet. Similar to the plan implemented in 2017, the Fed intends to reduce security holdings over time by adjusting reinvestments of principal payments. In the longer run, the Fed intends to hold primarily Treasury securities in the SOMA portfolio.
The minutes of the FOMC meeting in March 2022 provided further details on a possible plan to follow to normalize the Fed's balance sheet.5 These details include:
- Reducing SOMA primarily by reinvesting principal payments only to the extent they exceed monthly caps
- Establishing maximum monthly caps of $60 billion for Treasury debt and $35 billion for agency MBS, phased in over a period of about three months
- Redeeming Treasury coupon securities up to the cap first, and then redeeming Treasury bills in months when principal payments of Treasury coupon securities are below the cap
This plan implies a more rapid pace of balance sheet runoff than seen in 2017-19. At the same time, the balance sheet is much larger now. As a ratio of nominal GDP, the SOMA portfolio was equal to 21.6 percent in October 2017 and 34.6 percent in March 2022. Importantly, the plan recognizes that after balance-sheet runoff is well underway, it may become relevant to consider sales of MBS to enable progress towards a longer-run SOMA portfolio composed primarily of Treasuries.
Projecting Paydowns
A critical step in projecting the evolution of the SOMA portfolio is the estimation of securities paydowns. While this process is relatively straightforward in the case of Treasury bonds, it is much harder for the case of MBSs. We consider a maximum horizon of four years, for two main reasons:
- It is likely that the balance sheet would be close to reaching its long-run desired path around that time.
- Predictions become more uncertain (and less informative) with longer time horizons.
Treasury Coupons
We estimate paydowns based on the maturity of securities in the portfolio, using CUSIP information. For any amounts above the cap, we assume the Fed reinvests the proceeds in Treasuries in proportions equal to each maturity's share in new issuances by the Treasury.6 To estimate the maturity distribution of future issuances, we assume that it remains consistent with the average composition over the last 11 years.7
Treasury Bills
We assume bills are allowed to run off in the amount equal to the Treasury (monthly) runoff cap exceeding Treasury coupon principal payments. In doing so, we also abstract from the maturity distribution of SOMA Treasury bills, noting that the short maturity of Treasury bills does not substantively alter our multiyear projections.
MBS
Paydowns in MBS are comprised of two components:
- The amortization of mortgage pools backing the security
- Unscheduled principal payments on those mortgage pools (due, for example, to mortgage refinancing activity)
To project amortization paydowns, we construct a series of amortization schedules conditional on mortgage rates and MBS term. Then, for each MBS, we apply the planned month-over-month percent change in principal according to the schedule with the nearest rate.
To project unscheduled principal payments, we source aggregate 2016 to present MBS S-Curves showing the annual 12 month unscheduled principal payment on mortgage pools conditional on loan age and refinancing incentive.8 From the S-Curves, we derive simple weighted average conditional prepayment rates (CPRs) for each mortgage term (15 or 30 years) and a selection of weighted average loan age and refinancing incentive brackets. We then apply the weighted average CPR across all MBS within its bracket. In doing so, we abstract from additional non-rate and amortization factors such as curtailment, buyouts, seasonality and home price appreciation.9
Caveats
While our methodology is clearly a simplification, we find that under similar interest rate assumptions our results are in line with other recent independent projections of MBS principal paydown.10
The SOMA portfolio has a small amount of agency debt, commercial MBS (CMBS) and other term MBS securities. For simplicity, we treat CMBS and other term MBS securities similar to long-term agency MBSs. Also, we allow agency debt to mature in line with its maturity date. Finally, we count all these miscellaneous securities towards the MBS cap. Since these security types currently compose less than 0.25 percent of SOMA securities, this simplification does not notably affect projected paydowns.
Scenarios
With the expected path of paydowns established, we can now consider three scenarios for how the SOMA portfolio can be expected to evolve over the next two to four years.
Scenario 1: Benchmark Scenario
Following the March FOMC minutes, we assume the Treasury reinvestment cap increases from $20 billion to $60 billion and the MBS cap increases from $15 billion to $35 billion from June to August. We assume that 15-year and 30-year mortgage rates stabilize at about 4.25 percent and 5 percent, respectively. Furthermore, any MBS principal payments in excess of the cap are reinvested in Treasuries in light of the FOMC's stated goal of holding primarily Treasuries in the longer run.
Scenario 2: No Phase-In Period for Caps
In the second case, we assume the reinvestment caps start at their long-run level of $60 billion and $35 billion in June. We again assume that 15-year and 30-year mortgage rates stabilize at approximately 4.25 percent and 5 percent, respectively, and we note that there are no MBS reinvestments to consider, as principal payments always remain strictly below the cap.
Scenario 3: Sustained MBS Reductions
For this scenario, we use the same caps as Scenario 2 and assume that the amount of MBS in the SOMA portfolio decreases at a constant rate of $30 billion per month starting in June. One motivation for doing this is that while MBS paydowns are likely to run consistently under the $35 billion cap, there is still significant uncertainty about the pace of MBS paydowns that will actually be observed. We take this assumed pace of paydowns as a valuable representation of the upper range of possibilities.11 Furthermore, given current discussions about the possibility of MBS sales, it can be informative to consider a case where MBS holdings continue to fall consistently, independent of paydown levels.
Projections
Given the three scenarios and our paydown projection methodology, we now discuss how the balance sheet may evolve under Scenario 1 and how Scenarios 2 and 3 differ.
In Figure 2, we consider Treasury coupon paydowns, runoffs and reinvestments under Scenario 1.
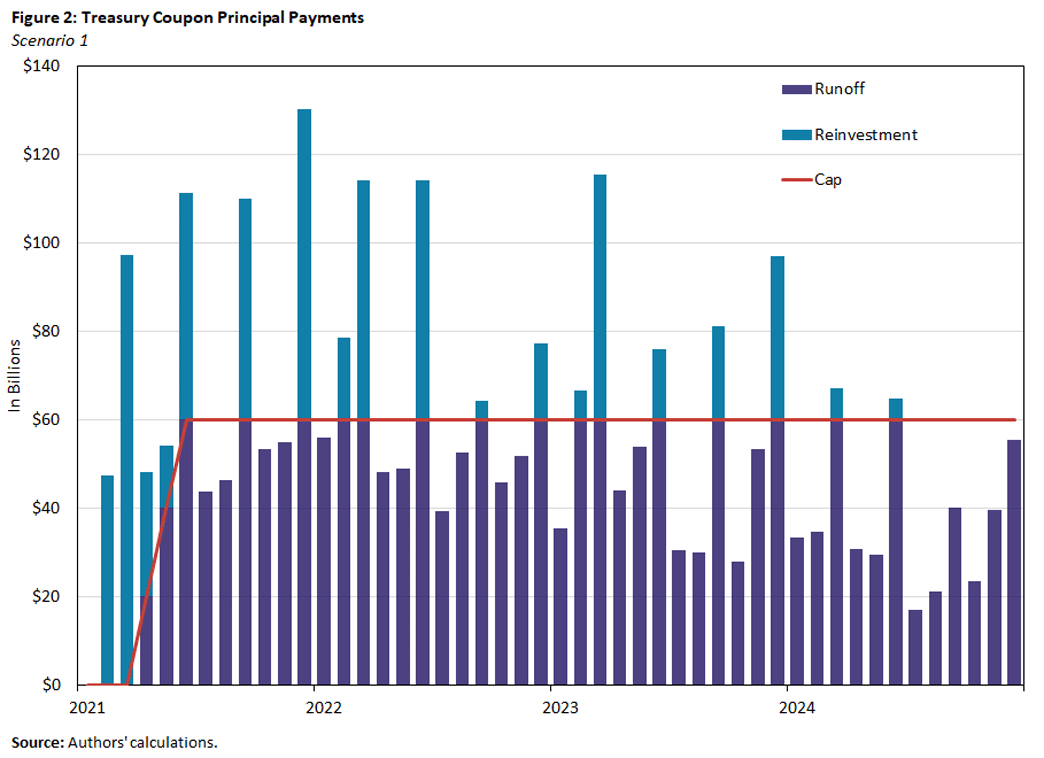
As seen in the figure, Treasury coupon principal payments run below the cap during the first and last month of each quarter and thus will have their runoff supplemented by maturing Treasury bills.
However, the second month of each quarter tends to rise above the cap due to an outsized portion of Treasury issuances and, thus, maturities occurring on the second month of the quarter. For these months, the Fed is assumed to reinvest excess Treasury coupon paydowns in new issuances, leading to continued maturity concentrations and the cap occasionally binding even after three years.
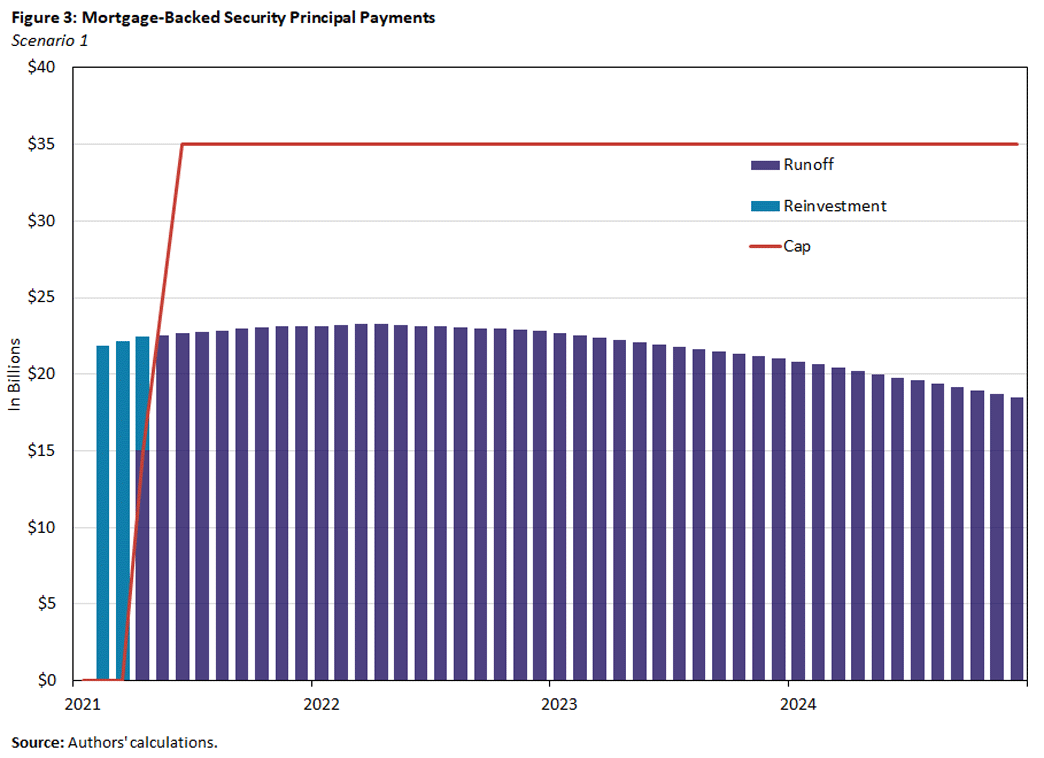
In Figure 3, we consider MBSs and project that MBS paydowns will consistently be well below the $35 billion runoff cap. We also note that the path of MBS paydowns is relatively insensitive to changes in mortgage rates, as most of the mortgages backing SOMA MBSs were originated during a period of record-low mortgage rates, which trumps any incentive to refinance on the part of the mortgage borrowers.
Based on the reinvestment and runoff paths described above and the corresponding Treasury bill runoff amounts implied by our assumptions, we chart the progression of the SOMA portfolio under Scenario 1 in Figure 4.
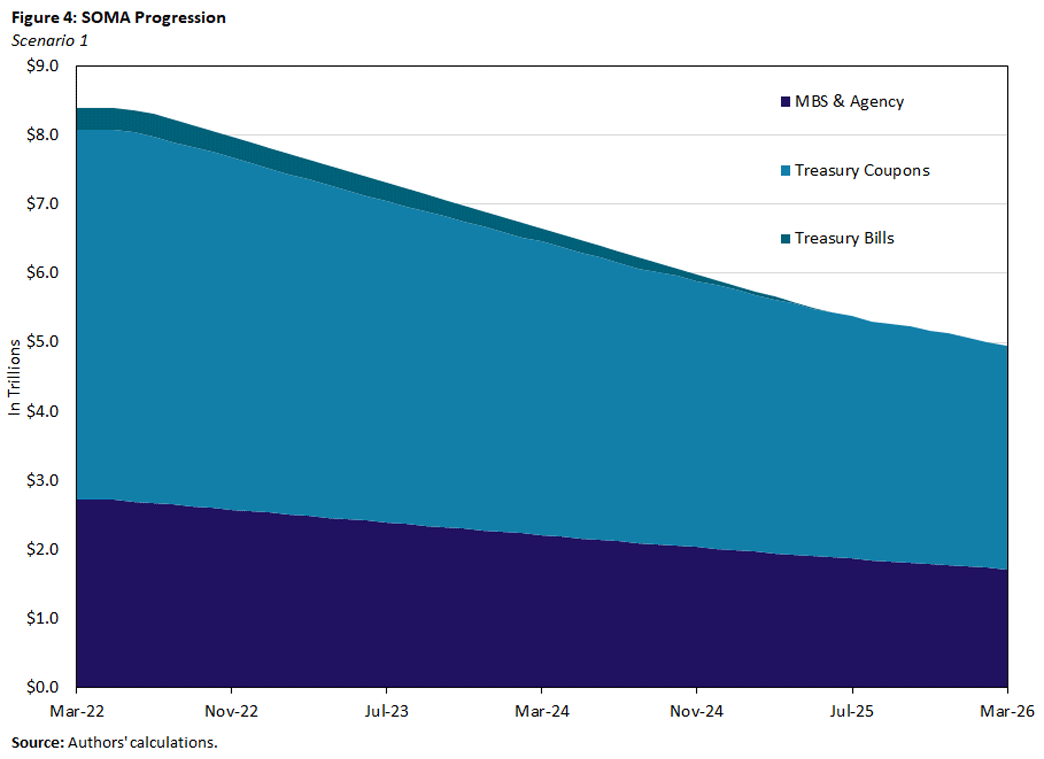
We note that Treasury bills persist on the portfolio for approximately three years and that holdings of Treasury securities run off at a significantly faster rate than MBSs. Indeed, under this scenario MBSs increase their share of SOMA from 32.5 percent in March 2022 to 34.7 percent by March 2026, delaying progress toward the FOMC longer-run goal of holding primarily Treasury securities.
Turning to Scenarios 2 and 3, we calculate the expected paths for the SOMA portfolio and its composition, and we summarize our results in Table 1, where we include Scenario 1 as well for comparison.
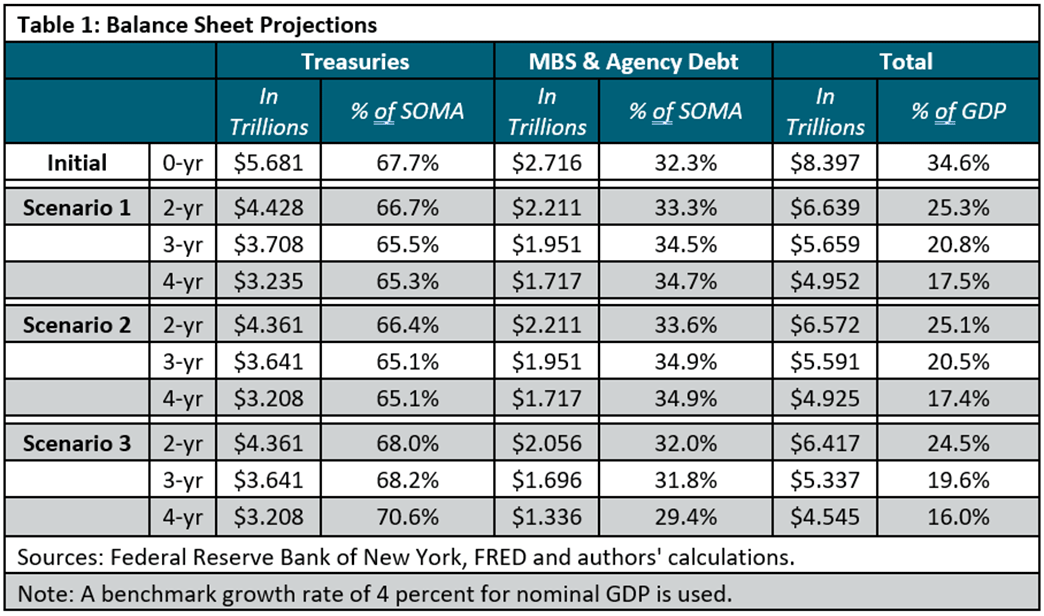
Compared with Scenario 1, Scenario 2 shows that the effect of immediately implementing the full cap is an additional reduction in Treasury security holdings of approximately $67 billion in year 2 and only $27 billion in year 4. This additional reduction in Treasury holdings comes about as a result of lower reinvestments into Treasury coupons ($60 billion of reinvestments due to paydowns in Treasury coupons and $7 billion of MBS paydowns reinvested into Treasury coupons, both over the first two months). Note that the projected level of MBS in scenarios 1 and 2 does not change at all over the horizon. This is a direct consequence of the assumption that all MBS paydowns are invested in Treasuries. The phasing in of the MBS cap does not matter for the evolution of MBS holdings in this case.
As we mentioned before, there is significant uncertainty over paydowns of MBS going forward. Scenario 3 illustrates how sensitive the SOMA portfolio is with respect to the pace of reduction in MBS holdings. In particular, considering continuous MBS paydowns of $30 billion for the entire horizon result in an extra $381 billion reduction of MBS holdings relative to Scenario 1 by year 4. Yet, even in this scenario, the share of SOMA holdings in MBS falls very gradually, remaining at 29.4 percent after four years.
The last two columns of Table 1 suggests that, at the proposed pace, it would take three to four years to shrink the Fed's balance sheet to something equivalent to 20 percent of GDP, a number that is often considered a reasonable target. On the other hand, reducing the proportion of MBS in the total holdings of SOMA securities seems likely to take much longer than four or five years.
Concluding Remarks
Our projections suggest that, for the set of parameters currently under consideration regarding unwinding the balance sheet, it will take the Fed three or four years to return the balance sheet to its long-run desired trend. In terms of composition, approaching the Fed's ultimate target of holding primarily Treasury securities is likely to take much longer. This is the case even when considering scenarios in which the Fed may eventually revert to selling significant amounts of MBS.
Similarly, in terms of the long-run behavior of the balance sheet, whether to consider gradually phasing in the roll-off caps does not seem to matter much. For that reason, it seems likely that such a decision would be based mainly on short-term considerations, such as communication and market functioning.
Huberto M. Ennis is an economist and Kyler J. Kirk is a research associate, both in the Research Department at the Federal Reserve Bank of Richmond.
1
See the Fed's System Open Market Account Holdings of Domestic Securities summary for more details.
2
Following the January FOMC meeting, the Fed released its Principles for Reducing the Size of the Federal Reserve's Balance Sheet. In it, the FOMC expressed its intention "to maintain securities holdings in amounts needed to implement monetary policy efficiently and effectively in its ample reserves regime."
3
The Board of Governors' History of the FOMC's Policy Normalization Discussions and Communications provides an excellent summary of the recent history of Fed balance sheet policy.
4
Under a "floor system," the Fed sets the risk-free interest rate it pays on reserves close to its target rate and supplies sufficient reserves to reduce the market rate to near the floor created by its risk-free rate. For a detailed discussion, see the 2012 article "Corridors and Floors in Monetary Policy."
5
See "Plans for Reducing the Size of the Balance Sheet" on page 4 of the Minutes of the Federal Open Market Committee March 15-16, 2022 (PDF).
6
See the New York Fed's FAQs: Treasury Rollovers for a more detailed discussion and an example.
7
Since 2010, the maturity distribution of Treasury coupon issuance has remained approximately invariant. We assume this trend continues and project future issuances' maturity distribution based on the mean quarterly average new issuance share of each tenor between the first quarter of 2010 and the first quarter of 2022.
8
A mortgage prepayment S-Curve displays the annual unscheduled percent reduction in mortgage principal versus the mortgage refinancing incentive, defined as the difference between the mortgage rate and the prevailing market mortgage rate.
9
See the 2017 article "Principal Payments on the Federal Reserve's Securities Holdings" for a brief discussion of additional factors affecting MBS principal payments.
10
While simplified, our projection strategy produces MBS principal paydowns of around $25 billion when MBS rates are 3.9 percent. This aligns with the New York Fed's baseline scenario for MBS principal paydown projections as of Feb. 16, published in Figure 7a of Lorie Logan's recent speech "Federal Reserve Asset Purchases: The Pandemic Response and Considerations Ahead."
11
In fact, recent SOMA MBS paydowns have consistently exceeded publicly released forecasts and historical trends, coming in at $54.6 billion, $50.9 billion, $42.8 billion and $38 billion from December 2021 to March 2022. These are above model predictions between $20 billion and $35 billion. See the New York Fed's Agency MBS Historical Operational Results and Planned Purchase Amounts for the new purchase versus reinvestment breakdown.
To cite this Economic Brief, please use the following format: Ennis, Huberto M.; and Kirk, Kyler J. (April 2022) "Projecting the Evolution of the Fed's Balance Sheet" Federal Reserve Bank of Richmond Economic Brief, No. 22-15.
This article may be photocopied or reprinted in its entirety. Please credit the authors, source, and the Federal Reserve Bank of Richmond and include the italicized statement below.
Views expressed in this article are those of the authors and not necessarily those of the Federal Reserve Bank of Richmond or the Federal Reserve System.
Subscribe to Economic Brief
Receive a notification when Economic Brief is posted online.
Contact Us