Price Changes and Monetary Non-Neutrality
Economists have not reached a consensus on the effectiveness of monetary policy for stimulating short-run consumption. While quantitative models are typically disciplined through average pricing moments in the data, this is not sufficient to draw conclusions on monetary non-neutrality. In this article, we quantify the importance of the age-dependence of pricing moments for monetary policy. In particular, we show that newer products change their prices more often and by a larger amount. Furthermore, these patterns are supported by a price experimentation narrative. Finally, we quantify that the stimulus effect of monetary policy can be more than three times as large when allowing for price experimentation consistent with pricing patterns of the data.
How effective is monetary policy in stimulating short-run consumption? Researchers and policymakers have been debating this question for decades, with a plethora of studies running the spectrum from "barely effective" on one side to "quite effective" on the other.
An important set of these studies is centered on the notion of price stickiness, or the tendency of output prices to stay fixed or adjust slowly over time. Price stickiness is an important concept for monetary policy because money pumped into the economy cannot increase consumption if it is simply offset by increases in inflation. In other words, if households have an additional 10 percent to spend and prices increase by the same amount, consumption does not increase. Obviously, some degree of price stickiness would allow households to consume more in the short term.
As a result, many studies have focused on nominal frictions that prevent firms from changing their prices without incurring a cost. These frictions have been modeled in (roughly) two ways and relate to the timing of price changes:
- Firms can only change their price(s) with some exogenous probability, also referred to as the "Calvo" parameter. In this type of model, the timing of price changes is completely independent of a firm's incentive to change its prices.1
- Alternatively, firms can change their prices whenever they want, but they face a fixed cost (also referred to as a "menu cost") when doing so.
To determine which sort of pricing friction best fits the data, researchers have investigated these models' abilities to replicate salient features of the price change distribution. In particular, how often and by how much do prices change on average?
Research has shown that Calvo models and menu cost models can predict these moments equally well. However, their implications for monetary policy could not be further apart. Pricing models with Calvo frictions imply that monetary policy is highly effective in stimulating consumption in the short term (that is, a high degree of monetary non-neutrality, which is the idea that changes in money supply affect real variables, such as aggregate consumption). On the other hand, standard menu cost models predict that the stimulus effect is quite small.
What is behind such differences? The key is the so-called "selection" effect, as formalized in the 2007 paper "Menu Costs and Phillips Curves." In a world with menu costs, firms with the highest need to adjust their prices are exactly the ones that do so. This leads to a more rapid adjustment in the aggregate price level, which is most relevant for monetary non-neutrality.
Given their diametrically opposed implications for monetary policy, it is important to know which sort of pricing friction best describes the data. Consequently, researchers have looked at pricing moments that extend beyond averages and focused on different degrees of heterogeneity in price changes. For example, to what extent are price changes different across sectors?2 Rather than looking at average price changes, the 2011 paper "Menu Costs, Multiproduct Firms and Aggregate Fluctuations" argues that a model should also be scrutinized for its ability to replicate large and small price changes.
In this article, we focus on heterogeneity in price changes within sectors and, in particular, how prices evolve over a product's life cycle. We show that prices change more often and by larger amounts whenever they have been introduced more recently. That is, the frequency and (absolute) size of price changes are inversely related to a product's age.
Then, we argue that these patterns are best described by a price experimentation mechanism. Under this narrative, firms are uncertain about the demand they face, so they experiment with their prices to understand their demand curve better. Using a quantitative framework with menu costs, we then show that incorporating heterogeneity in price changes along a product's life cycle weakens the selection effect and, hence, increases monetary non-neutrality.
Compared to a set of standard menu cost models, we argue that the stimulus effect of monetary policy can be more than three times as large when allowing for price experimentation consistent with pricing patterns of the data.
New Insights on Products' Price Characteristics Over Their Life Cycle
To track a product's price evolution, we need detailed pricing data at the product level. In particular, we require a product's price over its entire life cycle. In addition, it is important to cover a relatively wide set of products, since we are ultimately interested in drawing conclusions on aggregate outcomes.
As a result, we rely on a dataset from IRI Marketing that provides more than 10 years of data covering approximately 2.4 billion transactions at the store-product-week level. While these data mainly cover nondurable products typically found in the supermarket, it represents roughly 15 percent of household spending in the more representative Consumer Expenditure Survey.
An important advantage of the IRI Marketing dataset is that it is available at a weekly (rather than monthly) frequency. Our findings indicate that most pricing dynamics actually occur during the first few weeks after a product's entry into the market. The IRI Marketing data contain information on a product's introduction date, so we are not confounding products' entry dates with when they are first observed in the data. When data are missing, it is possible that these two dates do not coincide with each other.
When and by How Much Do Prices Change?
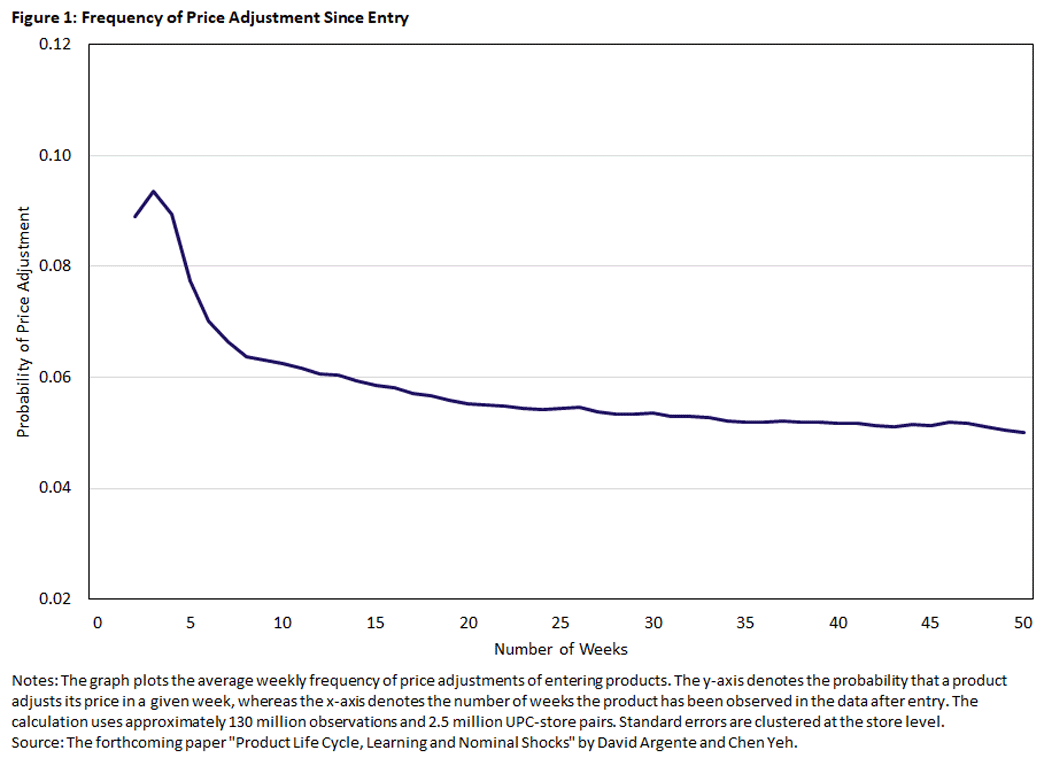
Our first finding is that newer products change their prices almost twice as often as the average product, as seen in Figure 1.
The figure clearly shows that the average frequency of price adjustment declines with the product's age (measured in weeks). Also, this decline is most pronounced during the early stage of a product's life cycle. In particular, most of the variation over a product's age occurs during the first five weeks after a product is introduced.
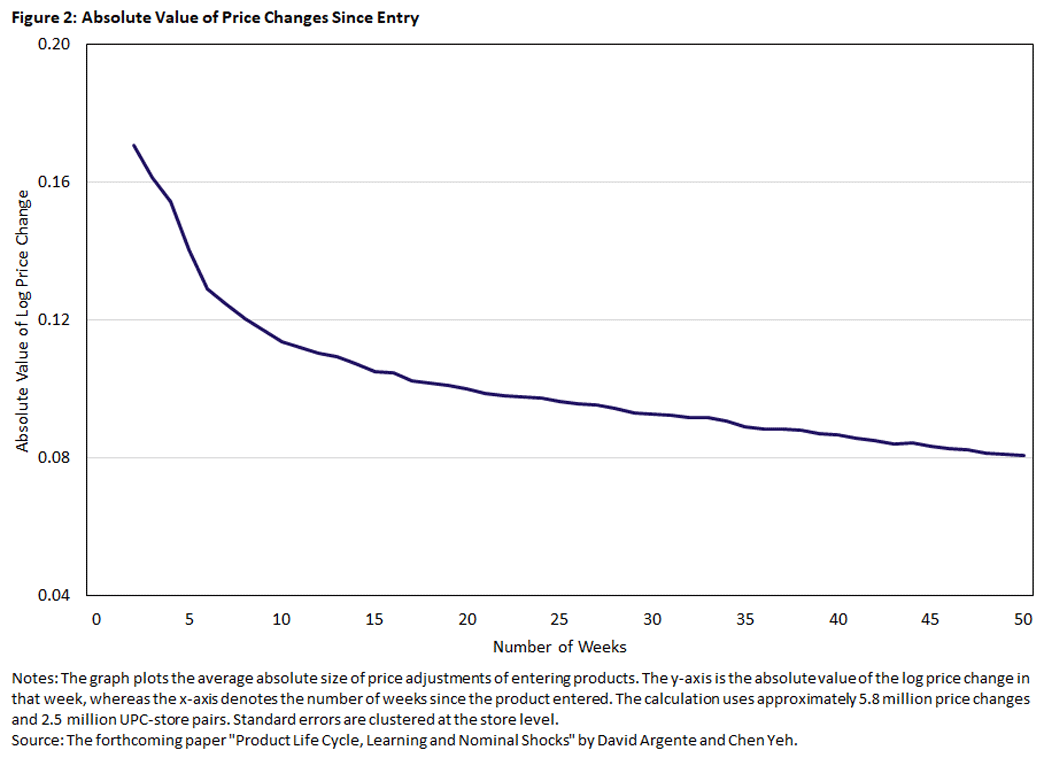
Moreover, new products not only see their prices changed more often but also experience larger price changes, as seen in Figure 2.
Similar to the frequency of price changes, the absolute value (in percentage terms) of price changes is monotonically declining in a product's age. That is, price changes (both increases or decreases) are more likely to be large during the early stages of a product's life cycle. While this happens more gradually when compared to the frequency of price changes, most of the variation again occurs during the first five weeks after a product's introduction. This observation highlights the need for pricing data at a high frequency, such as the IRI Marketing data.
We also argue that the age dependence of pricing moments does not rely on "normally sized" price changes. In fact, the data show that about a quarter of all large price changes occur during the first three weeks of a product's entry.
Moreover, the fraction of large price changes also decreases as a product ages. This is an important observation, since the aforementioned paper "Menu Costs, Multiproduct Firms and Aggregate Fluctuations" argues that getting large price changes right is important for our understanding of monetary non-neutrality. However, that paper assumes that these large price changes occur for exogenous, idiosyncratic reasons which do not vary over a product's life cycle. Under this assumption, the selection effect can be severely weakened, leading to high levels of monetary non-neutrality.
Rationalizing Our Stylized Facts: Price Experimentation
Our empirical findings indicate that the age dependence of pricing moments is a salient feature of the pricing data. In this section, we argue that these patterns can be rationalized by a fairly simple economic mechanism: price experimentation. Whenever firms introduce new products, they likely do not know all characteristics of their customers. In particular, firms may not know by how much the quantity of their product(s) change whenever they change their prices.
However, firms can gain some of this information by experimenting with their prices. The more different prices a firm chooses, the more it observes realized quantities which allows the firm to trace its demand curve.
This narrative of price experimentation seems to fit our new stylized facts on the age dependence of pricing moments quite well. In fact, an earlier literature on price experimentation showed that the incentives for learning with prices are higher whenever a firm has less information. This seems more likely after a product's market entry.3 As a result, a firm would like to obtain more frequent and informative signals about its demand right after it has introduced its product(s). Obviously, the firm can do so by making more frequent and sizable price changes.
Price Experimentation and Product Release Waves
This conjecture on price experimentation is supported by another empirical feature of the pricing data. To document this fact, we exploit the staggered introduction of products by the same retailer across different places.
Consider a retailer with a new product and the ability to sell it in stores across the country. A retailer that introduces its product in, say, New York can learn from its sales in this location, then begin to build out more of a demand curve once it begins selling the same product a few months later in Chicago.4 Thus, this retailer "carries over" some information from its first wave of sales to its second. As a result, we would expect that the age dependence of pricing moments (reflecting price experimentation) is dampened in the second wave since the incentives for price experimentation would be weaker.
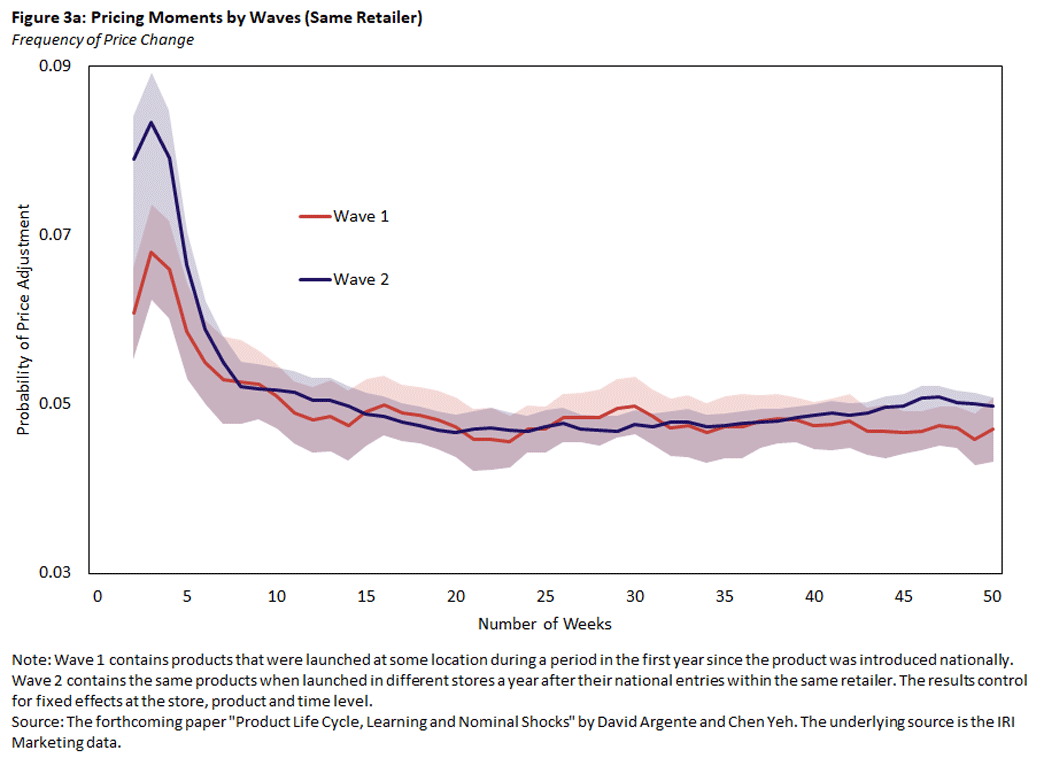
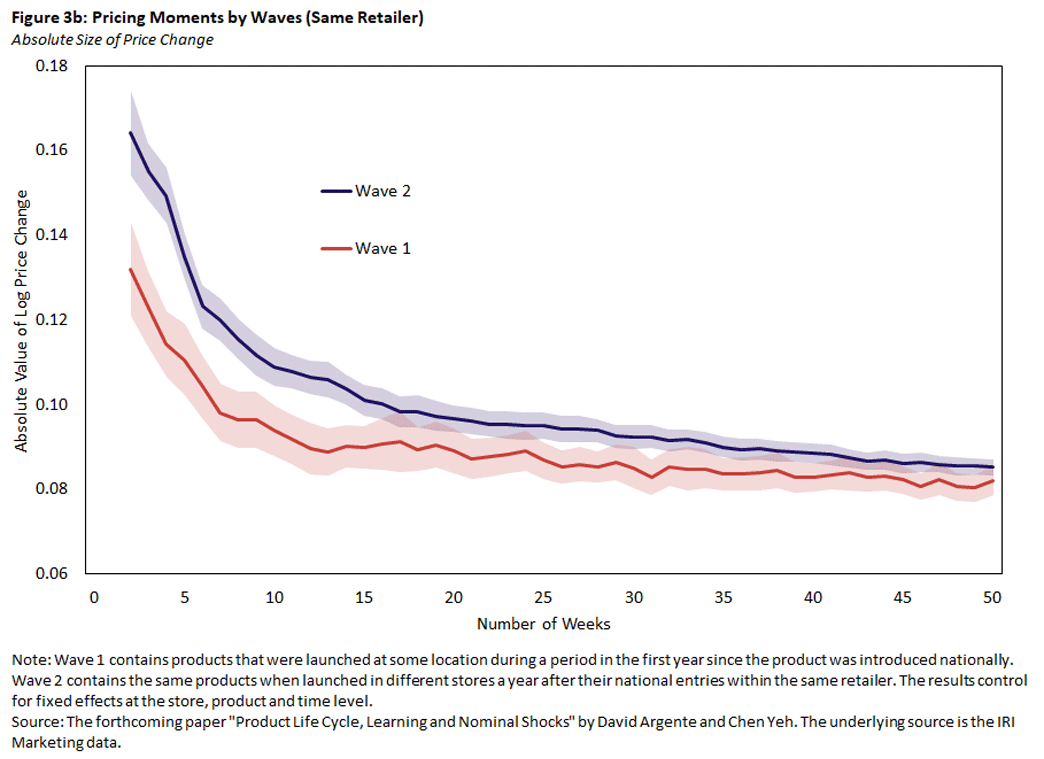
This is exactly what we see in our pricing data as displayed in Figures 3a and 3b. We compare the pricing moments of products by the same retailer being introduced in one set of locations and another set one year afterward.
The age dependency of both the frequency and absolute size of price changes are weaker in the second wave of product introductions. This prediction is unique to the price experimentation narrative, which corroborates our initial thoughts on the underlying economic mechanism generating age-dependent pricing moments.
Aggregate Implications: Monetary Non-Neutrality
The fact that our pricing data reflect strong features of price experimentation is useful not only for our economic intuition, but also for setting up a quantitative framework in a comprehensive way. We do so by introducing the simplest form of price experimentation in a quantitative, general equilibrium menu cost model. This framework is disciplined by the age dependence of pricing moments in our data.
More importantly, this framework (being consistent with the above stylized facts) allows us to perform counterfactual experiments on monetary policy. In particular, what is the effectiveness of monetary policy when the age dependence of prices is taken into account?
We compare our results to a standard menu cost model and use the cumulative response in output over time as a metric of monetary policy "effectiveness." In the end, we find that the cumulative output response to a monetary policy shock is more than three times as large when compared to a standard menu cost model. In the latter case, selection is fully triggered by the monetary policy shock. In our setting, the monetary policy shock is less important for individual firms' pricing decisions, since they also care about actively learning about their demand curve. As a result, selection is weakened, and monetary non-neutrality increases.
Conclusions
The effectiveness of monetary policy is a widely debated topic, and there is a great divergence in answers even if we restrict our attention to models with nominal frictions. In this article, we showed that the age dependence of pricing moments is a salient feature of the data. Newer products have their prices changed not only more often but also by larger amounts. Furthermore, large price changes occur significantly more often during the early stages of a product's life cycle.
These patterns seem to be fully consistent with a simple mechanism of price experimentation. We use our novel stylized facts on the age dependence of pricing moments to discipline our quantitative, general equilibrium model, and we find that incorporating the age dependence of pricing moments through a narrative of price experimentation can lead to substantial amplification of monetary shock when compared to standard menu cost models.
Chen Yeh is an economist in the Research Department at the Federal Reserve Bank of Richmond.
This assumption is present in the workhorse New Keynesian framework, which is often used by central banks.
The 2010 paper "Monetary Non-Neutrality in a Multi-Sector Menu Cost Model" was one of the first studies to quantify the importance of heterogeneous pricing moments for monetary policy.
See, for example, the insights from the 1993 paper "Monopoly Experimentation."
Implicitly, we are assuming that consumers in New York and Chicago are somewhat comparable, but this seems reasonable.
To cite this Economic Brief, please use the following format: Yeh, Chen. (October 2022) "Price Changes and Monetary Non-Neutrality." Federal Reserve Bank of Richmond Economic Brief, No. 22-41.
This article may be photocopied or reprinted in its entirety. Please credit the author, source, and the Federal Reserve Bank of Richmond and include the italicized statement below.
Views expressed in this article are those of the author and not necessarily those of the Federal Reserve Bank of Richmond or the Federal Reserve System.
Receive a notification when Economic Brief is posted online.


