Black-White Differences in Student Loan Default Rates Among College Graduates
Despite the financial benefits that college completion offers, student loan defaults are not uncommon among college graduates. Default rates differ markedly by race, with 30 percent of Black college graduates with federal student loans reporting having defaulted at least once compared to 10 percent of White graduates. This Economic Brief compares student loan borrowing, repayment and default behavior of Black and White college graduates. While the amounts that the two groups borrow are comparable, Black graduates are not only more likely to default but also more likely to be on income-based repayment plans. Ongoing research suggests that financial circumstances such as differences in earnings, wealth and credit terms contribute to Black-White differences in student loan default.
Graduating from college greatly increases lifetime income and reduces unemployment risk on average. Yet, despite these financial benefits, we observe defaults on student loans even among college graduates, with systematically higher default rates among Black graduates compared to White graduates. In this Economic Brief, I document student loan borrowing, repayment, and default behavior among college graduates, highlighting differences between Black and White borrowers.
Who Borrows and How Much?
We focus on federal student loans taken out to fund undergraduate education, which make up the bulk of student loan borrowing in the U.S. Our first data source is the Beginning Postsecondary Survey (BPS), which surveys first-time students in the first year of their postsecondary education and follows up with them after three years and six years. We use data from the BPS 2012/2017, which is the second follow-up of students who began their postsecondary education in the 2011-2012 academic year.
The BPS reveals that majority of bachelor's degree recipients take out student loans: Table 1 below shows that nearly two-thirds of White students and over 85 percent of Black students took out federal loans to fund their undergraduate degrees. Also, Black students who borrowed took on nearly $32,000 in student loans on average, about 12 percent more than the average amount of White students who borrowed. Thus, while Black students are far more likely to borrow than White students, the amount borrowed conditional on taking out loans is comparable across races.
| Table 1: Cumulative Amount Borrowed Among Those Who Attained a Bachelor's Degree In 2017 |
||
|---|---|---|
| Race | Percent Who Borrowed | Average Amount Among Borrowers |
| White | 65.5% | $28,621 |
| Black | 85.7% | $31,937 |
|
Source: U.S. Department of Education, National Center for Education Statistics, Beginning Postsecondary Students: 2012/2017. Note: A previous version of the table had the borrowing amounts for White and Black borrowers flipped and has been corrected. |
||
Student Loan Repayment and Default
When it comes to repayment, borrowers have several options. The standard and graduated repayment plans are both "traditional" plans:
- The standard plan is the default plan for all borrowers and requires equal monthly payments over a 10-year period.
- The graduated plan has payments that start small and grow over the 10-year period.
In addition, there are several income-based plans that all calculate the monthly payment as a fraction of the borrower's income.1 Table 2 below shows repayment plan choices and the monthly payment under each choice by race.
| Table 2: Repayment Plan Type and Monthly Payment Amounts Among Those Making Payments In 2017 |
||||
|---|---|---|---|---|
| Black | White | |||
| Repayment Plan | % Enrolled | Monthly Payment | % Enrolled | Monthly Payment |
| Standard | 51.8 | $178 | 67.0 | $179 |
| Graduated | 11.9 | $156 | 11.0 | $187 |
| Income-Based | 31.0 | $135 | 19.1 | $138 |
| Alternative | 5.4 | $213 | 3.0 | $229 |
| Source: U.S. Department of Education, National Center for Education Statistics, Beginning Postsecondary Students: 2012/2017. | ||||
Even though students from both races borrow similar amounts, differences in student loan repayment appear immediately upon graduation. Table 2 above shows that two-thirds of White graduates were making payments under the standard plan, while only slightly over half of Black graduates were doing so. Nearly a third of Black graduates were on an income-based repayment plan, compared to less than 20 percent of White graduates.
Before we get into how race may play a factor in student loan default, we want to examine just how widespread defaults in general are. To examine this, we use the 2008/18 Baccalaureate and Beyond Longitudinal Study, which surveys individuals who earned a bachelor's degree in the 2007-08 academic year 10 years after they received the degree. Among the questions asked is whether the individual ever defaulted on a federal student loan. The difference by race is striking, with nearly 30 percent of Black borrowers reporting having defaulted on a student loan compared to only 10 percent of White borrowers.
Race, Student Loan Borrowing and Earnings
We turn next to the relationship between race, student loan borrowing and earnings to see whether this can shed light on the channels connecting race and student loan default. To examine this, we use the National Longitudinal Survey of Youth 1997 (NLSY97). The NLSY97 is a nationally representative panel survey of people born during between 1980 and 1984 who were first interviewed in 1997. Because the survey is a panel, we can observe participants as they make decisions about school, work and finances over time. We restrict the sample to individuals who eventually obtained at least a bachelor's degree.
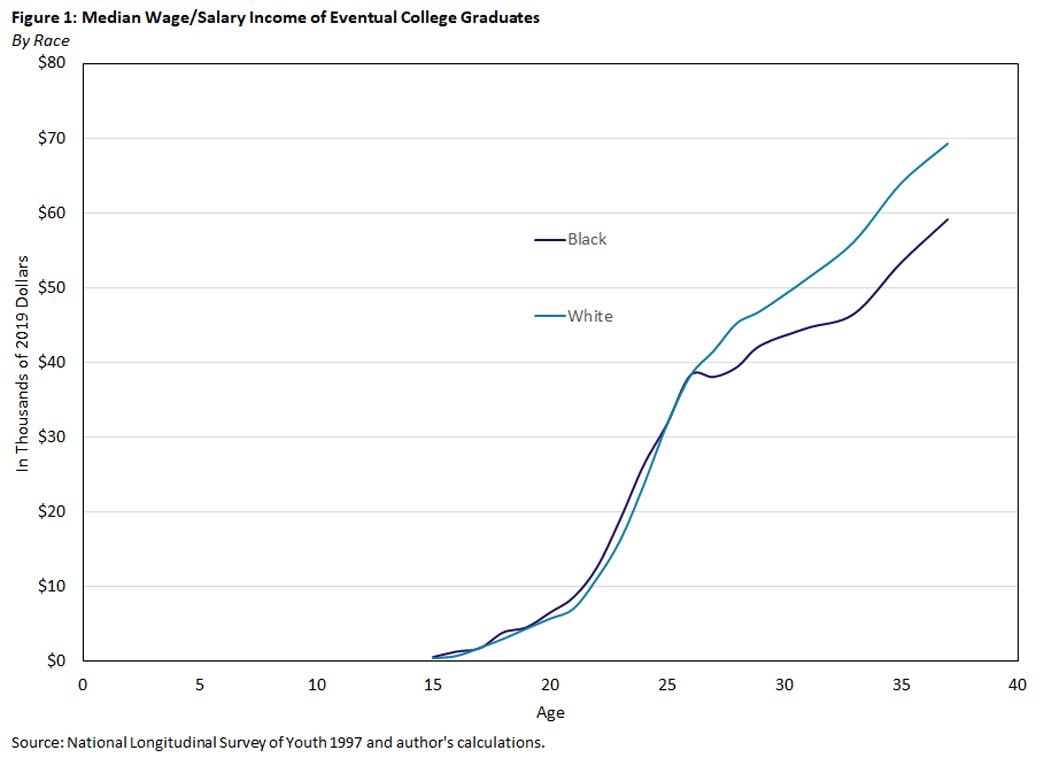
Figure 1 below shows that a racial earnings gap appears among these individuals at age 26 and grows over time. By age 37 (which is the oldest age at which we observe the sampled individuals), the median wage income of White college graduates is $70,000, while the median for Black graduates is $60,000.
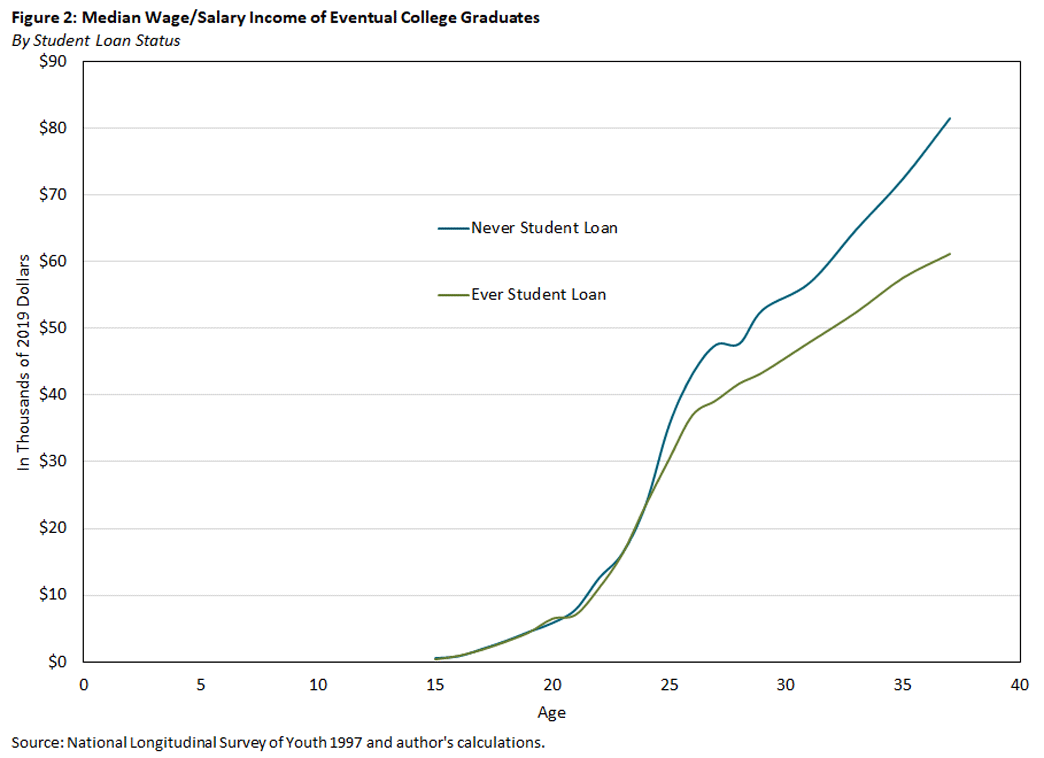
We see a similar pattern if we group individuals by student loan borrowing status rather than by race. Figure 2 below shows that the median wage income of those who took out student loans is lower than the income of those who did not. As was the case with the racial wage gap, the gap in earnings between non-borrowers and borrowers appears when they are in their mid-20s and widens over time. By age 37, the median income of non-borrowers is $80,000, which is $20,000 more than the median income of those who took out student loans.
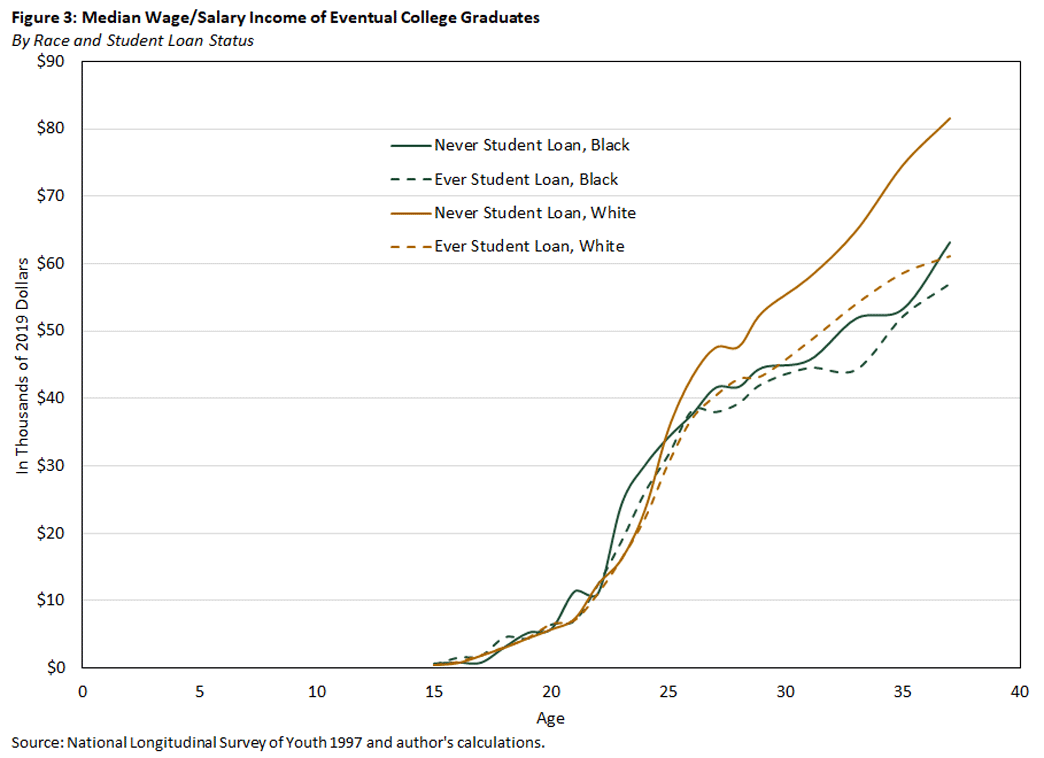
The facts reported in the two figures above lead us to ask whether the racial gap in earnings is a result of the racial gap in student loan borrowing. In other words, does the fact that the earnings of Black graduates are lower than the earnings of White graduates simply reflect the fact that Black graduates are more likely to have taken out student loans? To address this question, Figure 3 below shows median earnings disaggregated by both race and student loan borrowing status.
Figure 3 above suggests that the answer is no: The racial gap in earnings appears both within the group of non-borrowers (the solid lines) and borrowers (dashed lines).
Why do earnings differ by student loan status? This question has received some attention in the literature. For example, the 2019 paper "Life After Debt: Postgraduation Consequences of Federal Student Loans" documents that the unconditional earnings of student loan borrowers are indeed lower than those of non-borrowers. However, when controlling for a host of factors, the relationship disappears. If anything, student loans borrowers are more likely to have higher earnings than non-borrowers. The 2011 paper "Constrained After College: Student Loans and Early-Career Occupational Choices" suggests that the reason might be job selection: Those who have debt are more likely to choose higher-paying jobs.
What Accounts for the Black-White Gap in Student Loan Default Among College Graduates?
A question that yet remains unanswered is: Why are Black college graduates more likely to default on their student loans than White graduates, despite the fact that loan amounts are not significantly different between the two groups? This is the question I am attempting to address in ongoing work with Kartik Athreya, Chris Herrington and Felicia Ionescu using a model of student loan repayment, plan choices and default among college graduates by race.
Financial factors are a key driver that we consider in our framework. In addition to earnings gaps over the life cycle of the kind documented above, we allow for Black-White differences in earnings risk. We also include differences in "initial" wealth — that is, the net worth with which individuals begin life after graduation. Using data from the Survey of Consumer Finances (SCF), Table 3 below documents these gaps. The SCF is a survey of families, so the statistics are reported at the family level rather than the individual level.
| Table 3: Net Worth and Leverage by Race for College Graduates Age 25-30 With Student Loan Balances In 2019 Dollars |
||||
|---|---|---|---|---|
| Race | Mean Net Worth | Median Net Worth | Mean Leverage Ratio | Median Leverage Ratio |
| White | $73,549 | $13,067 | 3.01 | 0.82 |
| Black | $7,747 | -$7,160 | 9.12 | 1.10 |
| Source: Survey of Consumer Finances | ||||
The gaps in financial circumstances are evident: The median net worth of families for which the respondent is a White college graduate aged 25-30 is over $13,000. By comparison, the median Black family has negative net worth, with debt exceeding assets by over $7,000. The mean net worth for families of White graduates ($73,549) is nearly 10 times higher than the mean net worth of Black families ($7,747).
The ability to repay student loan debt may also be related to borrowing from other sources. We see from Table 3 above that, at the median, the assets of White families exceed their debts (as their leverage ratio is less than 1), while the opposite is true for Black families.
In contrast, the mean leverage ratio far exceeds 1 for both White and Black families, with the Black leverage ratio indicating that their debts are nine times higher than their assets. This is likely the result of having few assets to begin with and being more likely to take on debt with larger average amounts. It is likely that these other debt burdens factor into student loan repayment decisions.
We look more closely at one particular form of debt: credit cards, which the majority of families of graduates hold. Table 4 below reports the credit card usage of families of college graduates aged 25-35 with student loan balances, since this is the age range over which repayments are typically made.
| Table 4: Credit Card Usage by Race for College Graduates Age 25-35 With Student Loan Balances In 2019 Dollars |
|||||
|---|---|---|---|---|---|
| Race | Mean Net Worth | Median Net Worth | % With Credit Card | Average Credit Limit Among Cardholders | Credit Card Balance |
| White | $146,350 | $48,844 | 92% | $24,423 | $4,852 |
| Black | $55,607 | $8,024 | 77% | $13,608 | $4,186 |
| Source: Survey of Consumer Finances | |||||
Using the SCF, we find that 92 percent of families where the respondent is White have a credit card, compared to 77 percent of Black families. White families have higher limits on their credit cards: $24,423, compared to $13,608 for Black families. Because the amount actually owed on these credit cards is comparable — $4,852 for White families and $4,186 for Black families — this provides another indication that that the latter are more highly leveraged.
Conclusion
Black college graduates who took out student loans are significantly more likely to default on them than their White counterparts. They are also more likely to be enrolled in income-based repayment plans rather than standard repayment plans. This is even though the two groups borrow comparable amounts to fund their undergraduate education. In ongoing work, we examine the role of financial circumstances in contributing to the Black-White gap in student loan default, including differences in earnings, wealth and credit terms.
Urvi Neelakantan is a senior policy economist in the Research Department at the Federal Reserve Bank of Richmond.
For details on repayment plan options, see my book chapter "Student Loan Borrowing and Repayment Decisions: Risks and Contingencies" — co-authored with Kartik Athreya, Christopher Herrington and Felicia Ionescu — from the Routledge Handbook of the Economics of Education.
To cite this Economic Brief, please use the following format: Neelakantan, Urvi. (April 2023) "Black-White Differences in Student Loan Default Rates Among College Graduates." Federal Reserve Bank of Richmond Economic Brief, No. 23-12.
This article may be photocopied or reprinted in its entirety. Please credit the authors, source, and the Federal Reserve Bank of Richmond and include the italicized statement below.
Views expressed in this article are those of the authors and not necessarily those of the Federal Reserve Bank of Richmond or the Federal Reserve System.
Receive a notification when Economic Brief is posted online.


