How Well Insured Are Older Americans?
Economic Brief
June 2023, No. 23-19
Using a combination of survey and administrative data, we calculate the portion of medical expenditures that retirees pay out of pocket. We find that retirees are mostly well insured against medical spending risk, with over 80 percent of their spending covered by Medicare, Medicaid or other insurers. We also find, however, that individuals with extremely high medical expenses pay a larger — not smaller — share out of pocket than those with more average expenses. Much of this difference is attributable to nursing home stays, which are typically uncovered by most insurers.
The principal health insurance provider for retired Americans is the U.S. government: Almost everyone 65 and older receives Medicare coverage,1 and many people also receive coverage from Medicaid, a means-tested program jointly funded by federal and state governments.
In this article, we examine the extent to which Medicare and Medicaid reduce retirees' medical spending, which we do by comparing the medical expenses retirees personally pay out of pocket to the total medical expenditures paid for their care. We consider not only the average share of medical spending picked up by Medicare and Medicaid but also its distribution: When medical expenditures are high or an individual's income is low, does the government's share of the total rise or fall?
We find that retirees are mostly well insured against medical spending risk, with over 80 percent of their expenses covered by Medicare, Medicaid or other insurers. We also find, however, that individuals with extremely high medical expenses pay a larger — not smaller — share out of pocket than those with more average expenses. Much of this difference is attributable to nursing home stays, which are not covered by Medicare.
Our Data
The data we use for our analysis come from a series of projects with our colleagues Karolos Arapakis, Eric French and Jeremy McCauley.2 They consist of detailed survey data from the Health and Retirement Study (HRS) linked to administrative Medicare and Medicaid records from the Centers for Medicare and Medicaid Services (CMS).
The HRS is a biennial dataset containing detailed information on older households' health, employment, income and wealth. While the HRS includes respondents' reports of their out-of-pocket spending, it does not contain accurate measures of medical spending by other payors. Fortunately, many HRS respondents have consented to their data being linked to CMS records. Although the HRS and CMS data together account for most of the retirees' medical spending, they lack information on a few remaining payors, including private insurance and smaller government programs such as the Veterans Administration and state or local health departments. We impute these payments using data from the Medical Expenditure Panel Survey.3 The end result is a novel panel dataset linking comprehensive medical spending data to the rich health and financial information found in the HRS.
Our sample consists of retirees who are 65 and older and spans the years 2000-2012. Although annual CMS records are available from 1999 to 2012, we restrict the data to HRS interview (that is, even) years to reduce the number of imputations.4 We are left with roughly 16,000 person-year observations. We measure all variables at the individual (rather than household) level and deflate expenditures to 2014 dollars.
Total and Out-of-Pocket Medical Spending
Table 1 summarizes our medical spending data. The first row of the table shows that the average retiree incurs $21,200 per year in total medical expenses. Of this, 55.3 percent is covered by Medicare, 13.8 percent by Medicaid, 11.5 percent by other insurers and 19.4 percent by the patients themselves (out of pocket). The remaining rows group individuals by total spending percentile. As is well known, medical spending is distributed very unevenly: Per-person spending in the top 5 percent of the distribution is over 40 times as large as that in the bottom 50 percent.
| Table 1: Medical Spending (2014 Dollars) by Total Expenditures and Payor | ||||||
| Total Spending Percentiles | Total Spending | Percentage Paid by | ||||
| Mean Spending | Percentage of Total | Out of Pocket | Medicare | Medicaid | Other | |
| All | $21,200 | 100.0% | 19.4% | 55.3% | 13.8% | 11.5% |
| 95-100% | $131,700 | 31.0% | 23.6% | 46.6% | 14.0% | 15.8% |
| 90-95% | $70,800 | 16.7% | 14.8% | 54.8% | 22.5% | 8.0% |
| 70-90% | $35,100 | 33.1% | 14.7% | 61.7% | 13.8% | 9.8% |
| 50-70% | $12,600 | 11.9% | 21.5% | 60.7% | 6.4% | 11.4% |
| 0-50% | $3,100 | 7.3% | 29.8% | 56.1% | 4.7% | 9.5% |
| Sources: Merged dataset and authors' calculations. Dataset combines data from the Health and Retirement Study, the Centers for Medicare and Medicaid Services and the Medical Expenditure Panel Study. | ||||||
The pattern of spending shares is perhaps more surprising, particularly the pattern for out-of-pocket spending, which can be seen both in the table and in Figure 1.
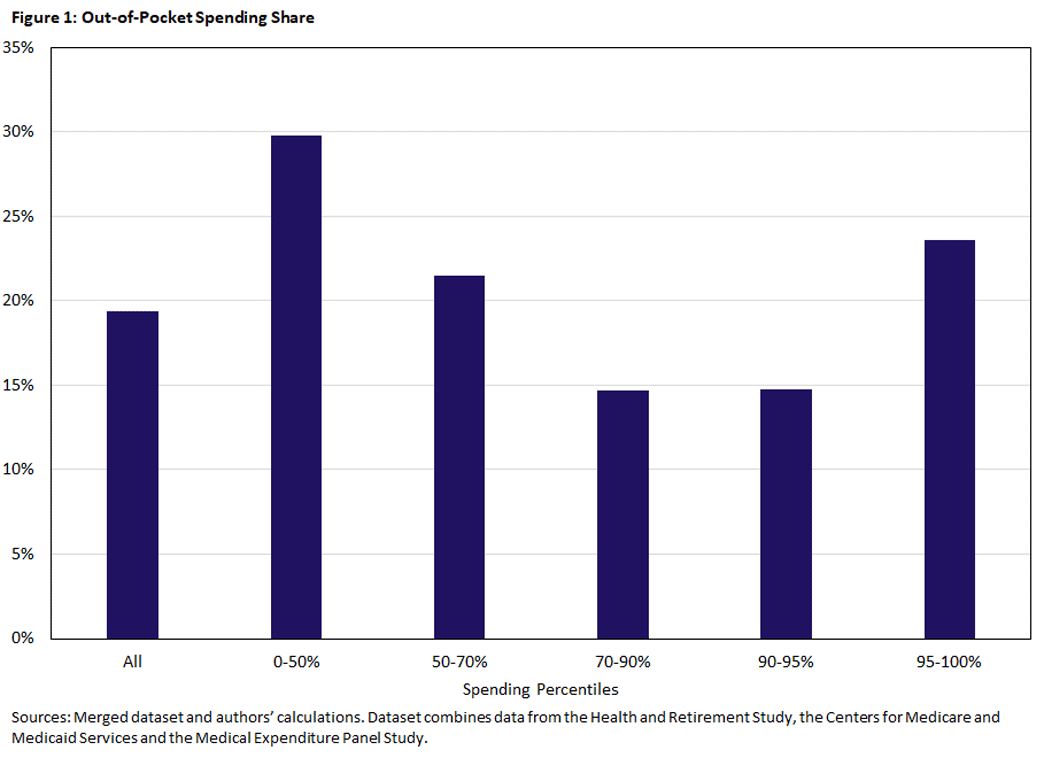
Although people in the bottom half of the spending distribution pay the highest proportion of their expenses out of pocket (29.8 percent), people in the top bin pay a substantially larger fraction out of pocket (23.6 percent) than those in the second and third highest bins (14.8 percent and 14.7 percent, respectively). In fact, their out-of-pocket share is higher than the overall average (19.4 percent). This is surprising because out-of-pocket shares that rise with total expenses will, all else equal, increase the spending risk faced by individuals, and risk reduction is a commonly stated goal of insurance.
One potential explanation for the pattern of spending shares found in Table 1 is income. High income people — who are less likely to qualify for Medicaid — will typically pay more of their medical expenses out of pocket. If they also purchase more medical services, we will see, all else equal, individuals with high medical expenses paying a larger fraction out of pocket.
A second potential explanation is long-term care (LTC) expenses. LTC is expensive, and Medicare covers only a limited portion. Medicaid does cover LTC, but it is available only to those with income and assets below the program's limits. This leaves LTC users facing high medical expenses that they may have to pay out of pocket.5 We will return to both hypotheses below.
Similar patterns to those found in Table 1 and Figure 1 appear in Figures 2a and 2b, which show how total and out-of-pocket spending vary by age.
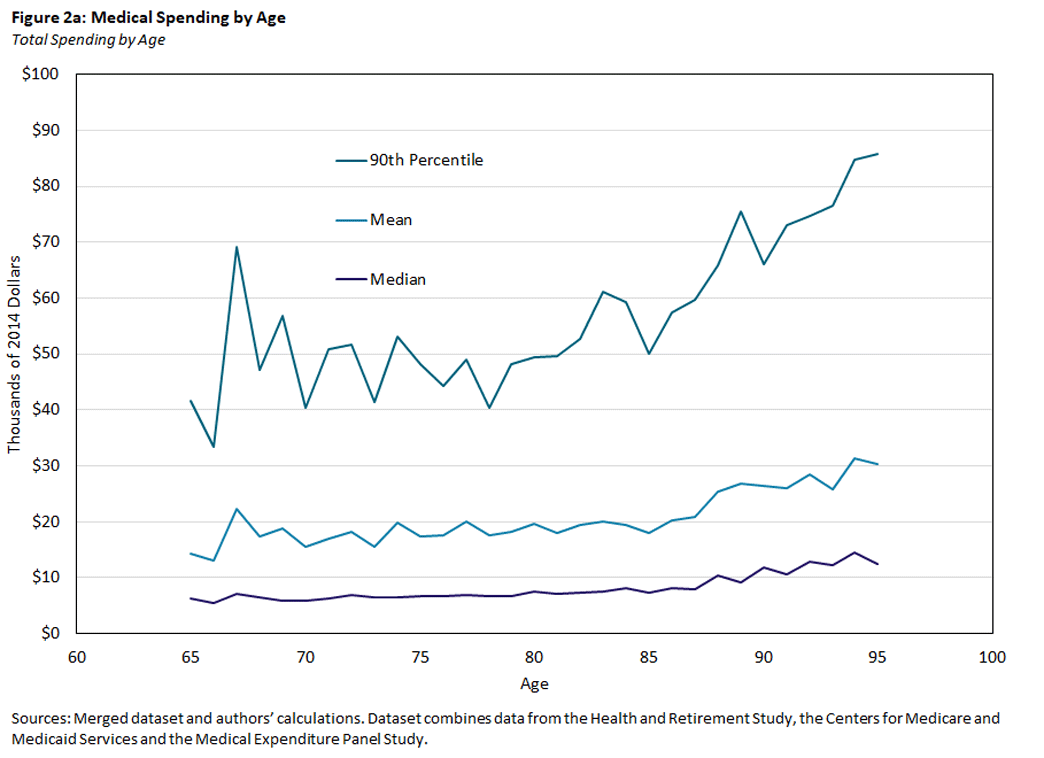
Figure 2a shows that total medical spending rises with age, with mean spending increasing from $14,000 at age 65 to over $30,000 at age 95. Even after controlling for age, however, medical spending remains very unevenly distributed. At any given age, both the mean and 90th percentile of total medical spending are substantially larger than the median.
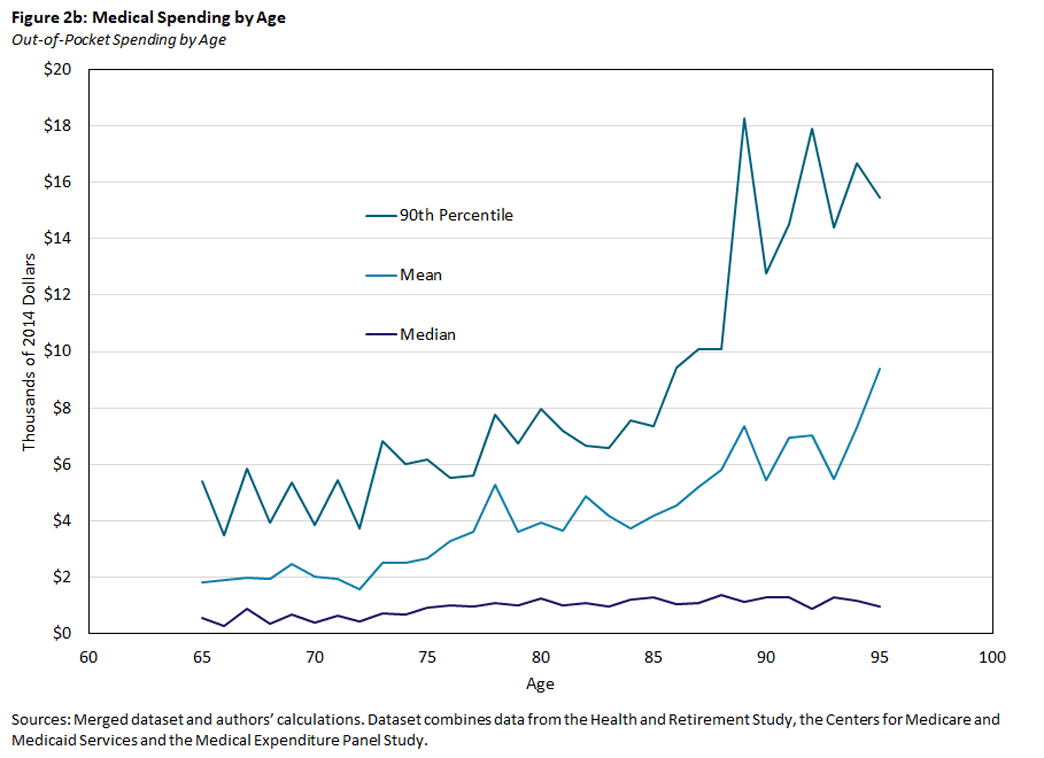
Figure 2b shows that out-of-pocket expenditures are modest for most individuals, with median spending equaling $560 at age 65 and $960 at age 95. As individuals get older, however, the likelihood of extremely high out-of-pocket expenditures rises rapidly. At age 95, 10 percent of individuals will spend $15,000 or more.
We examine the relationship between total and out-of-pocket medical spending more directly in Figure 3. To construct this graph, we calculate the ratio of out-of-pocket to total medical spending for each observation. We then sort observations by total medical spending, split them into 50 equally sized bins and find the mean, median and 90th percentile of the out-of-pocket ratios within each bin. This gives a sense of how the fraction of spending covered out-of-pocket changes with the total amount spent.
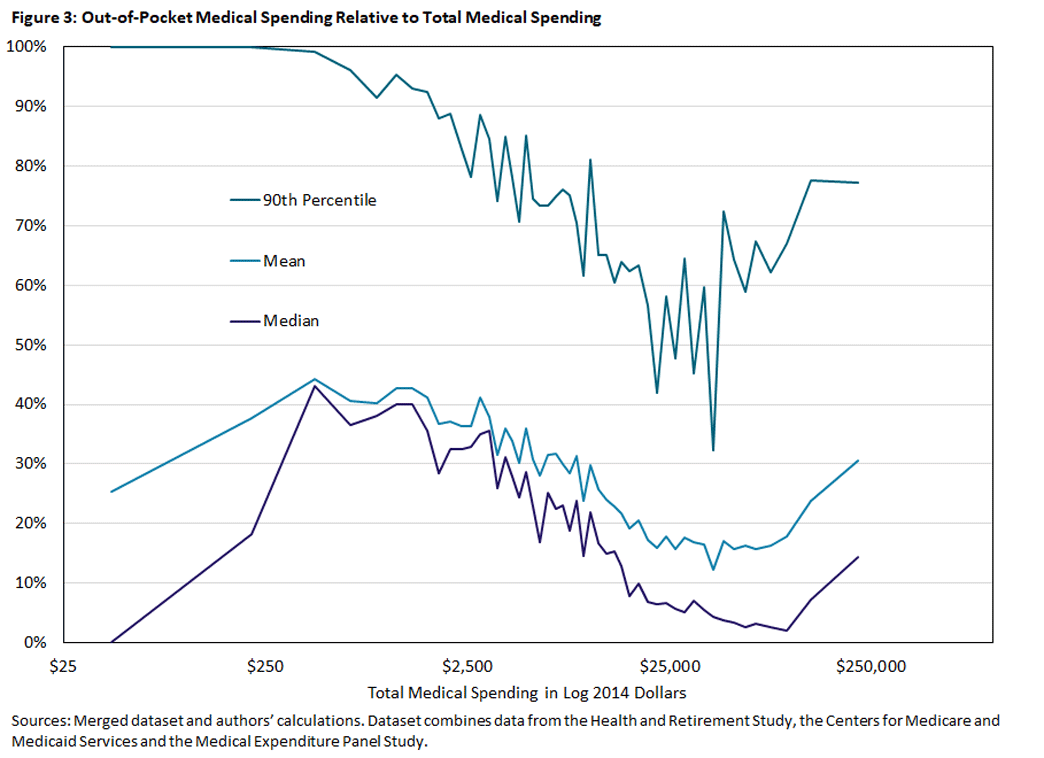
Figure 3 shows that the share paid out of pocket is, for the most part, decreasing in total spending until it reaches roughly $40,000. Above this point, the shares stop falling (or fall more slowly) and start to increase, especially as total spending exceeds $100,000. This suggests that retirees are not well insured against catastrophic medical expenses.
Medical Spending and Income
We next consider how medical spending varies with income. To do this, we construct a measure of lifetime earnings or permanent income (PI) based on pension and Social Security benefits and rank households by this measure.6 Table 2 shows how medical spending varies across PI quintiles.
| Table 2: Medical Spending (2014 Dollars) by Income Level and Payor | |||||
| PI Quintile | Total Spending | Percentage Paid by | |||
| Out of Pocket | Medicare | Medicaid | Other | ||
| All | $21,200 | 19.4% | 55.3% | 13.8% | 11.5% |
| Top | $19,700 | 27.5% | 56.1% | 2.8% | 13.5% |
| 4th | $19,500 | 26.2% | 53.9% | 5.1% | 14.9% |
| 3rd | $20,800 | 21.3% | 55.5% | 9.2% | 13.9% |
| 2nd | $21,800 | 15.2% | 55.7% | 19.7% | 9.4% |
| Bottom | $25,100 | 7.2% | 55.7% | 31.4% | 5.7% |
| Sources: Merged dataset and authors' calculations. Dataset combines data from the Health and Retirement Study, the Centers for Medicare and Medicaid Services and the Medical Expenditure Panel Study. | |||||
Individuals at the bottom PI quintile have the highest total expenditure ($25,100) but pay the smallest fraction out of pocket (7 percent). They rely instead on Medicaid, which covers over 31 percent of their expenditures, more than double the overall average of 14 percent.
In contrast, individuals in the top PI quintile pay 28 percent of their expenditures out of pocket, with Medicaid covering only about 3 percent. People in the top PI quintile also have some of the lowest total expenditures, reflecting the general tendency of higher income people to be in better health.
To the extent one can draw conclusions from quintile averages, Table 2 suggests that the high out-of-pocket spending associated with the largest medical expenditures, as shown in Table 1 and Figure 3, is not attributable to higher spending by the rich.
Nursing Homes
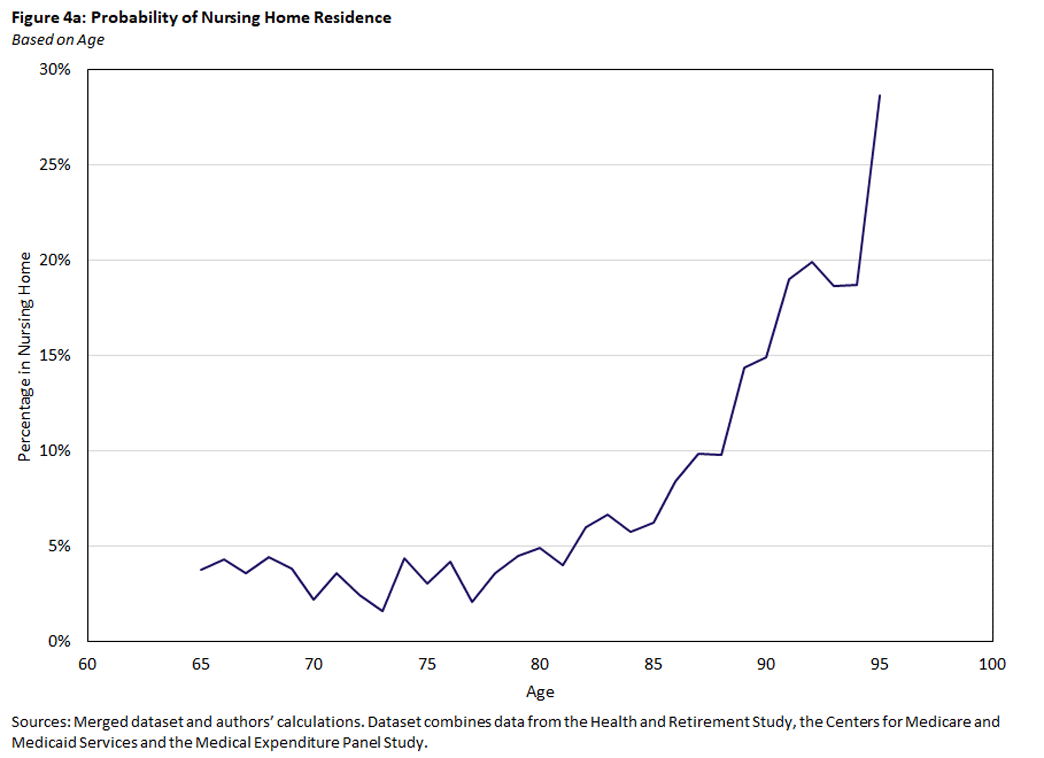
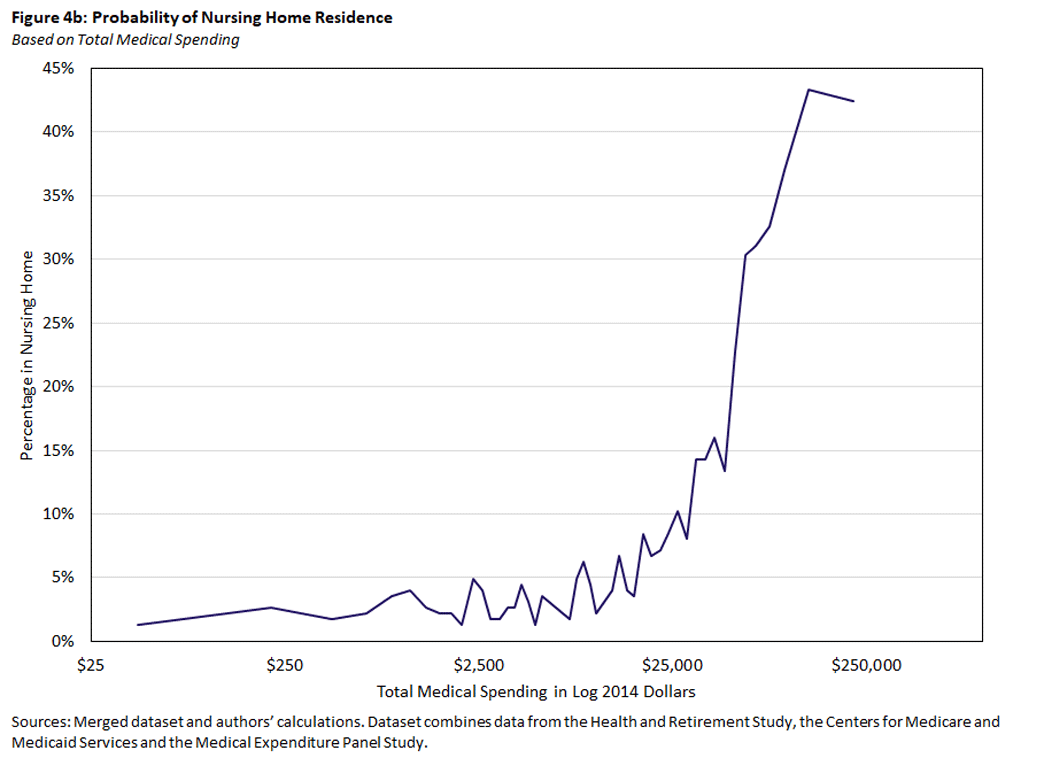
Another potential explanation for why individuals with the highest medical expenditures pay a larger fraction out of pocket is that high medical expenditures are associated with LTC, which is covered only minimally by Medicare. Figures 4a and 4b show how the probability of receiving nursing home care — defined as spending at least 60 days a year in a nursing home — varies with both age and total medical expenditures. Figure 4a shows that nursing home use rises with age in much the same way as medical spending, suggesting that nursing home use is linked to higher medical spending.
The association can be seen more clearly in Figure 4b, which shows that nursing home use increases dramatically with total spending, from about 4 percent for those spending $10,000 per year to 40 percent for those spending at least $100,000.
In Table 3, we repeat the analysis of Table 1 — grouping individuals by total spending and calculating payment shares within each group — for individuals who are not in a nursing home. Comparing Table 3 to Table 1 shows that the share paid out of pocket by the top 5 percent of spenders falls by over a third (from 23.6 percent to 15.2 percent) when nursing home residents are removed. The out-of-pocket share for the top spending group is now smaller than the overall average, rather than larger. Taken together, Table 3 and Figures 4a and 4b show that nursing home stays generate a substantial part of the out-of-pocket spending risk facing older households.
| Table 3: Medical Spending (2014 Dollars) by Total Expenditures and Payor, Nursing Home Residents Excluded | ||||||
| Total Spending Percentiles | Total Spending |
Percentage Paid by | ||||
| Mean Spending | Percentage of Total | Out of Pocket | Medicare | Medicaid | Other | |
| All | $17,400 | 100.0% | 16.0% | 62.9% | 8.9% | 12.2% |
| 95-100% | $112,300 | 32.3% | 15.2% | 60.3% | 9.2% | 15.3% |
| 90-95% | $56,200 | 16.2% | 9.9% | 69.7% | 10.6% | 9.8% |
| 70-90% | $27,300 | 31.4% | 13.2% | 65.4% | 10.0% | 11.4% |
| 50-70% | $10,500 | 12.1% | 23.5% | 59.4% | 5.9% | 11.3% |
| 0-50% | $2,800 | 8.0% | 30.6% | 55.7% | 4.7% | 9.0% |
| Sources: Merged dataset and authors' calculations. Dataset combines data from the Health and Retirement Study, the Centers for Medicare and Medicaid Services and the Medical Expenditure Panel Study. | ||||||
Conclusion
Using a combination of survey and administrative data, we assess the extent to which the medical expenses of retirees are covered by public and private insurance. Retirees are for the most part well insured against medical spending risk, with over three-quarters of their spending reimbursed by Medicare, Medicaid or other insurers.
On the other hand, individuals with extremely high total medical expenses pay a larger share out of pocket than many of those with lower expenses. Much of this is attributable to LTC, especially nursing home stays, which are not covered by Medicare. Medicaid does cover LTC expenses, but only for those who either enter retirement with few financial resources or exhaust their resources paying for LTC.
Even though the latter provision provides higher-income households with valuable backstop insurance, it still leaves much of their wealth vulnerable to catastrophic LTC expenses. It is hardly surprising that the financial implications of LTC expenses, and the strategies for insuring against them, are an area of active research.7
Erin Henry is a research associate, John Bailey Jones is vice president of microeconomic analysis, and Pauline Sow is a research associate in the Research Department of the Federal Reserve Bank of Richmond.
1
Many Medicare recipients have their coverage administered by private providers through the Medicare Advantage program, a voucher-style system. As noted in "Medicare Advantage in 2022: Enrollment Update and Key Trends," Medicare Advantage enrollment has increased steadily over time, from 19 percent of beneficiaries in 2007 to 48 percent in 2022.
2
Arapakis is affiliated with the Center for Retirement Research at the Boston College; French is affiliated with the University of Cambridge, the IFS and CEPR; and McCauley is affiliated with the University of Bristol. The papers produced by this team include "On the Distribution and Dynamics of Medical Expenditure among the Elderly" and "How Redistributive Are Public Health Care Schemes? Evidence from Medicare and Medicaid in Old Age." In addition to sharing their research, we are grateful to them for helpful comments on this article.
3
Details of our imputation process can be found in the papers listed in footnote 2.
4
We also drop individuals enrolled in Medicare part C, whose payments we would also have to impute.
5
A more detailed discussion of how LTC is funded can be found in the 2022 paper "How Should We Fund End-of-Life Care in the U.S.?"
6
Descriptions of our PI measure can be found in the papers listed in footnote 2. An important feature of our measure is that it is constructed at the household level, which allows it to account for spousal and survivor benefits.
7
A recent review of these topics can be found in the 2022 working paper "Savings After Retirement."
To cite this Economic Brief, please use the following format: Henry, Erin; Jones, John Bailey; and Sow, Pauline. (June 2023) "How Well Insured Are Older Americans?" Federal Reserve Bank of Richmond Economic Brief, No. 23-19.
This article may be photocopied or reprinted in its entirety. Please credit the authors, source, and the Federal Reserve Bank of Richmond and include the italicized statement below.
Views expressed in this article are those of the authors and not necessarily those of the Federal Reserve Bank of Richmond or the Federal Reserve System.
Subscribe to Economic Brief
Receive a notification when Economic Brief is posted online.
Contact Us