Are Younger Generations of Women Prepared for Retirement?
We describe changes in the financial circumstances of women over time, focusing on employment, income and wealth. Beginning with the 1920 birth cohort, we show that women's income grew for several successive cohorts, then entered a period of stability. However, there has been no such growth in wealth. This suggests that younger generations of women may not be any better prepared for retirement than their predecessors.
The social and economic circumstances of women have changed dramatically over the past 50 years, as women have increased their educational attainment, employment and earnings.1 Over the same period, marriage rates have declined, and an increasing fraction of women have never married. Moreover, more recent retirees can expect to live longer and wait longer to receive their full Social Security benefits. All of these changes should affect when women choose to retire and how much wealth they accumulate to fund their retirements.
In this article, we present some descriptive evidence on how the financial circumstances of women have changed over time. In doing so, we distinguish between Black and White women, whose economic circumstances remain far apart even as they have trended in similar directions.
We focus on two of many possible indicators of women's financial circumstances. The first is the total income of a woman's family adjusted for family size. We look at women's income during their working life (which can be saved for their retirement) and their income after retirement (which includes Social Security benefits). The second measure is household wealth, or the value of their financial and physical assets less any outstanding debt.
We observe a substantial rise in women's income for successive cohorts born between 1920 and 1949, followed by a period of relatively little change. However, there has not been a similar increase in wealth, suggesting that younger generations of women are not better prepared for retirement.2
Setting the Stage: Trends in Employment, Marriage and Life Expectancy
The first trend that motivates this article is in women's employment: The general trend has been that women are increasingly likely to be employed, but the gains for some cohorts have been larger than for others, and employment rates also vary with age and race.
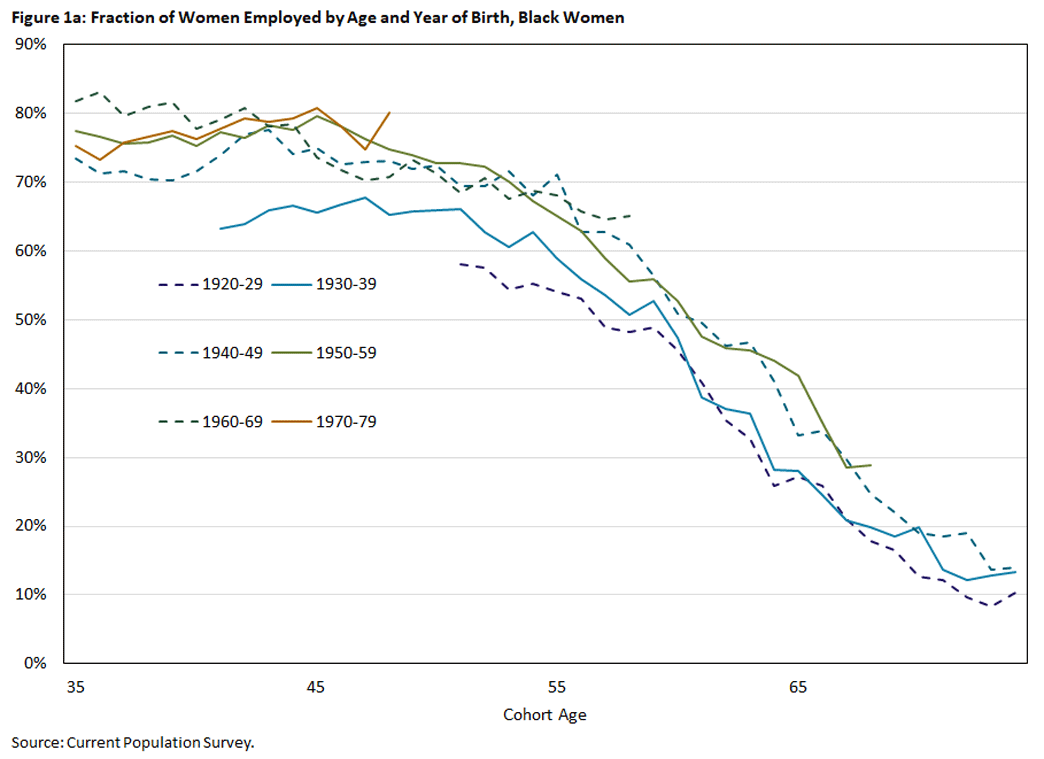
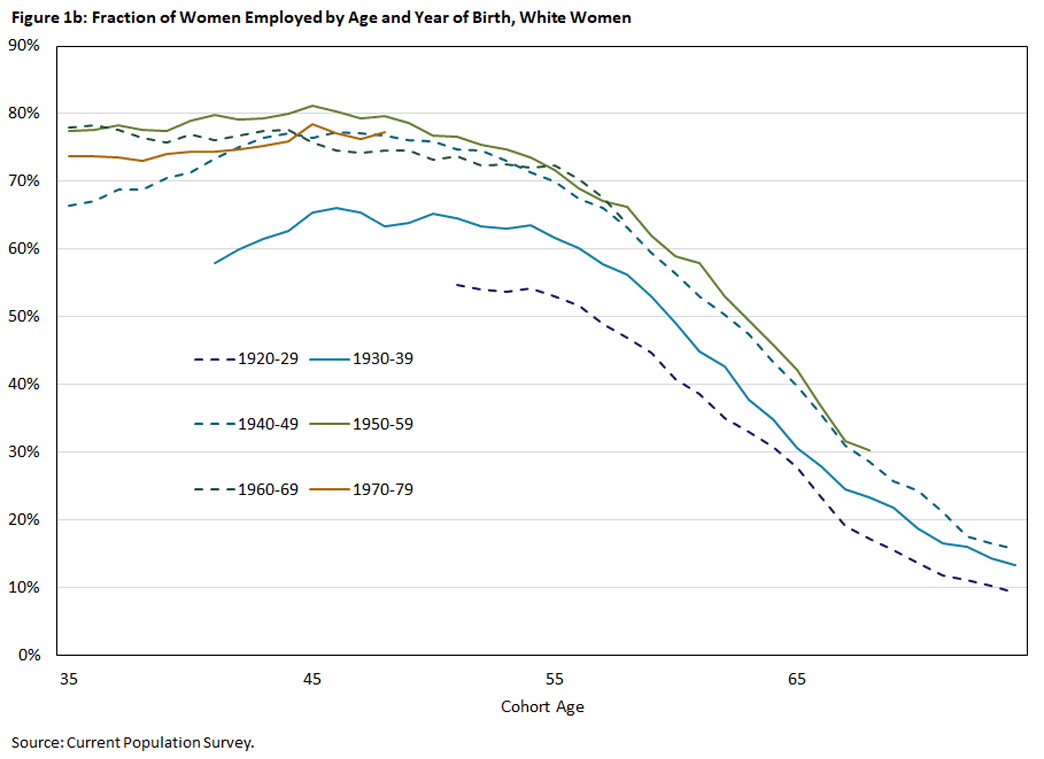
Figure 1 provides the details, using data from the March supplement of the Current Population Survey for the years 1976-2023.3 Each line tracks a particular cohort as it ages. For example, the purple line shows employment for women born between 1920 and 1929, while the brown line shows employment for women born 50 years later, between 1970 and 1979. Data points are indexed along the x-axis by "cohort age," defined as the calendar year less the cohort's "average" year of birth (1925 for the oldest cohort, 1935 for the second oldest, and so on).
Setting the Stage: The Role of Marriage
Figure 1 shows that women born in the 1930s were more likely to be employed than those born in the 1920s, and women born in the 1940s were even more likely to be employed. The cohorts that followed, however, saw considerably smaller employment gains. A notable exception — across cohorts — is women in their 30s, whose labor force participation continued to rise, probably because they reduced the amount of time they spent out of the labor force after giving birth.4 Among younger cohorts, around 70 percent of women aged 35-50 work, with employment declining steadily thereafter. Although small sample sizes prevent us from drawing clear cut implications, the trends for Black women are similar.
At the same time that women have become more likely to be employed, they have also become less likely to be married. For example, using calculations similar to those in Figure 1, we find that 80 percent of White women born in the 1940s were married at age 35, while only 70 percent of White women born in the 1970s were married at the same age. The marriage rates of Black women have historically been lower than those for White women, but they show a similar drop: 50 percent of Black women born in the 1940s were married at age 35, compared to 40 percent of those born in the 1970s.
In addition to being increasingly less likely to be married at any given age, younger cohorts of women are increasingly likely to have never been married. For example, while less than 10 percent of Black women born in the 1920s and 1930s had never married by age 50, about one-third of Black women born in the 1970s had not.
Another trend salient to retirement preparation is an increase in life expectancy. Data from the Center for Disease Control and Prevention show that the life expectancy for White women at age 65 has risen from 15 years in 1950 to 20 years in 2022.5 Black women have a shorter life expectancies than White women: Although much of the racial disparity in mortality is realized at younger ages, the gap in life expectancy at age 65 is still around one year.
Trends in Financial Resources: Income
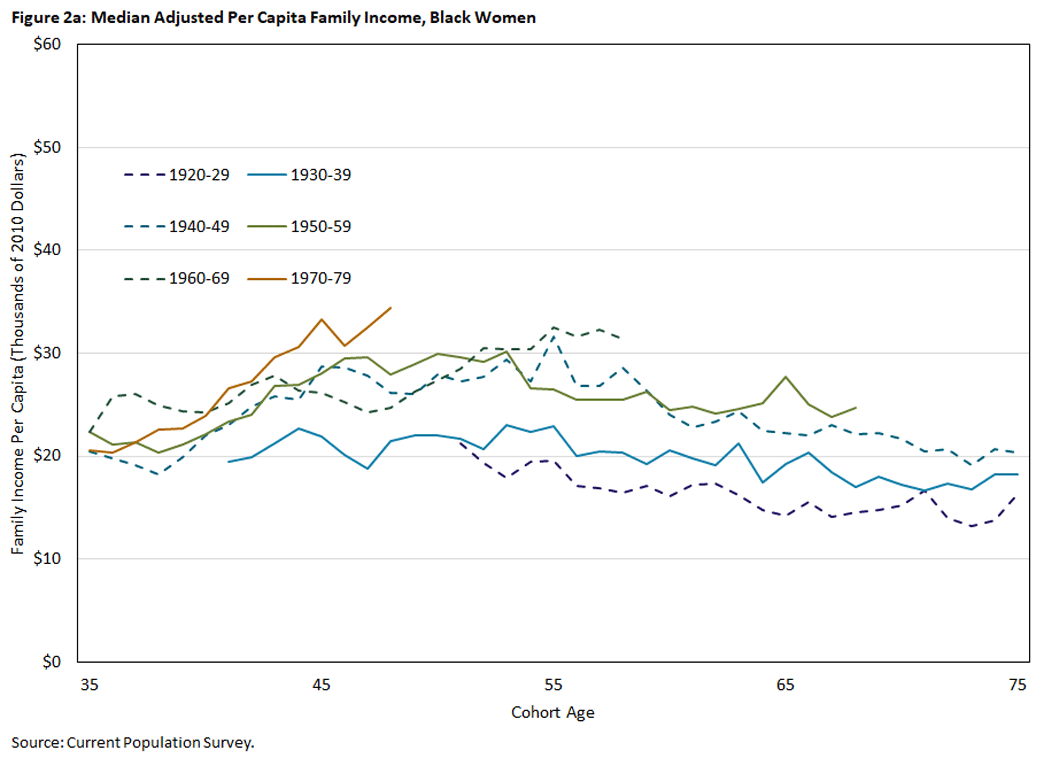
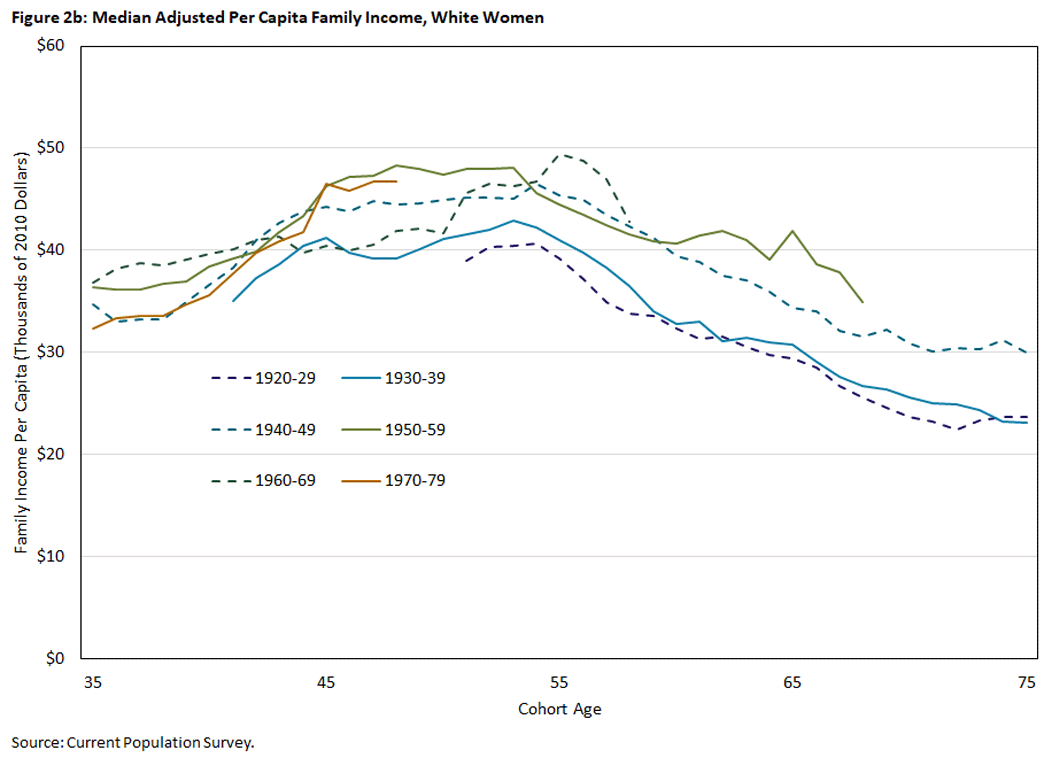
Because married households often pool their resources, and because larger households enjoy scale efficiencies in consumption (such as shared appliances), our preferred measure of income is total family income divided by the square root of the number of family members.6 Figure 2 shows that the trends for median adjusted family income mirror those for employment: growth for the cohorts born between the 1920s and 1940s, followed by near stagnation. The gains for Black women appear a little larger in relative terms, but the median incomes of White women remain considerably higher.
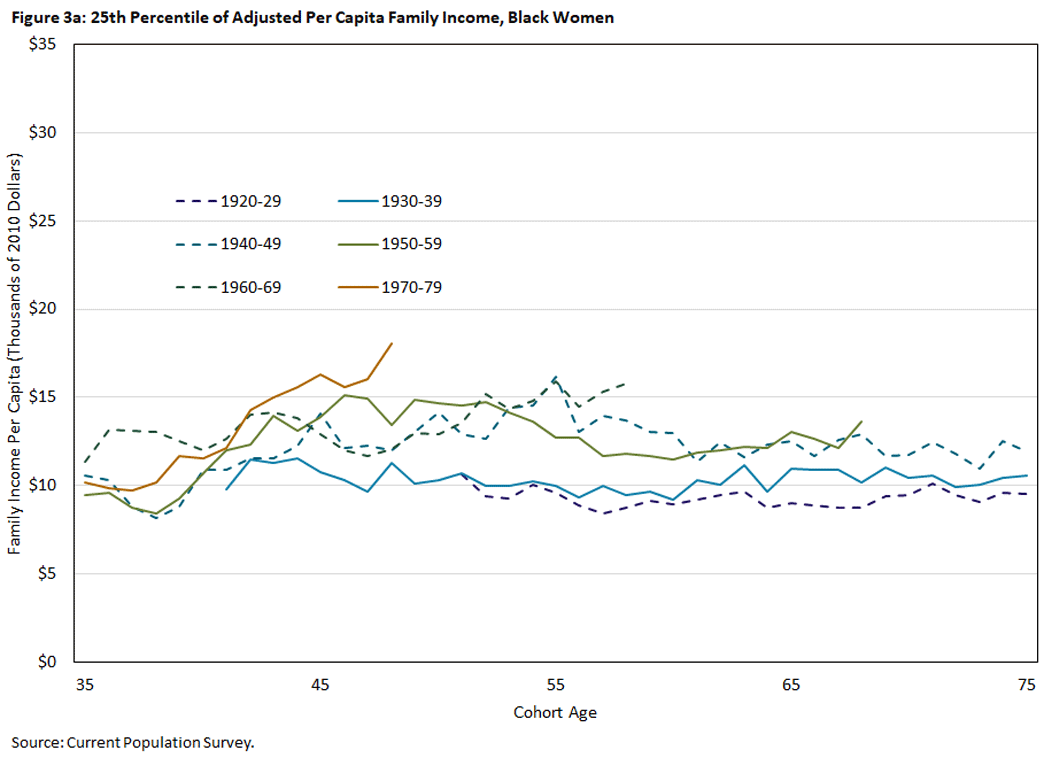
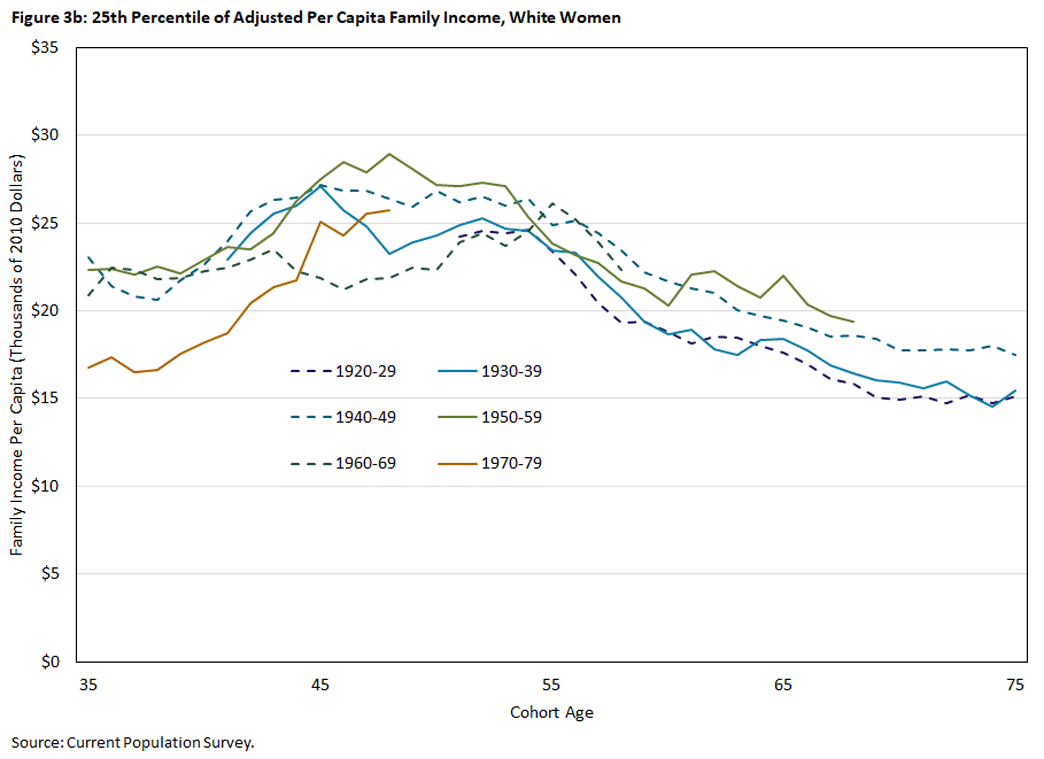
Because income inequality has generally widened over time,7 the experiences of women at the bottom of the income distribution may not resemble those of women at the middle or top. Figure 3 presents the 25th percentile of family income. Among Black women, the time trends of income at the 25th percentile are similar to those at the median. However, the income of White women born in the 1970s drops considerably more at the 25th percentile than at the median, a consequence of the Great Recession.8
As individuals pass through their 60s, their income becomes increasingly composed of Social Security and other pension benefits. For older cohorts, income at ages 65-75 shows the same trend as income at younger ages.
However, for individuals born in the 1960s and 1970s, who are just beginning to reach their 60s, the stagnation in working-age income (if predictive) does not bode well for retirement finances. The increasing unsustainability of the current Social Security system poses an additional, substantial risk. Social Security benefits for younger cohorts have already fallen because of the gradual increase of the full retirement age to 67. Social Security's trust fund is nonetheless expected to run out in 2033 under present legislation, at which point Social Security's dedicated revenue sources can cover only 79 percent of expected benefits.9 Given that many combinations of tax increases and benefit cuts could restore balance to the system, political as well as economic factors will come into play.
Trends in Financial Resources: Wealth
To examine women's wealth, we turn to the Health and Retirement Study, a longitudinal dataset of older households. We use data for the years 1998-2020. A thorny data question in wealth comparisons is the treatment of couples' wealth, as most married households lose a spouse and then leave much — although far from all — of their wealth to the survivor.10 We address this issue by showing two sets of trajectories. In the first set, we sort women by their marital status around age 60 and track age-60 singles and couples separately. For these comparisons, we measure wealth at the household level, with no adjustment for household size. Our second approach is to scale couples' wealth as we scaled family income and present results for singles and couples together.
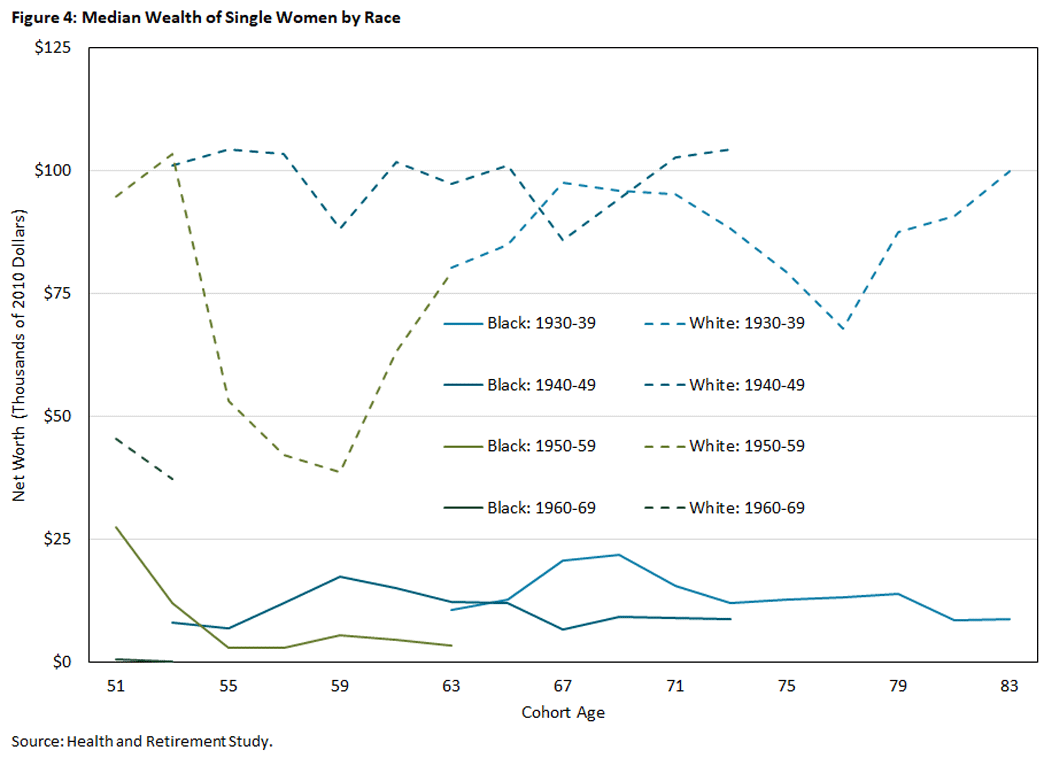
Figure 4 shows median wealth for women who were single at age 60. For these women, wealth remains relatively stable across cohorts although, within each cohort, there is a lot of variation across age. Overall, however, younger cohorts hold no more wealth than older ones at similar ages, and individuals born in the 1960s seem a bit poorer.
Another striking observation is the racial wealth gap. While median wealth for single White women is around $100,000, the median for Black women is close to zero. This gap would shrink considerably if we added the asset value of expected Social Security benefits to the total, but it would still be large.11
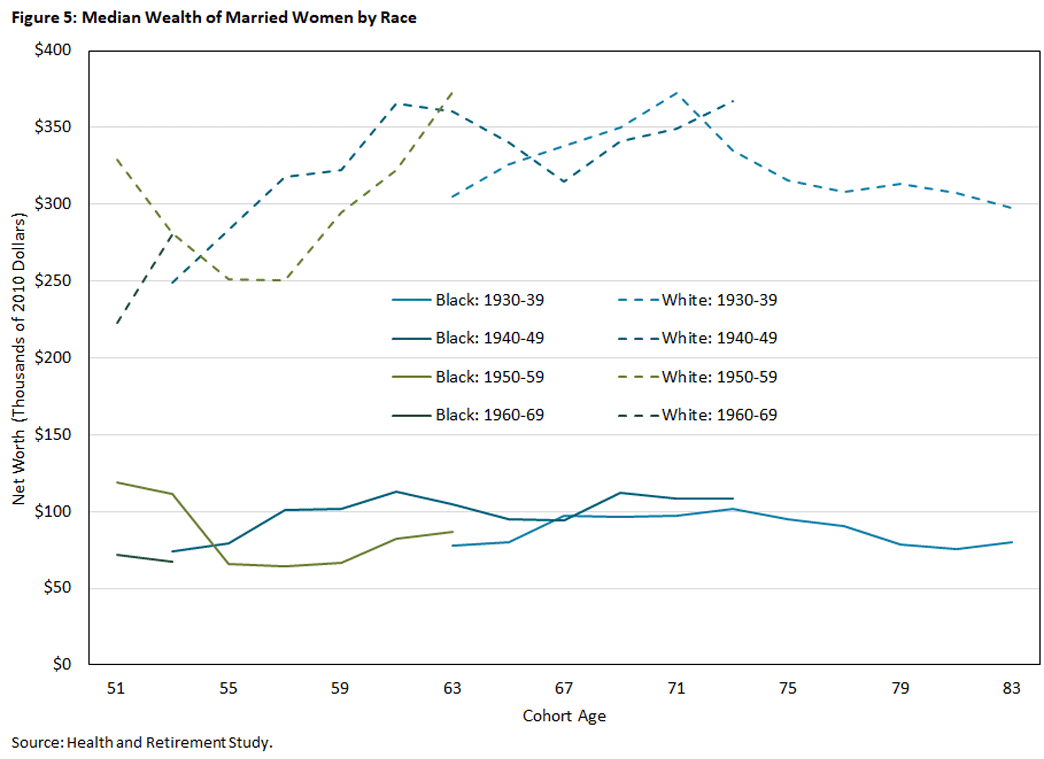
Figure 5 shows the corresponding trajectories for married women. Married women are considerably wealthier, and their wealth varies more over time as home values and stock prices rise and fall.
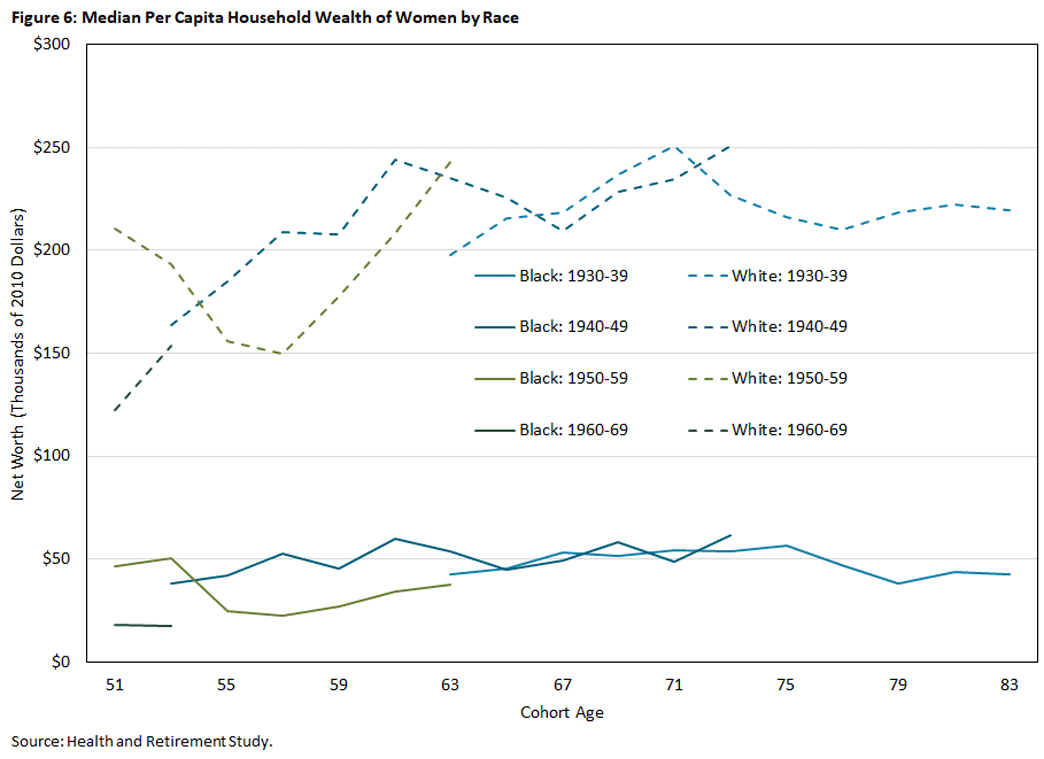
While Figures 4 and 5 facilitate comparison, they do not take into account the ongoing decline in marriage rates. This decline means that there are more age-60 singles over time, so that the characteristics of the unmarried — income, education and so on — are changing. We address these concerns with Figure 6, where we divide couples' wealth by the square root of two and combine single and married women into a single sample. Here too the data suggest that, if anything, younger generations hold less wealth than older ones.
Interpretation
The saving and labor supply decisions of a country's residents have broad economic implications, making the analysis of these decisions vital to assessing — and potentially foreseeing — their effects on the economy. The changes described above have transformed both the environment within which women make economic decisions and the ways in which their decisions affect the broader economy. Thus, even though many researchers have studied these topics,12 we believe that regularly reexamining how and why women work and save is essential.
Among women born between 1920 and 1949, family income is higher for those born in more recent years at almost every age. Since 1949, however, this upward trend has slowed considerably, and it may even have reversed for the 1970s birth cohort.
Moreover, the increases in women's income that have occurred have not translated into increases in wealth at the time of retirement, despite an ongoing increase in life expectancy. This may reflect decreases in saving, higher debt at the beginning of adulthood or still other impediments to wealth accumulation, all interacting with the complex decisions about family and finances that each generation of women must make.
Younger generations may anticipate receiving higher Social Security benefits because of higher lifetime earnings. However, declining marriage rates mean that younger women with low earnings are less likely to be eligible for Social Security's spousal or survivors' benefits, which might have been higher than the benefits implied by their own earnings. It is also the younger generations — who are still paying taxes and have yet to receive any benefits — who are most likely to bear the cost of future reforms to the Social Security system.
In short, although younger generations of women are working more, current trends suggest that their retirement preparedness merits a closer examination. Standard economic logic suggests that the financial outcomes described in this article reflect optimizing behavior. A full economic analysis could therefore uncover additional considerations — financial or other — showing that younger women are in fact doing well.13 We are focused on this topic in our ongoing research.
John Bailey Jones is a vice president and economist in the Research Department of the Federal Reserve Bank of Richmond, Yue Li is an associate professor of economics at the University at Albany, State University of New York, and Urvi Neelakantan is a senior policy economist in the Research Department of the Federal Reserve Bank of Richmond.
These changes have been discussed by multiple authors. An extremely readable summary can be found in the 2022 article "After 50 Years of Progress, How Prepared are Women for Retirement?" by Alicia Munnell, Siyan Liu and Laura Quinby.
Although it is possible that any shortfall in net worth could be offset by higher Social Security benefits, we view a complete offset as unlikely.
Sarah Flood, Miriam King, Renae Rodgers, Steven Ruggles, J. Robert Warren, Daniel Backman, Annie Chen, Grace Cooper, Stephanie Richards, Megan Schouweiler, and Michael Westberry. IPUMS CPS: Version 11.0 [dataset]. Minneapolis, MN: IPUMS, 2023. https://doi.org/10.18128/D030.V11.0.
See, for example, the 2008 paper "Explaining Changes in Female Labor Supply in a Life-Cycle Model" by Orazio Attanasio, Hamish Low and Virginia Sanchez-Marcos.
These data come from multiple sources, including "Health, United States," life tables for 2018-2021, and the 2022 provisional estimates. Data for 2006 forward are for non-Hispanic White and Black individuals, while earlier data include Hispanic people.
Using the square root is a common way to account for economies of scale and is one of the equivalence scales used by the Organization for Economic Cooperation and Development (PDF).
See, for example, the 2023 paper "More Unequal We Stand? Inequality Dynamics in the United States, 1967–2021" by Jonathan Heathcote, Fabrizio Perri, Giovanni Violante and Lichen Zhang.
The previously cited paper "More Unequal We Stand?" likewise emphasizes the importance of cyclical fluctuations for income below the median.
The 2024 Old-Age, Survivors and Disability Insurance (OASDI) Trustees Report states that under intermediate assumptions, "The OASI Trust Fund reserves are projected to become depleted in 2033, at which time OASI income would be sufficient to pay 79 percent of OASI scheduled benefits."
See the 2021 working paper "Why Do Couples and Singles Save During Retirement? Household Heterogeneity and its Aggregate Implications" by Mariacristina De Nardi, Eric French, John Bailey Jones and Rory McGee.
See the 2021 paper "A New Look at Racial Disparities Using a More Comprehensive Wealth Measure." Our measure of net worth is the net value of total wealth, the most comprehensive one available in the HRS.
Surveys of saving include the 2001 paper "The Life-Cycle Model of Consumption and Saving" by Martin Browning and Thomas Crossley and the 2023 paper "Why Do Retired Households Draw Down Their Wealth So Slowly?" by Eric French, John Bailey Jones and Rory McGee. Surveys of retirement include the 2016 book chapter "Retirement Incentives and Labor Supply." by Richard Blundell, Eric French and Gemma Tetlow. A recent paper of note is the 2022 paper "Are Marriage-Related Taxes and Social Security Benefits Holding Back Female Labour Supply?" by Margherita Borella, Mariacristina De Nardi and Fang Yang.
A well-known study of this sort is the 2006 paper "Are Americans Saving ‘Optimally’ for Retirement?" by John Karl Scholz, Ananth Seshadri and Surachai Khitatrakun.
To cite this Economic Brief, please use the following format: Jones, John Bailey; Li, Yue; and Neelakantan, Urvi. (May 2024) "Are Younger Generations of Women Prepared for Retirement?" Federal Reserve Bank of Richmond Economic Brief, No. 24-17.
This article may be photocopied or reprinted in its entirety. Please credit the authors, source, and the Federal Reserve Bank of Richmond and include the italicized statement below.
Views expressed in this article are those of the authors and not necessarily those of the Federal Reserve Bank of Richmond or the Federal Reserve System.
Receive a notification when Economic Brief is posted online.


