Tracking College Tuition Growth
Previous research analyzed the rapid tuition growth that occurred from the late 1980s to 2010. That research indicates that several key factors drove the rise in college tuition: large expansions in the federal student loan program, a dramatic increase in the college-earnings premium, steady increases in average parental income, and state support of public schools that did not keep pace with tuition. Where that analysis stops, this analysis begins, showing that tuition growth slowed markedly from 2010 to 2022. We highlight several factors contributing to this pivot, interpreting those factors in light of our previous findings. Slower income growth, the flattening of the college-earnings premium, a rise in remote learning, a reduction in Pell grant awards and a de facto freeze on nominal federal student loan limits have all worked towards reducing tuition growth. However, tuition growth has been supported by rising foreign enrollment and the higher uptake of income-driven repayment plans.
In a collection of papers,1 two of the authors of this article (Grey and Aaron) have investigated the response of college tuition to various factors. The analysis in two of the papers stops in 2010 before the financial crisis hit colleges in earnest and before a precipitous rise in foreign students, while a third paper holds government programs fixed to consider the effects of productivity growth and skill-biased technological progress as secular drivers of tuition. In this article, we complement this research by looking at a more recent period, examining how tuition and factors affecting it have evolved over the past decade.
We will focus on a few factors that we have found to be important in driving tuition, as well as some new factors that weren't relevant before 2010 (when the original analysis ends). Previously highlighted factors include federal student aid programs for students, direct federal and state support of schools, and macroeconomic trends affecting the demand for college (namely, changes in college-earnings premia and parental income growth). The new factors include the rise of various income-driven repayment (IDR) programs, substantial growth in nonresident enrollment and the rise of distance-based learning.
Recent Tuition Growth
There are two common measures of tuition: sticker price and net. Sticker price is the tuition a school publishes as its annual tuition, even though many students do not pay this full amount. Net tuition is sticker less institutional aid that offsets the amount that students and their families owe. Thus, net tuition is the effective price of college, which will be our focus.
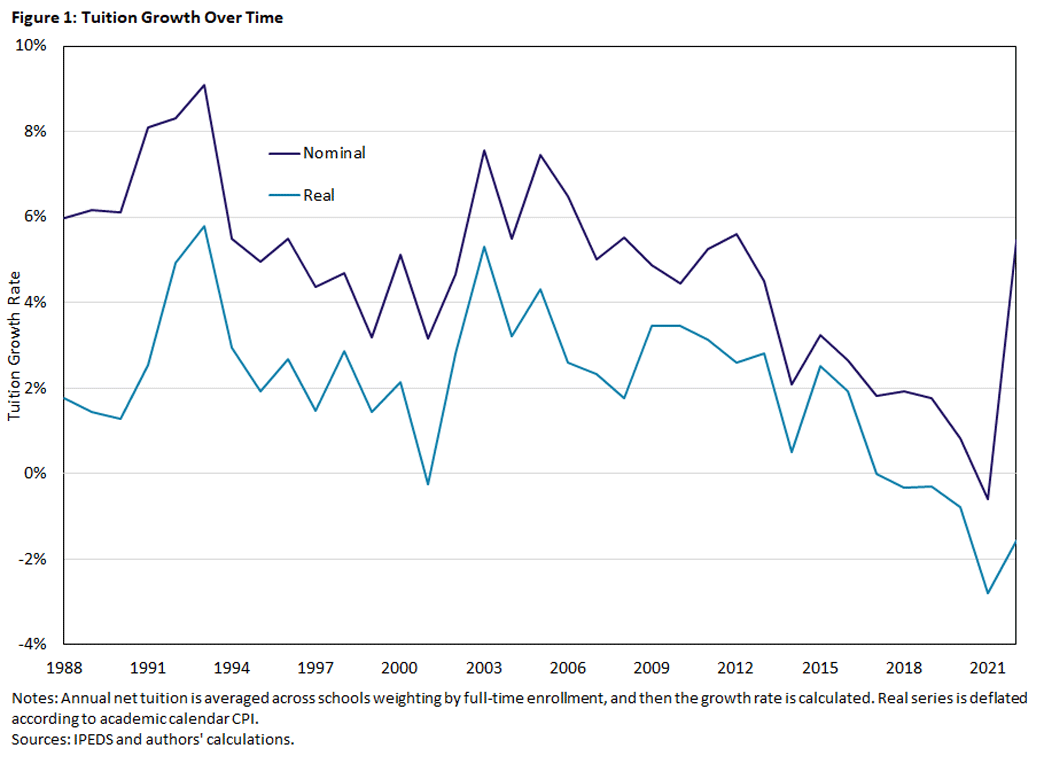
As shown in Figure 1, our calculations show that average nominal net tuition increases in the U.S. have slowed, with the annual growth rate falling from an average of 5.6 percent between 2005 and 2010 to an average of a meager 2.0 percent from 2016 to 2022. Real net tuition growth rates have fallen even more precipitously: from 3.0 percent (2005-2010) to -0.6 percent (2016-2022). We are not alone in this finding, as the National Center for Education Statistics has also found that real tuition growth rates have become negative in recent years.2
There are a wide variety of potential factors on both sides of the market — students and their families on the demand side, colleges on the supply side — that influence the change in growth rates. By isolating these factors and carefully examining each trend, policymakers can identify those that more closely correlate with tuition rates and develop sound plans to advance quality college access and affordability.
Financial Aid to Students and Families
Student Loans
The financial aid landscape is a natural place to begin, where students receive assistance through both grants and loans.3 Regarding loans, the maximum borrowing limits for federal student loans have not changed in nominal terms since 2008 (as shown in Table 1), but inflation has eroded the real value (that is, purchasing power) of those limits over time. In 2022, the maximum borrowing limits were $23,000 for subsidized loans and $40,805 for unsubsidized loans, a decrease in real dollars of about $7,000 and $12,000, respectively, since 2010. Our previous research, as well as references we cite in those works, has shown a significant causal link between financial aid and college tuition. So, the flat nominal (and declining real) borrowing power has stymied tuition growth.
| Years | Loan Limit |
|---|---|
| 1981-1987 | $12,500 |
| 1988-1991 | $17,250 |
| 1992-1993 | $23,000 |
| 1994-2007 | $23,000 subsidized, $31,510 unsubsidized |
| 2008-present | $23,000 subsidized, $40,805 unsubsidized |
| Source: Borrowing limits through 2010 are from the 2019 book chapter "Accounting for the Rise in College Tuition" and the 2022 report "Federal Undergraduate Loan Limits and Inflation" by Jason Delisle and Kristin Blagg. | |
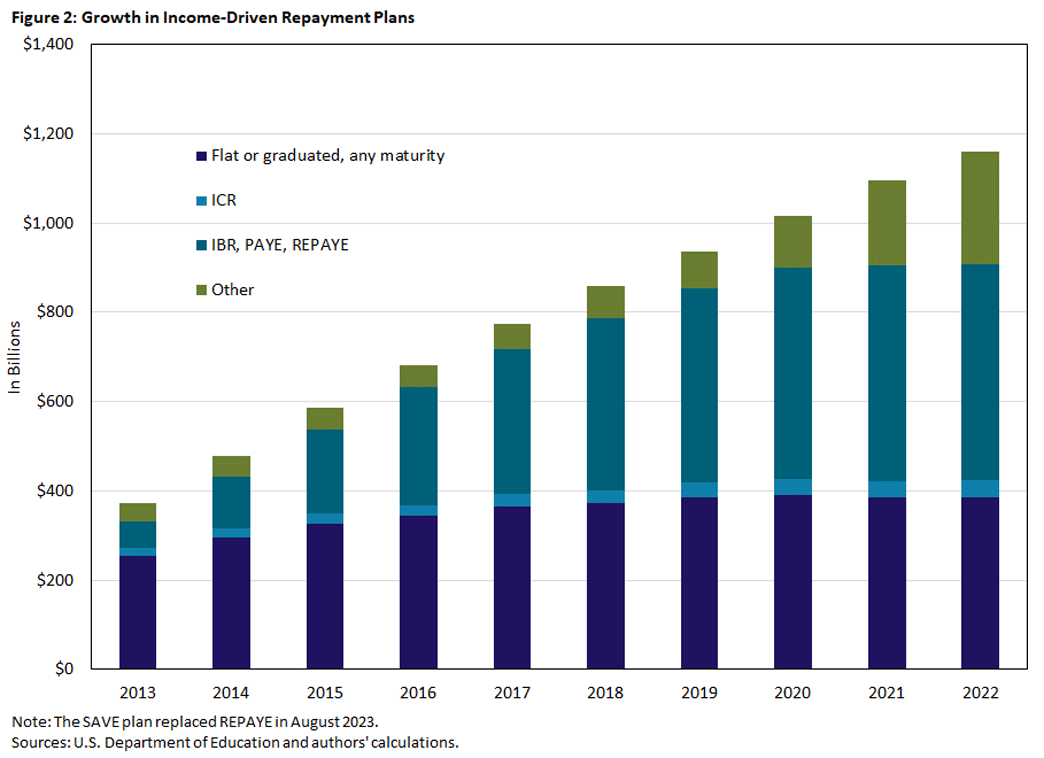
While having nominally flat traditional loan limits for 15 years has restrained tuition inflation, growth of IDR plans has been massive, as Figure 2 indicates.4 These programs — which tie repayments to a borrower's income and also allow for eventual debt forgiveness — have exploded in popularity in recent years while traditional loans have stalled.
This trend is notable because many IDR borrowers will end up paying back less than they would ordinarily have owed, implying a substantial taxpayer subsidy. Fair-value estimates in the 2020 report "Income-Driven Repayment Plans for Student Loans: Budgetary Costs and Policy Options" indicate the subsidy rate is close to 43 percent.5 Thus, even though borrowing limits have stalled in recent years, the generosity of student loans has expanded considerably on the back end, thus acting as a possible driver of tuition increases.
Student Grants
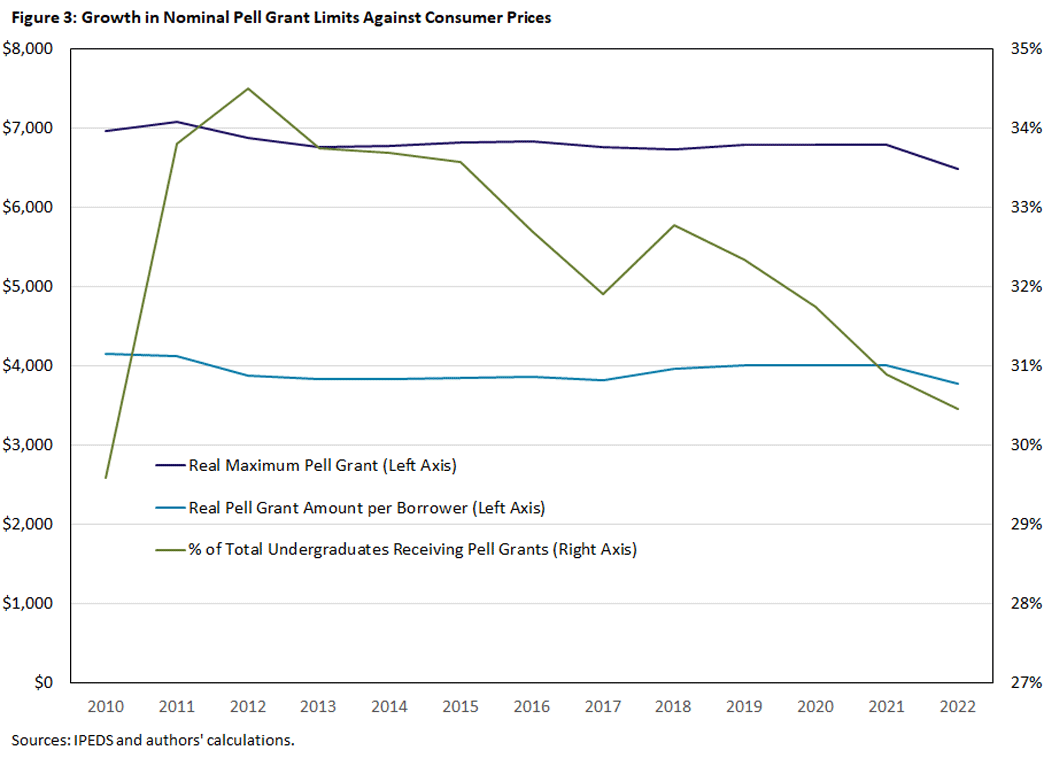
Shifting focus from loans to grants, the maximum Pell grant award has increased substantially since 2010. Despite this increase in the maximum, overall Pell grant awards have fallen since 2010, both in terms of the percentage of students awarded a Pell grant and the real average Pell grant award.
In 2011, the average full-time student had nearly $4,000 worth of Pell grants in 2010 dollars, as seen in Figure 3. By 2021, that number had fallen to $2,300, driven by a decline in the award rate. The award rate peaked at 34.5 percent in 2012 and has steadily declined to 30.5 percent as of 2022. Viewed through the lens of the model framework in "Accounting for Tuition Increases Across U.S. Colleges (PDF)," the fall in Pell grant award rates and decline in real average award amounts has reduced tuition growth.
Direct Government Support of Colleges
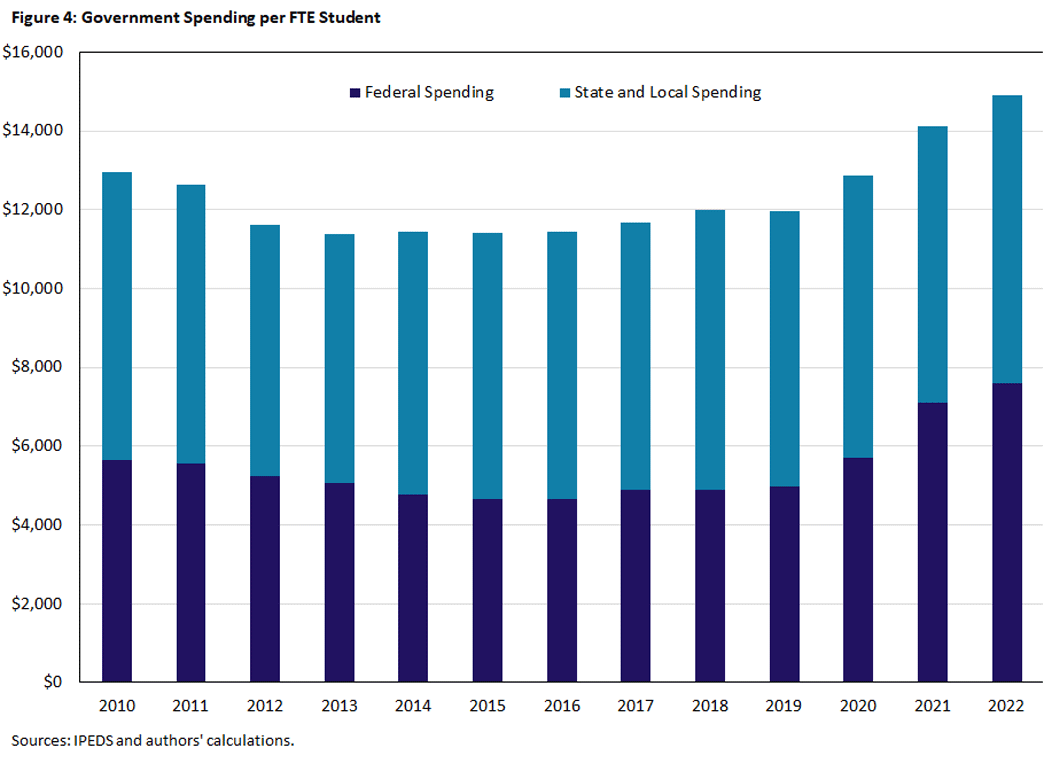
An important source of funding for higher education is government appropriations from state and local governments as well as the federal government. "Accounting for Tuition Increases Across U.S. Colleges (PDF)" examined the connection and found that each dollar of additional appropriations per student results in 40 cents of lower tuition, in line with empirical estimates.
Figure 4 shows the breakdown and trend of real government appropriations, which have been mostly flat over this period for both the federal and the state and local contributions. The stabilization of government support following years of tighter budgets in the aftermath of the 2007-09 financial crisis has helped restrain tuition growth in recent years.
Private Funding for Colleges
Another major component of funding for schools is private support in the form of gifts, grants and contracts. In 2010-11, these totaled more than $28.7 billion in 2021-22 dollars, or roughly $8,600 per full-time equivalent (FTE) student, according to National Center for Education Statistics IPEDS data. In 2020-21, schools received more than $34.1 billion in gifts, grants and contracts, amounting to approximately $10,619 per FTE student.6 As with the direct public support via appropriations, increased funds from private sources can also constrain tuition growth, as per the findings in "Accounting for Tuition Increases Across U.S. Colleges (PDF)."
Macroeconomic Trends Affecting the Demand for College
GDP Growth
Broad economic forces are also important for college tuition. In particular, the slow recovery from the 2007-09 financial crisis ushered in several years of low per capita GDP growth for much of the 2010s, stymieing families' ability to pay. After real GDP growth averaged 3-4 percent for much of the 2000s, the economy experienced a secular stagnation with annual real growth rates around 2 percent. Smaller income growth has undoubtedly restrained tuition growth, as our previous works all indicate.
College-Earnings Premium
Labor market outcomes are also critical in understanding the demand for college and, hence, the extent to which colleges can raise tuition without losing students. For much of the 1990s and 2000s, the wage premium that a college graduate could expect to receive relative to a worker with only a high school degree grew significantly, thus creating a strong incentive to attend college and a willingness to pay higher tuition.
Some of our previous work emphasized the importance of this college-earnings premium, finding that it contributed on its own to a 24 percent increase in college tuition. However, it has stopped growing over the past decade, and the college-earnings premium even fell modestly from 79 percent in the mid-2010s to 75 percent in 2022.7 The combination of stagnating labor market returns and multiple years of learning disruption due to COVID-19 may have reduced the perceived benefits of college, causing a lower willingness of students and families to absorb tuition increases.
Domestic and Foreign Enrollment
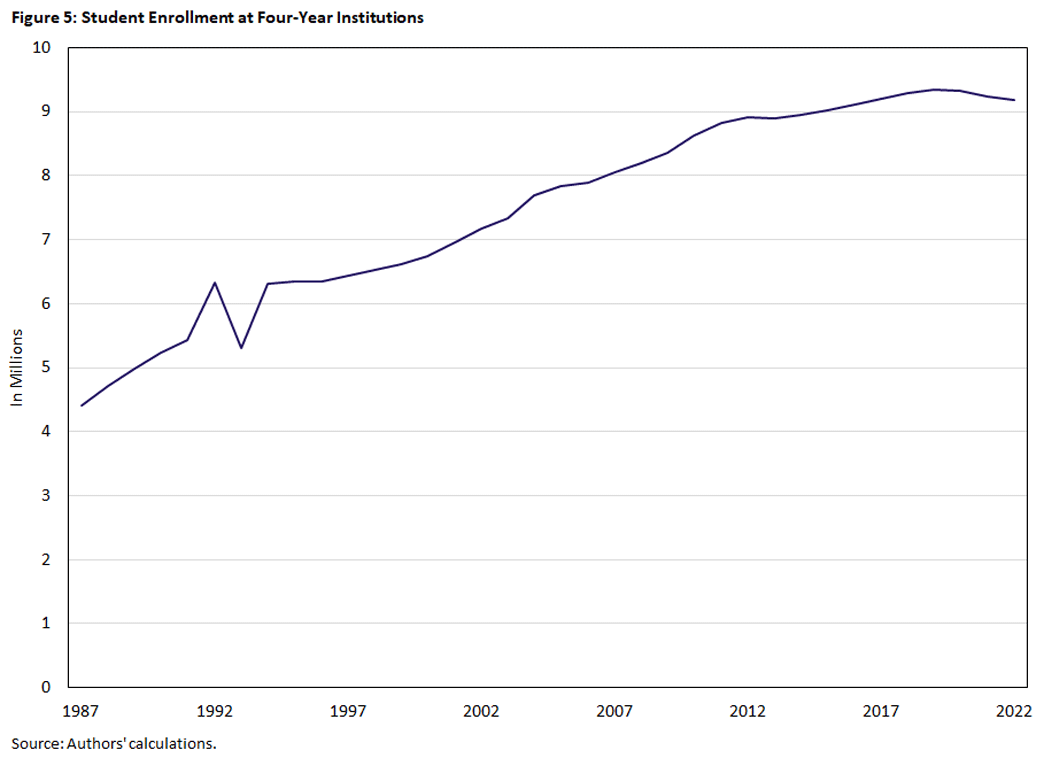
As indicated in Figure 5, overall enrollment has slowed, possibly reflecting this declining demand for schools. The reduction in tuition growth has been paired with a slowing of enrollment growth. After steady growth of 150,000-250,000 full-time students per year from 2002-2012, enrollment growth at four-year institutions slowed throughout the 2010s, and there has been a slight decrease since the pandemic.
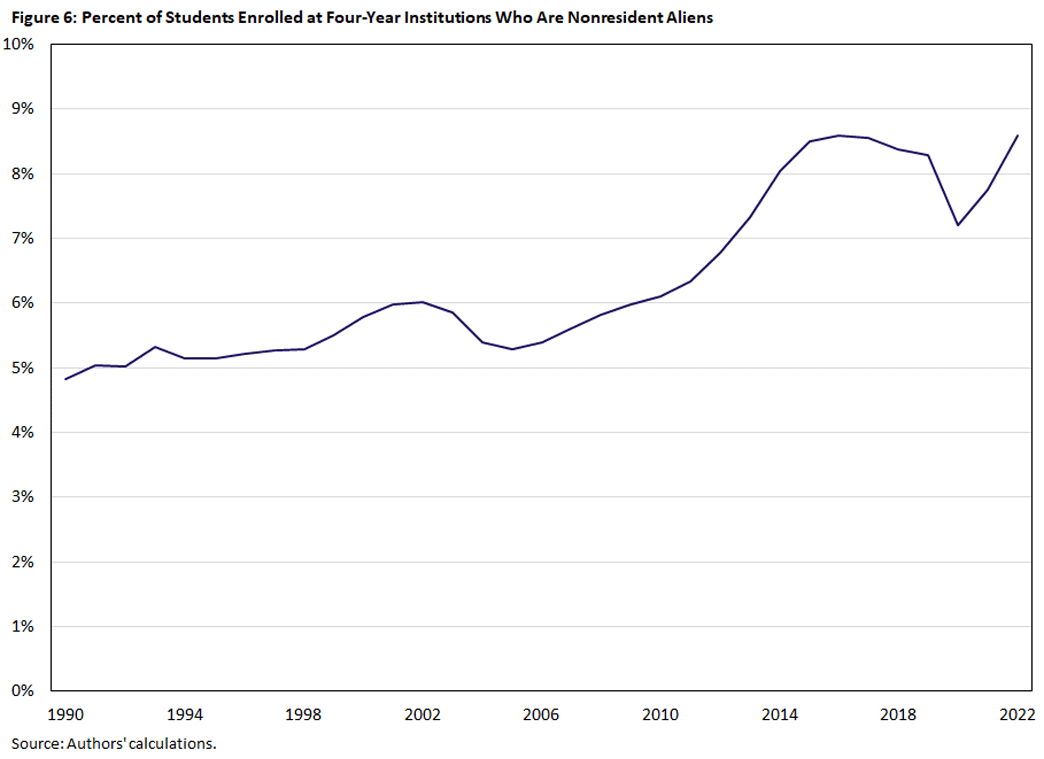
However, nonresident alien enrollment at four-year universities increased from 5.9 percent to 8.2 percent of total enrollment between 2009 and 2019, as seen in Figure 6. A 2020 paper indicates that public schools lean on foreign enrollment when the budget is tight, suggesting that foreign students pay more than domestic.8 This has presumably caused average net tuition to rise due to the composition effect of switching from lower-price domestic students to higher-price foreign ones.
Distance Learning
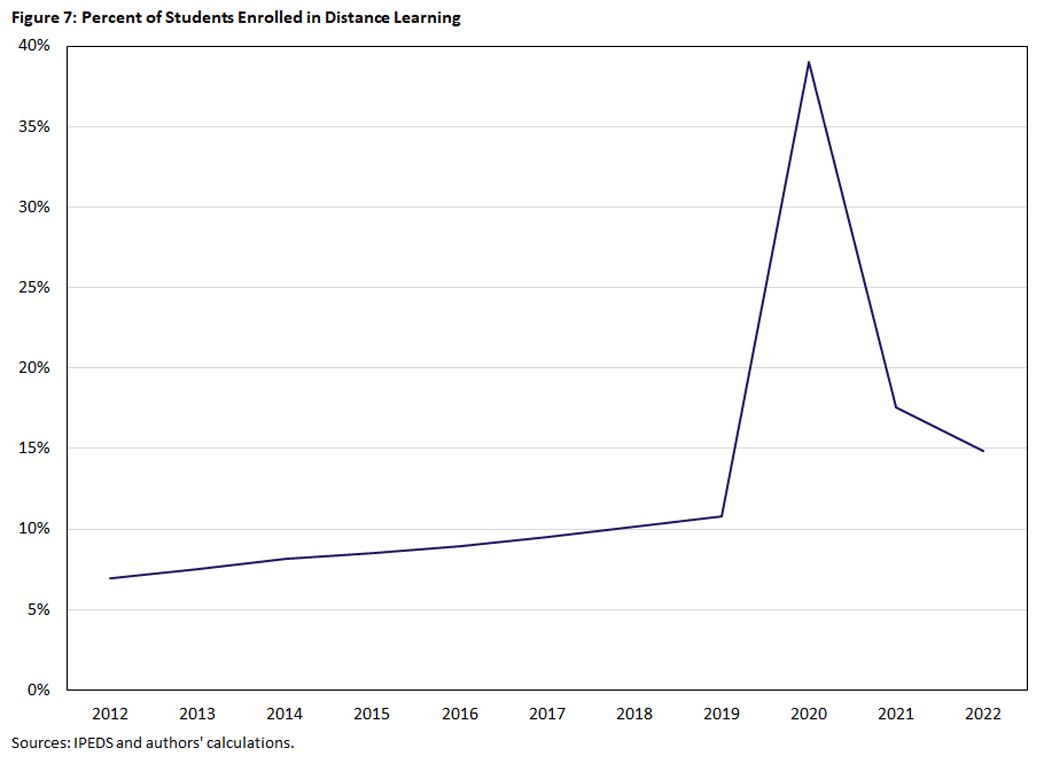
Distance learning has been a final factor serving as a deflationary force for college tuition. Intuitively, distance learning restrains tuition growth in two ways. First, it lowers costs for colleges, as there is no need to increase space at dorms, cafeterias, hospitals and sports arenas for remote students. Second, it lowers the willingness of students to pay for college, as they don't receive those benefits and the amenity value of college — a factor "Accounting for Tuition Increases Across U.S. Colleges (PDF)" and others have shown is important — is smaller. While the pandemic obviously increased distance learning tremendously, the secular trend up has been at work for more than a decade.
Conclusion
After tremendous increases starting in the 1980s, tuition growth has slowed considerably in the last decade. We have highlighted several factors contributing to this pivot. Slower income growth, the flattening of the college-earnings premium, a rise in remote learning, a reduction in Pell grant awards and a de facto freeze on nominal federal student loan limits have all worked toward lowering real tuition growth. However, tuition growth has been buoyed by rising nonresident alien enrollment and the higher uptake of income-driven repayment.
Over the long run, preliminary analysis in "Tuition Growth Over the Long Run" indicates net tuition grows at the rate of GDP when the college-earnings premium is flat and in the absence of policy intervention. As long as that remains the case, tuition may grow at a much slower rate than it did in the late 1980s through 2010.
Grey Gordon is a senior economist and Brennan Merone is a research associate, both in the Research Department at the Federal Reserve Bank of Richmond. Aaron Hedlund is an associate professor in the Economics Department at Purdue University.
These papers include the 2019 book chapter "Accounting for the Rise in College Tuition," the 2022 working paper "Accounting for Tuition Increases Across U.S. Colleges (PDF)" and the 2023 work in progress "Tuition Growth Over the Long Run."
See the 2024 report "Price of Attending an Undergraduate Institution" by the National Center for Education Statistics.
We focus on government-guaranteed loans rather than private because this is the predominant source of funding. According to the 2024 article "2024 Student Loan Debt Statistics: Average Student Loan Debt" by Alicia Hahn, 92 percent of all student debt is federal student loans with private loans comprising the rest.
There are several different IDR plans, such as Income-Contingent Repayment (ICR), Income-Based Repayment (IBR), Pay-As-You-Earn (PAYE) and Revised Pay-As-You-Earn (REPAYE). The Saving on a Valuable Education (SAVE) plan replaced REPAYE in August 2023. See Federal Student Aid's page "Income-Driven Repayment Plans" for details about each plan.
See Box 3-1 on page 20 of the report, authored by Nadia Karamcheva, Jeffrey Perry and Constantine Yannelis.
We calculated these figures from the National Center for Education Statistics' Digest of Education Statistics, Table 333.40, retrieved Jan. 18, 2024.
See the 2023 article "Falling College Wage Premiums by Race and Ethnicity" by Leila Bengali, Marcus Sander, Robert Valletta and Cindy Zhao.
See the 2020 paper "A Passage to America: University Funding and International Students" by John Bound, Breno Braga, Gaurav Khanna and Sarah Turner.
To cite this Economic Brief, please use the following format: Gordon, Grey; Hedlund, Aaron; and Merone, Brennan. (July 2024) "Tracking College Tuition Growth." Federal Reserve Bank of Richmond Economic Brief, No. 24-23.
This article may be photocopied or reprinted in its entirety. Please credit the authors, source, and the Federal Reserve Bank of Richmond and include the italicized statement below.
Views expressed in this article are those of the authors and not necessarily those of the Federal Reserve Bank of Richmond or the Federal Reserve System.
Receive a notification when Economic Brief is posted online.


