Racial Differences in the Medical Spending of Older Americans
Economic Brief
October 2024, No. 24-31
Key Takeaways
- Using a combination of administrative and survey data, we examine the extent to which medical spending varies by race, both annually and over a household's lifetime.
- We also examine racial differences in the allocation of medical expenses across potential payors.
- We find that, on average, White, Black and Hispanic households have similar amounts of total medical spending, but White households pay more of their expenses out of pocket or through private insurance, while Black and Hispanic households rely more on Medicare and means-tested coverage from Medicaid.
The medical expenses of older Americans are covered by multiple payors. In most cases, the principal payor is Medicare, a federally funded health insurance program for those 65 and older. However, additional payments may be made out of pocket by the household itself, by individually purchased or employer-provided private insurance, by Medicaid (a government program for poorer households), or by other smaller public or private payors. Also, some medical expenses are simply defaulted on and go unpaid.
In this article, we estimate models of health, longevity, total medical spending and the payors of that spending by race. We then use these models to predict health and medical spending over a retired household's remaining lifetime.
We find that White, Black and Hispanic households pay similar amounts in total medical spending each year on average. While these spending differences are sometimes modest at an annual level, they lead to substantially different lifetime totals when combined with differences in life expectancy.
Furthermore, the distribution of various payment and insurance methods differs noticeably by race. We find that White households pay a larger percentage of their medical spending out of pocket, while Black and Hispanic households have a larger percentage covered by Medicaid. Hispanic households have the highest total medical expenditures over their retirements, and White households pay the most out of pocket.
Our Data
Our principal data sources are survey data from the Health and Retirement Study (HRS) linked to administrative data from the Centers for Medicaid and Medicare Services (CMS). In addition, data from the Medical Expenditure Panel Survey (MEPS) are used to impute payments for payors not found in the other sources, such as private insurers. Together, these datasets provide detailed demographic, financial and health-related information for households 65 and older during the period 1999-2012.
We deflate all expenditures to 2014 dollars with the personal consumption expenditures price index. This dataset has been used in several projects with our colleagues Eric French and Jeremy McCauley.1
Table 1 shows the breakdown of annual medical spending by race and payor. Overall, we observe similar levels of total medical spending across racial groups, with Hispanic, White and Black households incurring average medical expenses of $25,900, $24,300 and $23,100, respectively. The distribution of spending within each racial group is also comparable, with the bottom half of the household-year spending distribution accounting for roughly 10 percent of the aggregate total and the top 5 percent of the distribution accounting for around 30 percent.
| Spending Percentiles | Total Spending | Percentage of Total Paid | ||||
|---|---|---|---|---|---|---|
| Mean ($2014) | Percentage of Total | Out of Pocket | Medicare | Medicaid | Other | |
| A. White Households | ||||||
| All | $24,256 | 100.0% | 18.8% | 55.2% | 6.5% | 19.5% |
| 95-100% | $133,527 | 27.5% | 19.9% | 54.9% | 8.3% | 16.9% |
| 0-50% | $5,117 | 10.5% | 28.9% | 47.2% | 2.0% | 21.9% |
| B. Black Households | ||||||
| All | $23,093 | 100.0% | 11.1% | 61.7% | 14.9% | 12.3% |
| 95-100% | $140,492 | 30.4% | 8.4% | 65.4% | 14.3% | 11.8% |
| 0-50% | $3,752 | 8.1% | 25.2% | 49.0% | 10.3% | 15.3% |
| C. Hispanic Households | ||||||
| All | $25,862 | 100.0% | 7.7% | 63.7% | 20.0% | 8.6% |
| 95-100% | $149,720 | 28.9% | 5.5% | 69.3% | 16.7% | 8.5% |
| 0-50% | $4,902 | 9.5% | 19.1% | 54.6% | 15.8% | 10.4% |
|
Notes: The "other" category of medical spending encompasses payments made by private insurance, employer-provided insurance, government programs not under Medicare or Medicaid (such as veterans' care), and spending owed to a medical establishment that goes ultimately unpaid. Sources: The Health and Retirement Study, the Centers for Medicare and Medicaid Services, the Medical Expenditure Panel Study and authors' calculations. |
||||||
The sources of these payments, however, vary greatly by race. On average, White households pay 18.8 percent of their expenses out of pocket, whereas Black households pay 11.1 percent, and Hispanic households pay only 7.7 percent. This difference is even more striking for households in the top 5 percent of the distribution (who on average incur more than $130,000 of expenses): White households pay 19.9 percent of those costs out of pocket, as compared to 8.4 percent and 5.5 percent for Black and Hispanic households, respectively. The latter two groups have much larger fractions of their spending covered by Medicare and Medicaid.
The "other" category of medical spending encompasses payments made by private insurance, employer-provided insurance, government programs not under Medicare or Medicaid (such as veterans' care), and spending owed to a medical establishment that goes ultimately unpaid. White households have a larger portion of their spending covered by these payors, most of which is attributable to higher rates of private insurance.2
Table 2 gives context for some of the spending differences found in Table 1. First, fewer Black households are currently married. This may partly explain their lower average spending, since we are measuring spending at the household level rather than individual level. Second, we see that the White households in our sample are older (which should raise their medical spending relative to Black and Hispanic households) but are also more likely to be in good health (which should lower it).
| White | Black | Hispanic | |
|---|---|---|---|
| Currently Married | 39% | 19% | 33% |
| Age | 78.07 | 76.50 | 76.21 |
| Income Percentile | 0.58 | 0.43 | 0.32 |
| Education (Years) | 12.34 | 10.23 | 7.66 |
| Health Status: Good | 64% | 49% | 42% |
| Health Status: Bad | 26% | 40% | 52% |
| In a Nursing Home | 6% | 5% | 3% |
| Enrolled in Medicaid | 9% | 28% | 41% |
| On Private Insurance | 28% | 9% | 6% |
| Observations | 66,453 | 12,814 | 6,156 |
| Sources: The Health and Retirement Study, the Centers for Medicare and Medicaid Services, the Medical Expenditure Panel Study and authors' calculations. | |||
Third, White households have the highest average income, while Hispanic households have the lowest.3 However, the effects of income on medical spending are not immediately obvious. All else equal, economic theory predicts that households with more income will spend more on medical care. On the other hand, higher income individuals tend to be healthier. Higher income also leaves White households less likely to qualify for the subsidies provided by Medicaid, which imposes income and wealth tests on potential recipients. Conversely, White households are more likely to hold private insurance.
Fourth, Hispanic households are the least likely to have members in a nursing home. Nursing-home care is both expensive and almost completely ineligible for Medicare reimbursement. The lower rate of nursing-home use — along with the higher rate of Medicaid eligibility — may help explain why Hispanic households pay the lowest percentage of their medical spending out of pocket.
Simulation Results
Our data do not allow us to track individual households over the entirety of their retirements. To do this, we turn to simulations. We begin by using the data to predict health, longevity and medical spending for each race as functions of health, income, household structure and age.4 These controls explain much but far from all the variation in medical expenses. We model the residual component of spending with the statistical framework developed in the 2017 paper "Earnings and Consumption Dynamics: A Nonlinear Panel Data Framework."5 We also estimate a model of health status transitions and use it to simulate histories, including year of death. Combining the health, longevity and medical spending components yields health and medical spending histories for a large set of artificial households. The remainder of this note is based on these simulated data.
Annual Medical Spending and Decomposition
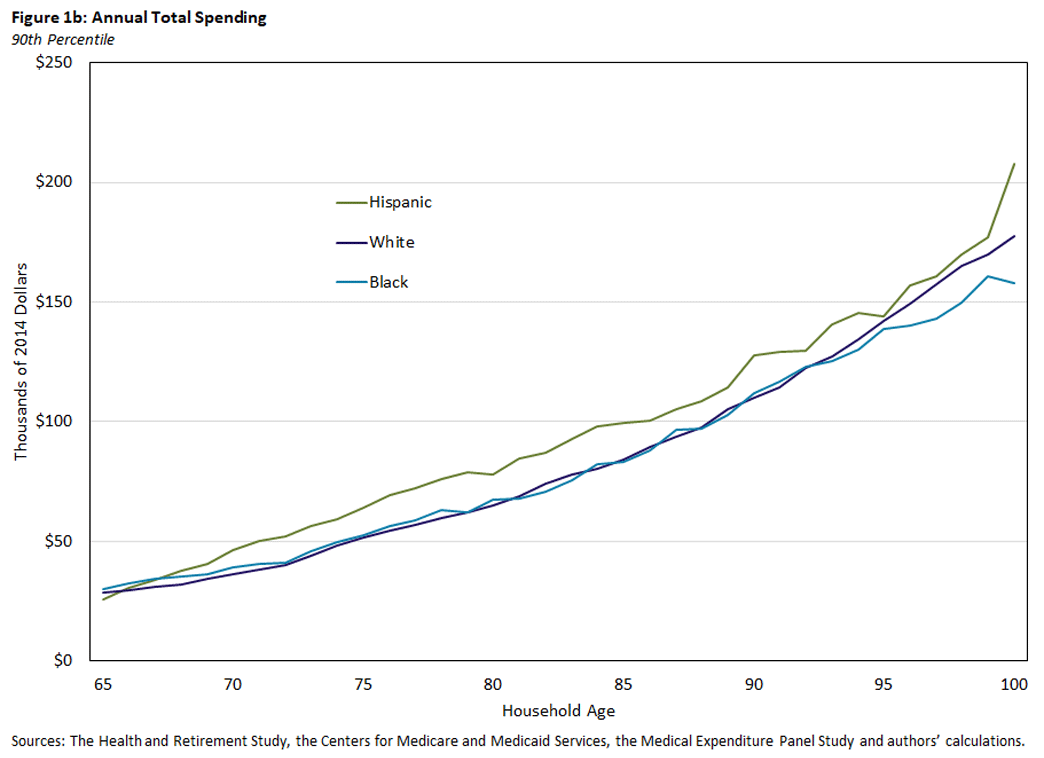
Figures 1a and 1b show total medical spending over the life cycle for each racial group. Spending increases rapidly for all three groups, with average annual spending (Figure 1a) rising from $12,000 at age 65 to around $75,000 at age 100. Differences between White and Black households at the mean (Figure 1a) and 90th percentile (Figure 1b) are slim. Hispanic households tend to have higher spending for most of their life cycles, especially at the oldest ages.

Payor Decomposition
Our simulations also divide total medical spending among potential payors, using race-specific allocation rules estimated from the data. Figures 2a-2c display how these payments evolve over a household's lifetime.
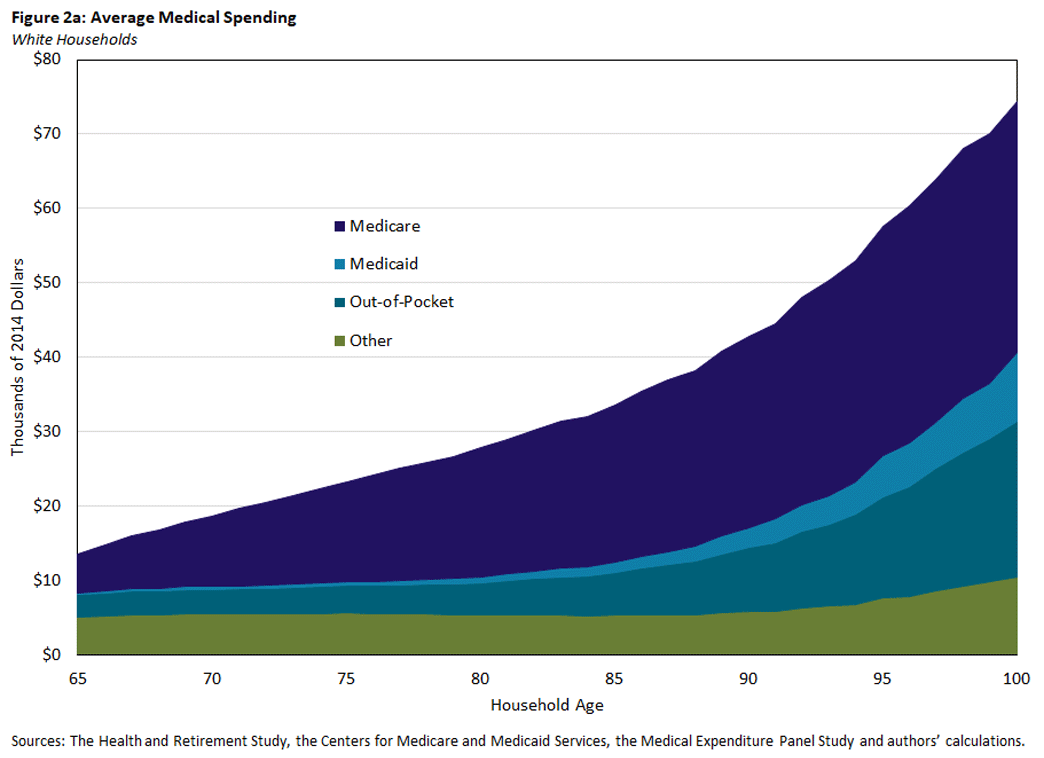
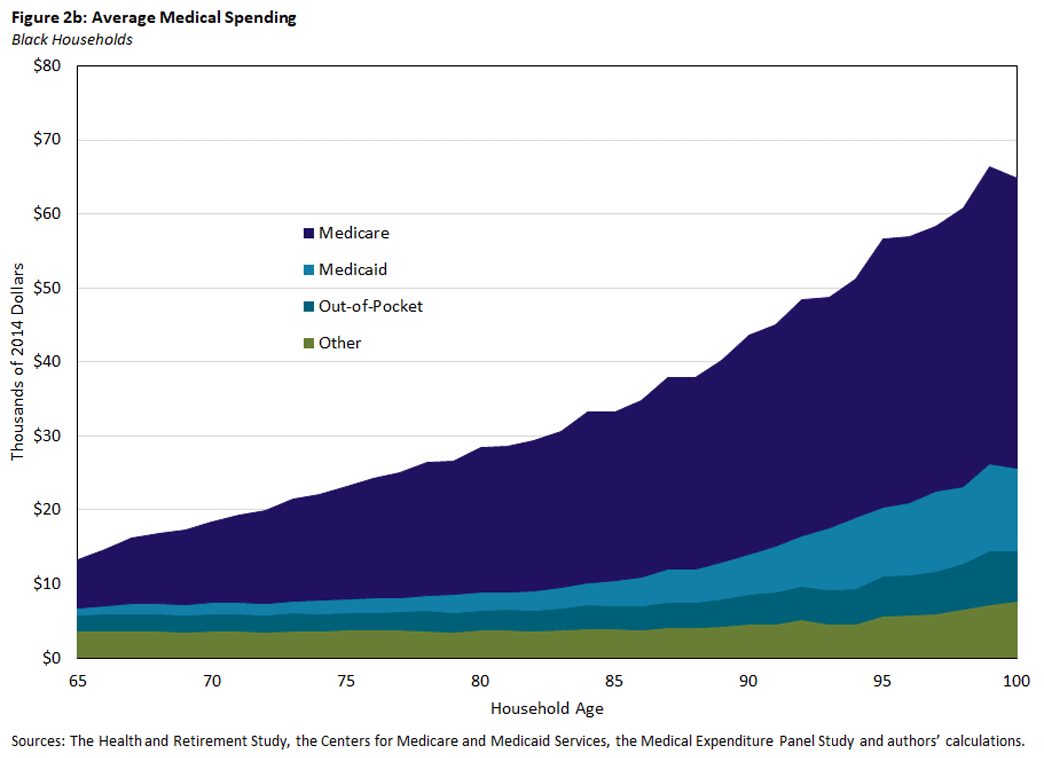
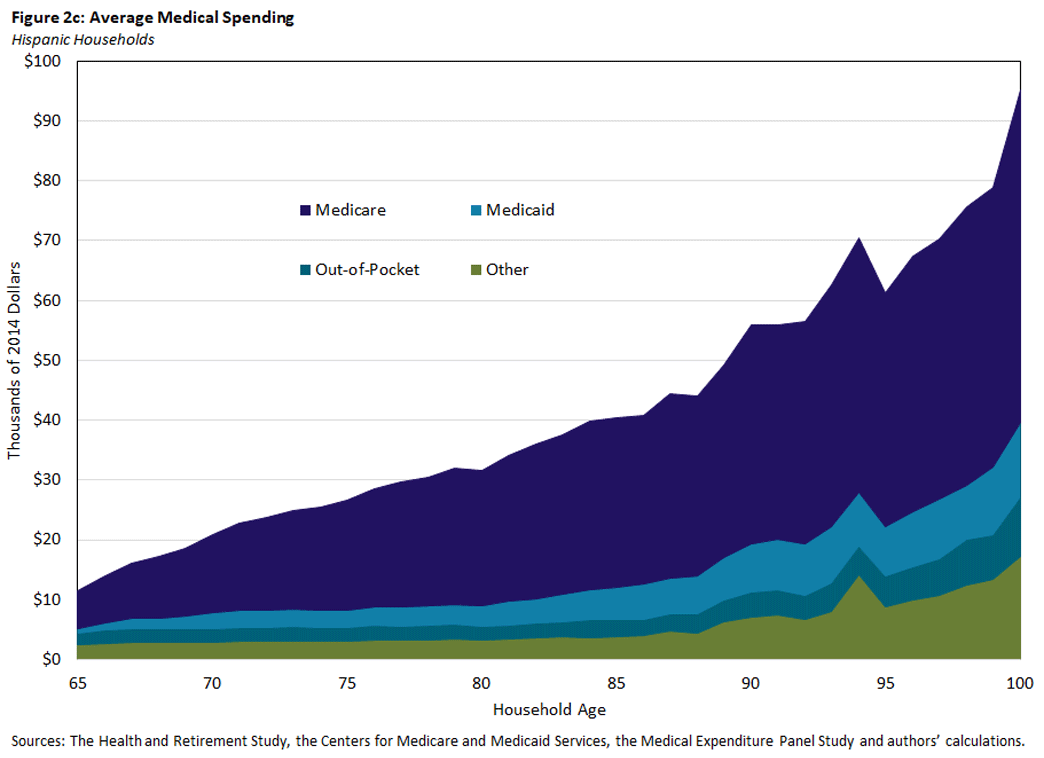
Across all ages and races, Medicare is the primary payor of medical expenses, but its share of total medical spending decreases with older ages as Medicaid and out-of-pocket payments pick up substantially. One explanation for this pattern is that income and wealth decline with age as retirees deplete their savings, allowing older households to become eligible for Medicaid. Additionally, older individuals are more likely to require long-term care services such as stays in nursing homes, which are not covered by Medicare but are mostly paid out of pocket or by Medicaid (if eligible) instead.
Medicaid payments are small in earlier years for all races but are particularly small for White households, who generally rely least heavily on this program. Out-of-pocket payments also rise with age and, consistent with earlier results, are highest for White households. For White and Black households, the amount of medical spending covered by other payors increases rather slowly with age. Spending by other payors increases more notably for Hispanic households (especially after age 85), although it is unclear which component of the "other" spending category is driving the increase.
Lifetime Total and Out-of-Pocket Spending
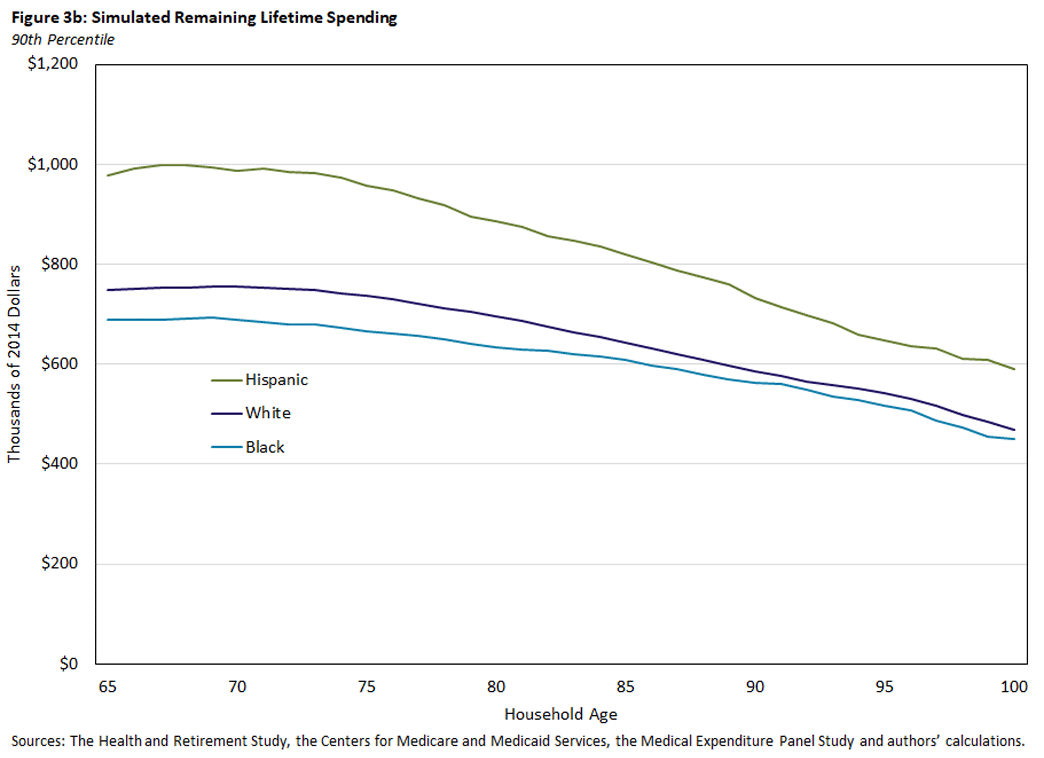
Since we simulate the life history of each household until death, we can at each age calculate the present value of the medical expenditures it incurs over the remainder of its life.6 Comparing the three groups, Figure 3a shows that, at age 65, Hispanic households expect to incur on average nearly $500,000 in medical expenses over the rest of their lives. This is a larger amount than that of White households (just over $400,000) and Black households (around $340,000). The 90th percentile of medical spending (shown in Figure 3b) has the same pattern, although the dollar amounts are roughly twice as large. Recall from Figure 1 that annual medical spending was similar across the three groups, with Hispanic households incurring slightly more. The lifetime totals in these figures show that minor annual differences accumulate over time.

The totals also reflect differences in life expectancy. As shown in Table 3, Hispanic households not only spend more each year but on average incur expenses for roughly one extra year compared to White households (because Hispanic individuals have an additional year of life expectancy). Black households have annual expenditures akin to those of White households but face lower lifetime totals because of their shorter lifespans.
| Probability of Ever Entering a Nursing Home | Remaining Life Expectancy at 65 | |||
|---|---|---|---|---|
| Men | Women | Men | Women | |
| White Individuals | 30.7% | 46.5% | 17.8 | 21.0 |
| Black Individuals | 29.1% | 40.7% | 15.2 | 19.0 |
| Hispanic Individuals | 25.3% | 35.9% | 18.8 | 22.1 |
| Sources: The Health and Retirement Study, the Centers for Medicare and Medicaid Services, the Medical Expenditure Panel Study and authors' calculations. | ||||
Since medical spending is much more costly at older ages, we see that total expected lifetime spending decreases only modestly with age: Deceased households will drop out of the sample, and the remaining sample will consist increasingly of households who live to an older, more expensive stage of their lives. Even at age 90, 10 percent of Hispanic households will incur at least $730,000 over the remainders of their lives, with 10 percent of White and Black households facing costs of at least $560,000 to $590,000.
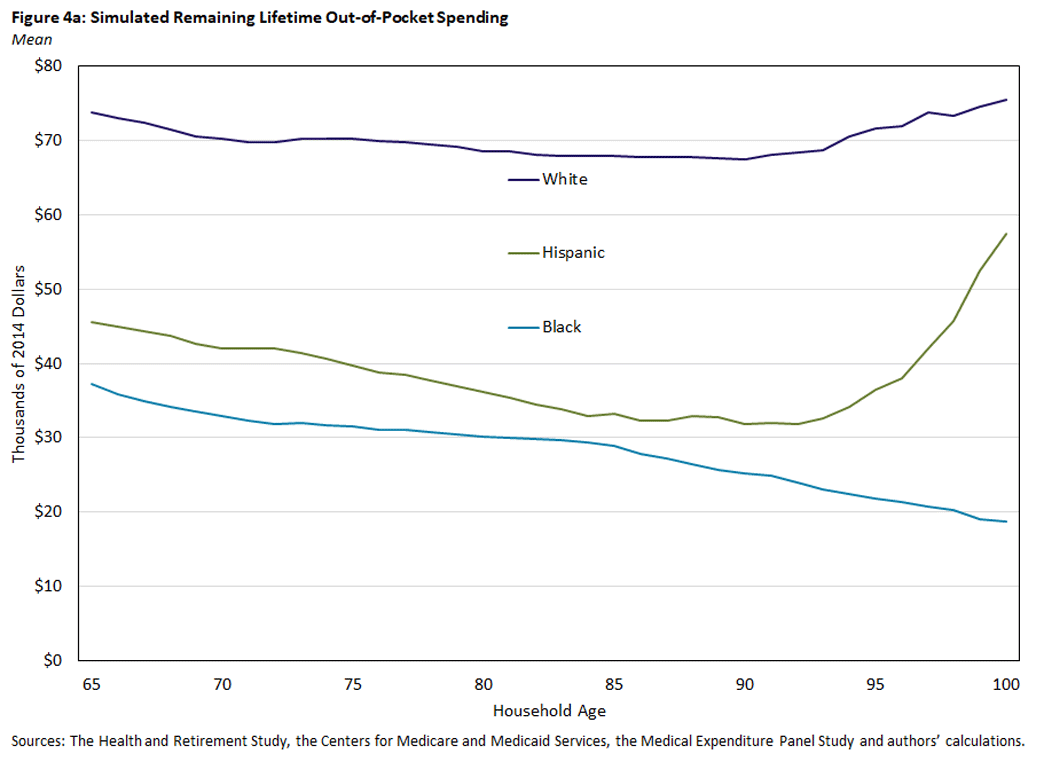
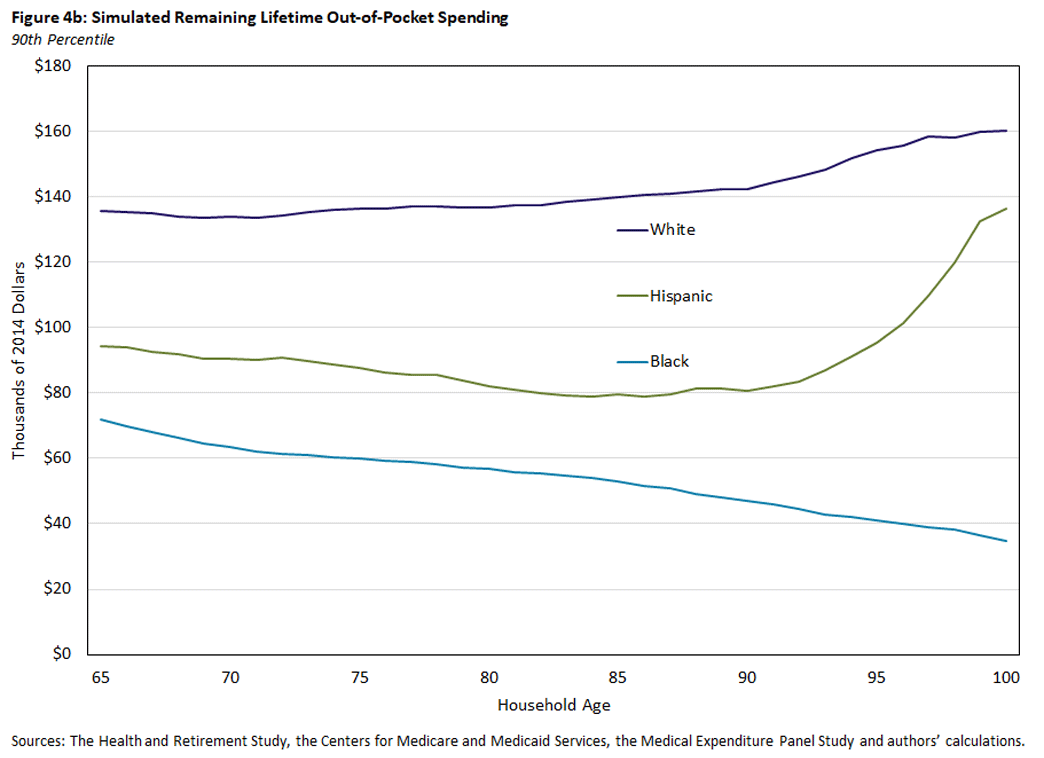
While Hispanic households tend to have the highest lifetime total medical expenditures, most of these expenses are not paid out of pocket. By simulating the share of spending paid by each source, we can determine the portion of lifetime expenses paid directly by the household. As noted in Table 1 and Figure 2, White households pay a larger portion of spending out of pocket. As a result, average lifetime out-of-pocket spending is considerably higher for White households, at nearly $74,000 at the age of 65, as seen in Figure 4a. This is roughly 60 percent to 100 percent more than what's paid by Hispanic and Black households, respectively. Notably, among White and Hispanic households, the decline in lifetime out-of-pocket spending over age is less pronounced than that for total spending, since a disproportionate share of out-of-pocket spending — particularly for care in a nursing home — is incurred at very old ages, as seen in Figure 4b.
Conclusion
Using a rich dataset that combines survey and administrative data, we study race differences in annual and lifetime medical spending, both in total and by payor. While each group incurs similar amounts of medical expenses on an annual basis, White households have higher proportions of their expenses paid out of pocket or through payors such as private insurance. The use of Medicaid is another source of variation, with Black and Hispanic households being more likely to receive Medicaid and having much larger shares of their medical expenses covered by it.
Our simulation analyses of total lifetime spending reveal the same sorts of patterns. Hispanic households have the highest lifetime medical expenses, spending slightly more each year and living longer. Black households — with the shortest lifespans and the largest share of unmarried-person households — have the lowest lifetime totals.
More striking are the differences in lifetime out-of-pocket spending, with White households expecting to pay nearly twice as much as Black households. Households of every race face substantial lifetime out-of-pocket expenses, however, and these expenses decline very slowly with age, as declining life expectancy is somewhat offset by annual costs increasing with age.
In our ongoing work, we are studying how these spending differences — along with differences in financial resources and health — affect the saving decisions of retired households of each race. A better understanding of these topics should help prepare households for the medical expenses they will incur in their older years.
Karolos Arapakis is a research economist at the Center for Retirement Research at Boston College. Erin Henry is a former research associate, John Bailey Jones is a vice president of microeconomic analysis, and Nathan Robino is a research associate, all with the Research Department at the Federal Reserve Bank of Richmond.
1
French is affiliated with the University of Cambridge, the Institute for Fiscal Studies and Center for Economic Policy Research, and McCauley is affiliated with the University of Bristol. The papers produced by this team include the 2021 working paper "On the Distribution and Dynamics of Medical Expenditure Among the Elderly," the 2022 working paper "How Redistributive Are Public Health Care Schemes? Evidence from Medicare and Medicaid in Old Age" and the 2023 working paper "Medical Spending Risk Among Retired Households by Race." Many of the results shown here are updated results from the third of these papers.
2
Many of these insurance policies (along with Medicare Part B) charge premiums. The calculations shown here do not account for such premiums and thus understate the total health-related expenses borne by households.
3
The income variable we use is a measure of lifetime earnings or permanent income (PI) based on pension and Social Security benefits, which we express as a rank over the [0,1] interval. Descriptions of our PI measure can be found in the papers listed in footnote 1.
4
We also control for year of birth with a set of birth cohort indicators. The results shown here are for the cohort born between 1929 and 1933.
5
Authored by Manuel Arellano, Richard Blundell and Stephane Bonhomme.
6
We discount future expenditures at an annual rate of 3 percent.
To cite this Economic Brief, please use the following format: Arapakis, Karolos; Henry, Erin; Jones, John Bailey; and Robino, Nathan. (October 2024) "Racial Differences in the Medical Spending of Older Americans." Federal Reserve Bank of Richmond Economic Brief, No. 24-31.
This article may be photocopied or reprinted in its entirety. Please credit the authors, source, and the Federal Reserve Bank of Richmond and include the italicized statement below.
Views expressed in this article are those of the authors and not necessarily those of the Federal Reserve Bank of Richmond or the Federal Reserve System.
Subscribe to Economic Brief
Receive a notification when Economic Brief is posted online.
Contact Us