Anatomy of the Bank Runs in March 2023
Economic Brief
December 2024, No. 24-39
The Run Was Short ...
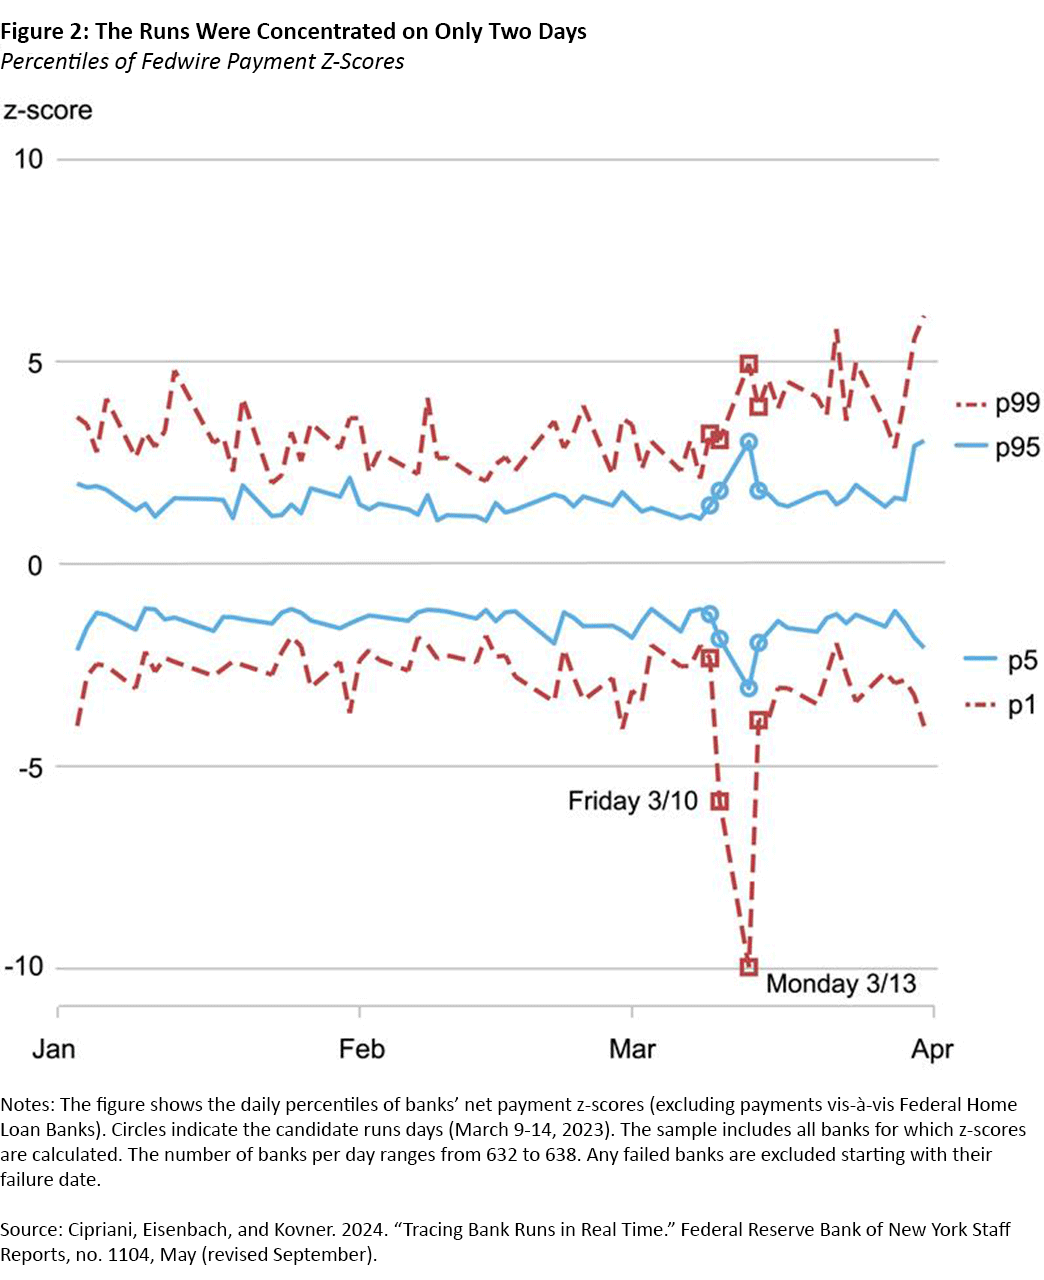
Banks send most large payments through the Fedwire Funds Service (from now, Fedwire), which moves money between banks' accounts at the Federal Reserve. When depositors run on a bank and wire large amounts of money to other banks, the run-on bank suffers large and unusual payment outflows but no compensating inflows. To check for unusual outflows in March 2023, we standardize each bank's daily net payment flows by subtracting the mean and dividing them by their standard deviation. The chart below shows the most extreme payment flows between Jan. 1 and March 31, 2023, by plotting the 1st, 5th, 95th and 99th percentiles of the daily cross-section of standardized net payments for a sample of banks that are active in Fedwire. As the chart shows, the 1st percentile drops significantly on Friday, March 10 — following the run on Silicon Valley Bank (SVB) — and on Monday, March 13, which means that 1 percent of sample banks suffered unusually large outflows on these two days. Even the 5th percentile of net payments notably declines on Monday, March 13. The outflows stop on March 14 with the runs stopping just as quickly as they started. In other words, the March 2023 run was very short-lived, with banks suffering highly unusual outflows over a period of only two days.
... but Several Banks Were Run
We identify run-on banks as those banks whose net payments were more than five standard deviations below normal during the four business days window from Thursday, March 9, to Tuesday, March 14.
Using this method, we identify 22 run-on banks, five of which suffered a run on Friday and 19 on Monday (so two suffered a run on both days); this is far above the number of banks which failed during the episode (only two). The value of outgoing wire transfers from these banks more than tripled on the run days. Furthermore, the average size of run payments was more than three times what would have been expected absent the run, confirming that the run was mainly initiated by larger depositors.
How Were Run-on Banks Different From Other Banks?
In the table below, we show the key differences in the balance sheets of run and non-run banks as of the last regulatory filing before the run (the fourth quarter of 2022), highlighting the fact that bank runs have both fundamental and panic elements.2 Run banks had significantly lower tier-1 capital, consistent with the idea that depositors run on a bank when they are concerned with the bank's fundamental solvency. Run banks also had significantly lower cash holdings, consistent with the idea of liquidity-driven runs as depositors try to withdraw before the bank is out of cash. Further, run-on banks had significantly more uninsured deposits, and these were significantly more concentrated, consistent with the presence of stronger panic element when there are "large players."3 Finally, run-on banks were overwhelmingly banks that are publicly traded on the stock market; this points to a role for public information that we will discuss in a subsequent blog post.
| Run banks | Non-run banks | p-value | |
|---|---|---|---|
| Tier-1 capital / assets | 8.9% | 10.0% | 0.1% |
| Cash / assets | 3.7% | 6.6% | <0.1% |
| Amount uninsured / total deposits | 49.0% | 39.4% | 3.4% |
| Number uninsured / total deposits (billions) | 439 | 544 | 0.5% |
| Publicly traded | 81.8% | 36.5% | <0.1% |
| Source: Cipriani, Eisenbach, and Kovner. 2024. "Tracing Bank Runs in Real Time." Federal Reserve Bank of New York Staff Reports, no. 1104, May (revised September). Notes: The table shows means of characteristics as of the fourth quarter of 2022 for run banks and non-run banks as well as the p-value for a two-group mean comparison t-test for unpaired data with unequal variances. The sample includes all banks with z-scores on the run days (March 9-14). | |||
Importantly, however, the characteristics of run banks and non-run banks significantly overlap. For instance, at least 25 percent of banks in both groups have cash holdings lower than 2 percent as a share of their assets; we find similar results for all the characteristics associated with run behavior we discussed above. While we can relate the occurrence of runs to specific characteristics consistent with fundamental and panic elements, a notable unexplained component therefore remains, consistent with a "sun-spot" element that is impossible to predict.
How Did Banks Respond to Being Run?
In most bank run models, banks respond to deposit outflows by first using up their cash and then selling their assets. Asset sales make systemic bank runs damaging because many bank assets are illiquid and fire-selling them causes spillovers to other banks. This, however, is not what happened in March 2023. The figure below shows, separately for run and non-run banks, the changes in banks' balance sheets from the Wednesday before the run to the Wednesday after, based on bank-level data.
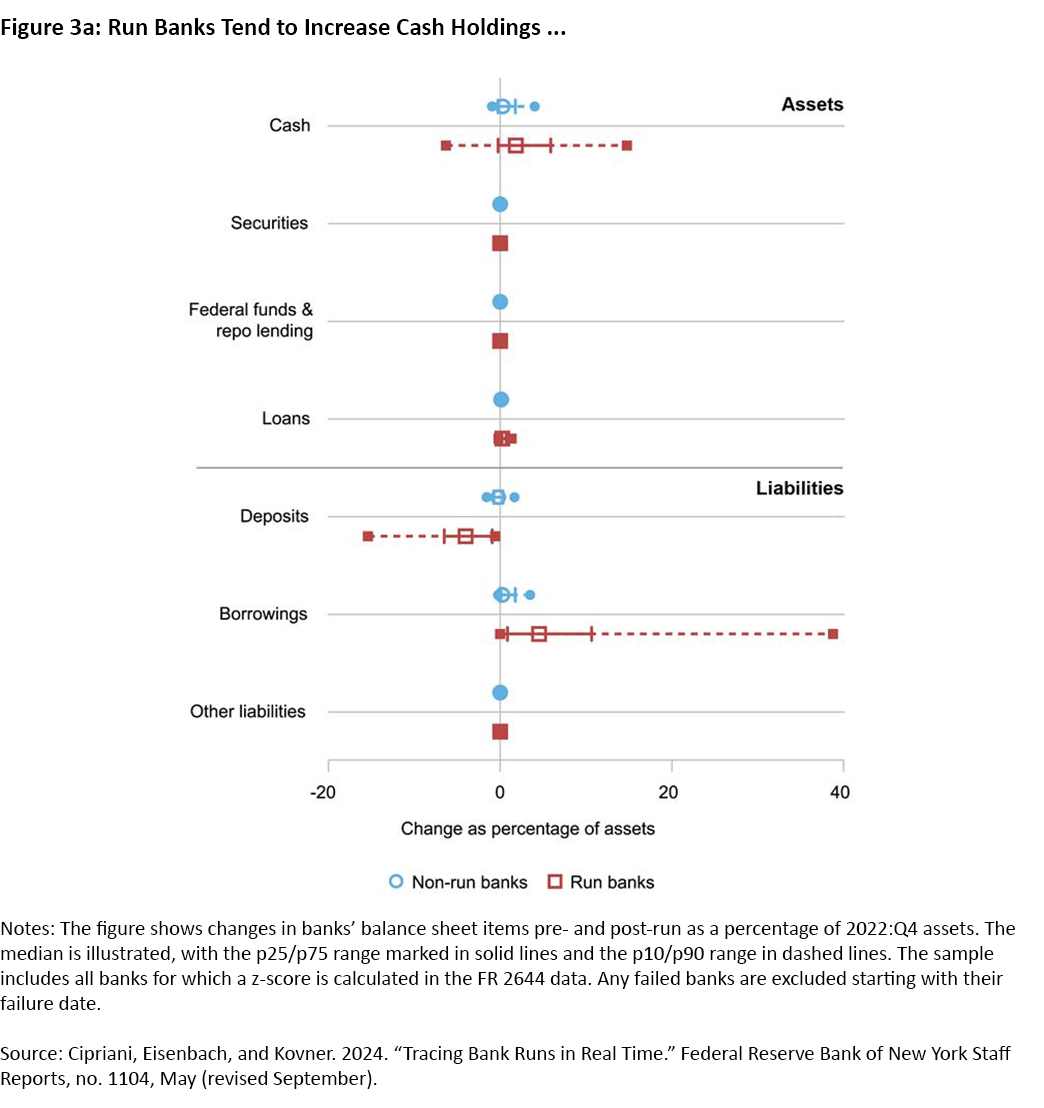
As the figure shows, almost all run banks responded to the deposit outflows by borrowing new funds from other sources. In fact, they borrowed so much that 75 percent of run banks increased their cash balances in the week of the run. That is, they more than offset the deposit outflows.
The next figure shows the sources of the change in banks' cash balance at the Federal Reserve over the same one-week period.

Almost all run-on banks borrowed from Federal Home Loan Banks (FHLBs), whereas only a few borrowed from the discount window (including the newly established Bank Term Funding Program); those that did borrow from the discount window, however, borrowed in large amounts. This is consistent with banks using the discount window only as their lender of last resort, to be tapped only when funds from FHLBs are not available.
Concluding Remarks
In a recently issued staff report, we use payments data to study the March 2023 bank run. We find that the run was concentrated on only two days and was driven mainly by a relatively small number of large depositors. However, a large set of banks were run on, far in excess of the banks that ultimately failed. Although run-on banks had on average worse fundamentals, there are large overlaps between the balance sheet characteristics of run and non-run banks. Banks react to their run by increasing their borrowing, mainly from FHLBs and only as a last resort from the discount window.
Marco Cipriani is the head of Money and Payments Studies and Thomas Eisenbach is a financial research advisor, both in the Research and Statistics Group at the Federal Reserve Bank of New York. Anna Kovner is an executive vice president and the director of research in the Research Department at the Federal Reserve Bank of Richmond.
1
See our 2024 report "Tracing Bank Runs in Real Time."
2
See the 2013 book chapter "Empirical Literature on Financial Crises: Fundamentals vs. Panic" by Itay Goldstein.
3
See the 2004 paper "Does One Soros Make a Difference? A Theory of Currency Crises With Large and Small Traders" by Giancarlo Corsetti, Amil Dasgupta, Stephen Morris and Hyun Song Shin.
To cite this Economic Brief, please use the following format: Cipriani, Marco; Eisenbach, Thomas; and Kovner, Anna. (December 2024) "Anatomy of the Bank Runs in March 2023." Federal Reserve Bank of Richmond Economic Brief, No. 24-39.
This article may be photocopied or reprinted in its entirety. Please credit the authors, source, and the Federal Reserve Bank of Richmond and include the italicized statement below.
Views expressed in this article are those of the authors and not necessarily those of the Federal Reserve Bank of Richmond or the Federal Reserve System.
Subscribe to Economic Brief
Receive a notification when Economic Brief is posted online.
Contact Us