Why Is Geographic Mobility Declining?
Economic Brief
May 2025, No. 25-19
Key Takeaways
- In the U.S., people of all ages are moving less than they did 30 years ago. In this article, we describe some of the leading economic explanations for this decline in geographic mobility.
- One set of explanations focuses on long-term trends such as population aging and expanding earnings opportunities for women.
- Another set of explanations focuses on changes in the geographic distribution of earnings, urban amenities and housing prices.
From covered wagons to rental vans, moving has been an iconic feature of American life. In the past 30 years, however, moving rates have fallen dramatically. In this article, we describe leading economic explanations for the ongoing decline in mobility.
Figure 1 shows a steady decline in interstate migration rates between 1996 and 2024 across all age groups.1 The figure also shows that moving rates are consistently higher for younger adults (25-34) than for older age groups and that mobility has declined within every age group. Thus, the overall decline in the mobility rate (age 25+) is due to a combination of population aging and mobility falling within every age group.

Some of the explanations for the decline in mobility involve long-term trends — such as population aging or increased earnings opportunities for women — that make moving costlier. Others appeal to changes in the geographic distribution of earnings, urban amenities and housing prices, all of which make moving less rewarding.
An Economic Framework
The explanations we discuss below fit into a widely used economic framework. Most economic models of migration focus on one or more of the following factors:2
- Employment
- Earnings
- Amenities (such as weather, shopping and dining)
- Proximity to family and friends
- Housing prices
These models begin with the assumption that individuals and families migrate when the expected benefits of living in new locations (net of moving costs) exceed the expected benefits of remaining in their current locations. They characterize individuals and locations as multidimensional: Individuals may prefer — or have skills better suited to — some jobs rather than others, and employers may offer higher wages for those jobs in one area than in another. People may also differ in the amenities they prefer, while locations may differ in the amenities they offer. These decisions drive migration flows across areas, with wages and/or housing prices mediating the flows.
Demographic Trends in Employment and Earnings
Men and Women
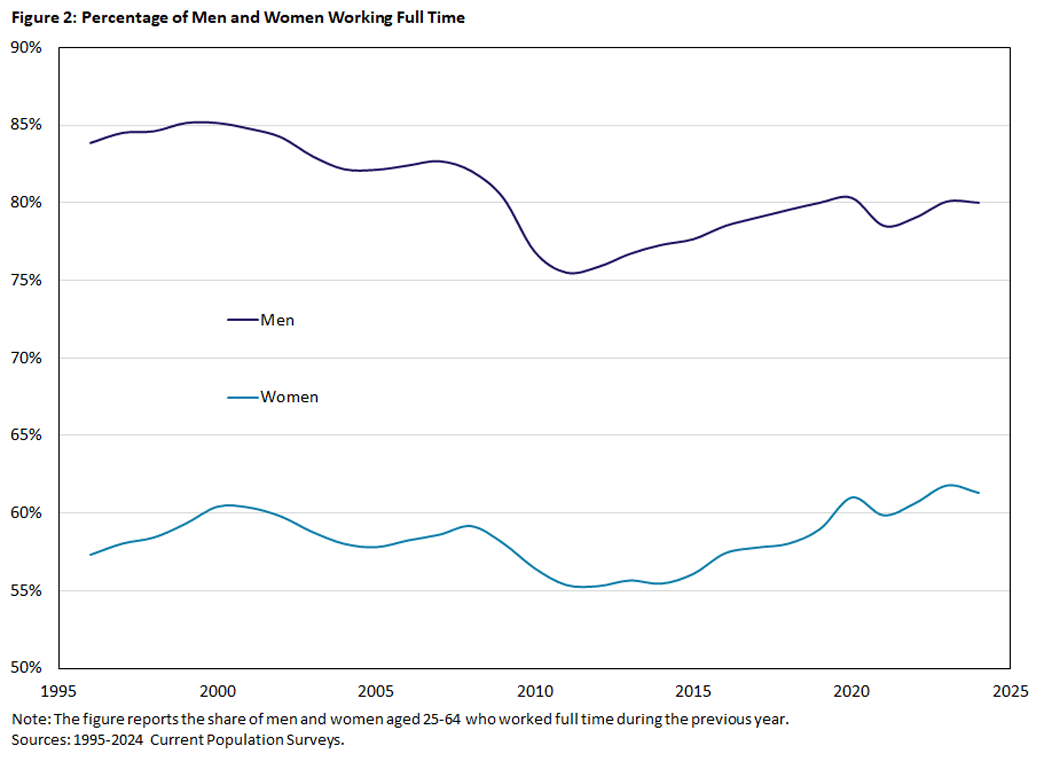
Figure 2 shows that the fraction of women working full time rose from 57 percent in 1996 to 61 percent in 2024, while the share of men working full time fell from 84 percent to 80 percent.
As Figure 3 shows, over the same period, the ratio of women's earnings to men's earnings among those working full time grew by 23 percentage points.
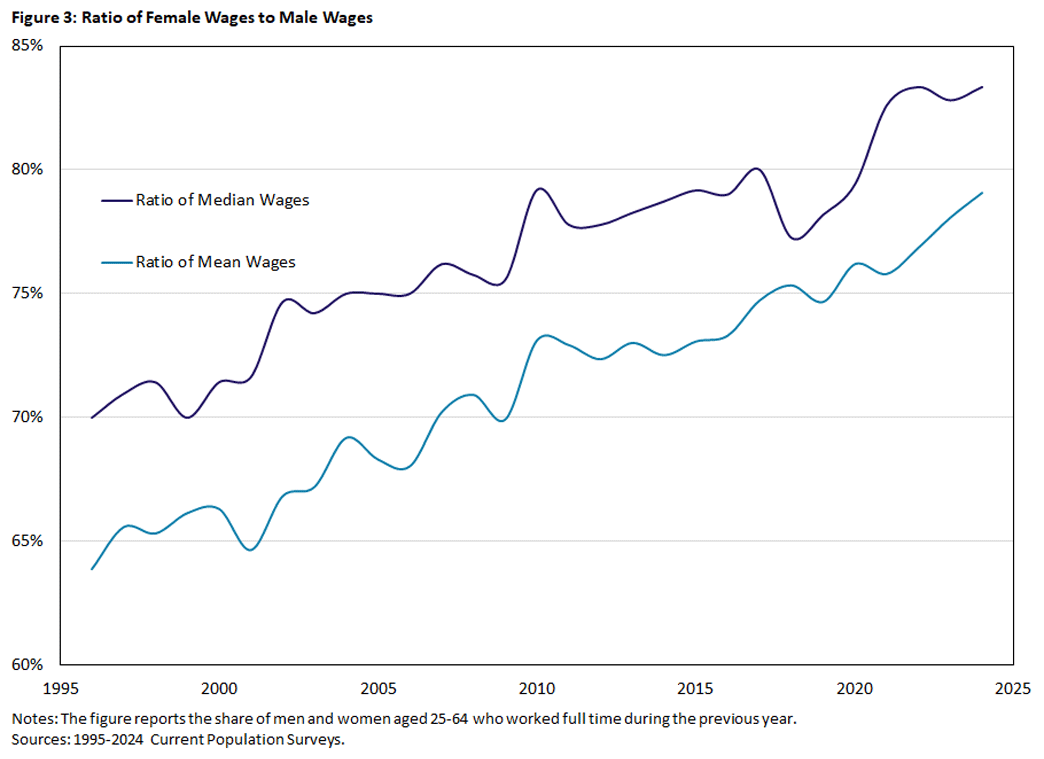
As the earnings and full-time employment rates of women approach those of men, we should expect geographic mobility to fall for a few reasons. First, dual-earner couples with similar incomes would become more common and, as shown in a 2018 working paper, couples with similar earnings are less likely to relocate than those with unequal earnings.3 The paper further estimated that falling wage differences between sexes accounted for over one-third of the drop in family mobility between 1981 and 2012.
Unemployment insurance appears to mitigate this channel. A 2024 working paper estimated that providing unemployment insurance for the trailing spouse — the spouse who gives up a job to accommodate his or her partner's career move — increased the probability that a household moves more than 100 miles by 2.7 percentage points.4
The convergence of earnings and employment between men and women may also increase the need for child care. This in turn could affect geographic mobility by encouraging individuals or couples with children to locate near relatives who can help with child care. For example, a 2024 working paper found that women living within 25 miles of their parents experienced a substantially smaller drop in earnings after having children than those living further away.5
Our own analysis of the data is consistent with the above-described forces being at play. We run regressions to examine the predictors of moving across states for people aged 35-54. Table 1 reports the results.
| (1) | (2) | (3) | |
|---|---|---|---|
| CONSTANT | 0.0387*** | 0.0464*** | 0.0546*** |
| (0.0015) | (0.0018) | (0.0021) | |
| MARRIED, ONE ILF | 0.0096*** | 0.0098*** | 0.0081*** |
| (0.0008) | (0.0008) | (0.0008) | |
| MARRIED, NONE ILF | 0.0234*** | 0.0227*** | 0.0189*** |
| (0.0015) | (0.0015) | (0.0014) | |
| SINGLE, ILF | 0.0067*** | 0.0051*** | -0.0005 |
| (0.0005) | (0.0005) | (0.0005) | |
| SINGLE, NOT ILF | 0.0102*** | 0.0086*** | 0.0021*** |
| (0.0009) | (0.0008) | (0.0006) | |
| YOUNGEST CHILD <18 | -0.0044*** | -0.0037*** | |
| (0.0004) | (0.0004) | ||
| HOMEOWNER | -0.0240*** | ||
| (0.0013) | |||
| R2 | 0.0039 | 0.0041 | 0.0109 |
| OBS. | 1338459 | 1338459 | 1338459 |
| Notes: Data from the 1995-2024 CPS. The sample consists of individuals aged 35-54 whose migration status was not imputed by statistical models. Regressions control for gender, age, race/ethnicity, education and year fixed effects. The reference group captured in the constant consists of married or partnered individuals where both are in the labor force. Robust standard errors are clustered by year. ILF denotes "in labor force." | |||
Relative to the reference group — married or partnered individuals who are both in the labor force — all other groups exhibit higher rates of interstate mobility. Those who are married or partnered with neither person in the labor force have the highest mobility rate. Controlling for child-rearing status and homeownership reduces the mobility gap relative to the reference group, particularly among single individuals.
Population Aging
Because mobility decreases with age, it is not surprising that population aging lowers the average mobility rate. Perhaps more surprising is the finding from a 2017 report that U.S. states with relatively more older workers (ages 40-59) have lower mobility rates at every age.6 To explain this relationship, the report's authors construct a model where firms can recruit locally or from other locations. As the workforce ages and becomes less willing to move, firms redirect their recruitment efforts toward their local markets. This makes it harder for potential movers to find jobs outside their current location, reducing mobility at all ages.
The Distribution of Jobs, Amenities and Housing
It is also possible that the benefits of moving have decreased. In particular, wage differences across U.S. regions appear to have narrowed, as noted in a 2017 paper.7 The paper emphasizes that wage differences for specific jobs — as opposed to average wage differences — typically induce moves: People move to increase the salaries they can receive for the jobs that they can do, rather than because of overall wage differences between regions. Their evidence suggests, however, that wages now vary less across locations even within detailed job groupings, reducing the incentive to move.
Along with a general decline in geographic mobility, there has been increased geographic sorting by education, with highly educated individuals clustering in large cities.8 This sorting is often attributed to what economists call agglomeration economies, or the ability of people to operate more efficiently when large numbers of them are in the same place.
On the producer side, agglomeration economies in particular industries are often credited with the growth of places like Detroit or Silicon Valley. Companies in those industries enjoy access to specialized workers and inputs, along with proximity to new ideas and technologies in their sector. A forthcoming article analyzes the emergence of "cognitive hubs," cities where firms that need workers with nonroutine cognitive skills and highly educated workers who possess these skills congregate together.9 On the consumer side, large cities also tend to offer a wide range of goods and services catering to the diverse preferences of people who live there.10
While many of these locations offer high salaries and urban amenities, they also impose regulations that limit the supply of housing. The resulting high cost of housing in these cities discourages potential workers from migrating to them. In turn, this reduces the ability of workers to reside where they are most productive: A 2019 paper estimates that housing restrictions lowered U.S. GDP growth by 36 percent between 1964 and 2009.11
When housing is limited, an unwillingness to move out on the part of current residents will hinder outsiders from moving in. A 2024 working paper reports that households have become less responsive to housing costs in their current area, concluding that "many households that would have left in response to high home prices several decades ago now choose to stay."12 The paper's authors find this change to be particularly prominent among those who are older, less educated and/or homeowners.
A related trend is the increasing tendency of young adults to live with their parents, due in large part to the high cost of housing.13 Census data show that the fraction of individuals aged 25-34 who live with their parents increased from 10 percent in 2000 to 15 percent in 2023.14
Discussion
The observed decline in migration is best understood as the product of multiple reinforcing causes. Considerations such as the child care needs of working parents or the desire of older households to age in place discourage people from moving. A weaker desire to move decreases migration not only directly but often indirectly by leading firms to emphasize local recruitment or by raising the price of housing. The latter mechanisms are amplified by regulations that limit the supply of housing, which often depress migration on their own. While the literature suggests that much of the migration decline may be a response to the changing needs of households and firms, the role of housing regulations is an area of active research.
John Bailey Jones is a vice president and economist in the Research Department of the Federal Reserve Bank of Richmond, Yue Li is an associate professor of economics at the University at Albany, State University of New York, and Urvi Neelakantan is a senior policy economist in the Research Department of the Federal Reserve Bank of Richmond.
1
Migration can be measured in two ways: gross and net. Gross migration counts all people moving in and out of an area separately. Net migration only counts the difference between those arriving and leaving. It is possible to have concurrent in-migration and out-migration that leaves local populations constant. Recent work suggests that the drop in geographic mobility is not an artifact of measurement, but that gross migration has fallen. Net migration has been fairly stable: See the 2017 paper "Understanding the Long-Run Decline in Interstate Migration" by Greg Kaplan and Sam Schulhofer-Wuhl and the 2023 paper "Labor Mobility and Unemployment Over the Business Cycle" by Andrea Foschi, Christopher House, Christian Proebsting and Linda Tesar.
2
For a recent survey of the literature on household migration, see the 2023 paper "The Economics of Internal Migration: Advances and Policy Questions" by Ning Jia, Raven Molloy, Christopher Smith and Abigail Wozniak.
3
See the 2018 working paper "Dual Income Couples and Interstate Migration (PDF)" by Bulent Guler and Ahmet Ali Taşkın.
4
See the 2024 working paper "Dual Earner Migration, Earnings and Unemployment Insurance (PDF)" by Joanna Venator.
5
See the 2024 working paper "To Grandmother's House We Go: Informal Childcare and Female Labor Mobility (PDF)" by Garrett Anstreicher and Joanna Venator.
6
See the 2014 report "Population Aging, Migration Spillovers and the Decline in Interstate Migration" by Fatih Karahan and Serena Rhee.
7
See the previously cited 2017 paper "Understanding the Long-Run Decline in Interstate Migration."
8
See the 2022 paper "Spatial Sorting and Inequality" by Rebecca Diamond and Cecile Gaubert.
9
See the forthcoming paper "Cognitive Hubs and Spatial Redistribution" by Esteban Rossi-Hansberg, Pierre-Daniel Sarte and Felipe Schwartzman.
10
See the 2021 paper "Are Poor Cities Cheap for Everyone? Non-Homotheticity and the Cost of Living Across U.S. Cities" by Jessie Handbury and the 2021 working paper "Where Is Standard of Living the Highest? Local Prices and the Geography of Consumption" by Rebecca Diamond and Enrico Moretti.
11
See the 2019 paper "Housing Constraints and Spatial Misallocation" by Chang-Tai Hsieh and Enrico Moretti. To the extent that nominal salaries and house prices move in lock step across locations, the spatial variation of real wages will decrease. Migration can still occur, however, to the extent that amenities differ across locations, and tastes for amenities differ across individuals. The previously cited 2017 paper "Understanding the Long-Run Decline in Interstate Migration" argues that cheaper travel and improved information technology have weakened the power of these amenity-based incentives.
12
See the 2024 working paper "The Determinants of Declining Internal Migration" by William Olney and Owen Thompson.
13
For example, see the 2023 paper "Why Do Young Adults Coreside With Their Parents?" by Arthur Acolin, Desen Lin and Susan Wachter.
14
See the table AD-3, by Age Group: 25-34 Years Old from the Census Bureau.
To cite this Economic Brief, please use the following format: Jones, John Bailey; Li, Yue; and Neelakantan, Urvi. (May 2025) "Why Is Geographic Mobility Declining?" Federal Reserve Bank of Richmond Economic Brief, No. 25-19.
This article may be photocopied or reprinted in its entirety. Please credit the authors, source, and the Federal Reserve Bank of Richmond and include the italicized statement below.
Views expressed in this article are those of the authors and not necessarily those of the Federal Reserve Bank of Richmond or the Federal Reserve System.
Subscribe to Economic Brief
Receive a notification when Economic Brief is posted online.
Contact Us