Forecasting U.S. Productivity
Economic Brief
August 2025, No. 25-30
Key Takeaways
- Trend aggregate labor productivity and TFP growth are expected to increase over the rest of the decade.
- The three largest subsectors of the service economy — namely professional business services; finance, insurance and real estate; and education and health care — are expected to continue growing in the medium term, and their idiosyncratic productivity is expected to play an increasingly important role in aggregate productivity.
U.S. economic activity invariably fluctuates from quarter to quarter or year to year, but how does it fluctuate over longer periods? In this article, we address the underlying nature of this activity over the long term.
In particular, we present trend forecasts of U.S. productivity growth conditional on observed postwar (1947-2021) historical trends that abstract from the continual ups and downs of the business cycle. We discuss the low-frequency behavior of aggregate labor productivity and total factor productivity (TFP) along with their constituent sectoral counterparts. We further discuss the long-term behavior and role of sectoral value-added shares used in aggregating sectoral productivity into aggregate productivity.
Trend forecasts in this article are constructed using versions of the long-run prediction methods developed by Ulrich Müller and Mark Watson in the 2016 paper "Measuring Uncertainty About Long-Run Predictions." Applications of these methods can also be found in my (Pierre's) forthcoming working paper "The Past and Future of U.S. Structural Change: Compositional Accounting and Forecasting," co-authored with Andrew Foerster, Andreas Hornstein and Mark Watson. Given historical data on a variable (such as TFP growth), these methods produce a joint distribution of both estimates of historical trends and their forecasts. In this article, the definition of trend incorporates the components of an economic time series with periods longer than approximately 20 years.
Our findings indicate that trend forecasts of both aggregate labor productivity growth and TFP growth are expected to increase over the rest of the decade. Figure 1 shows the trend growth rate of labor productivity (in blue) and its trend forecast (in red).1
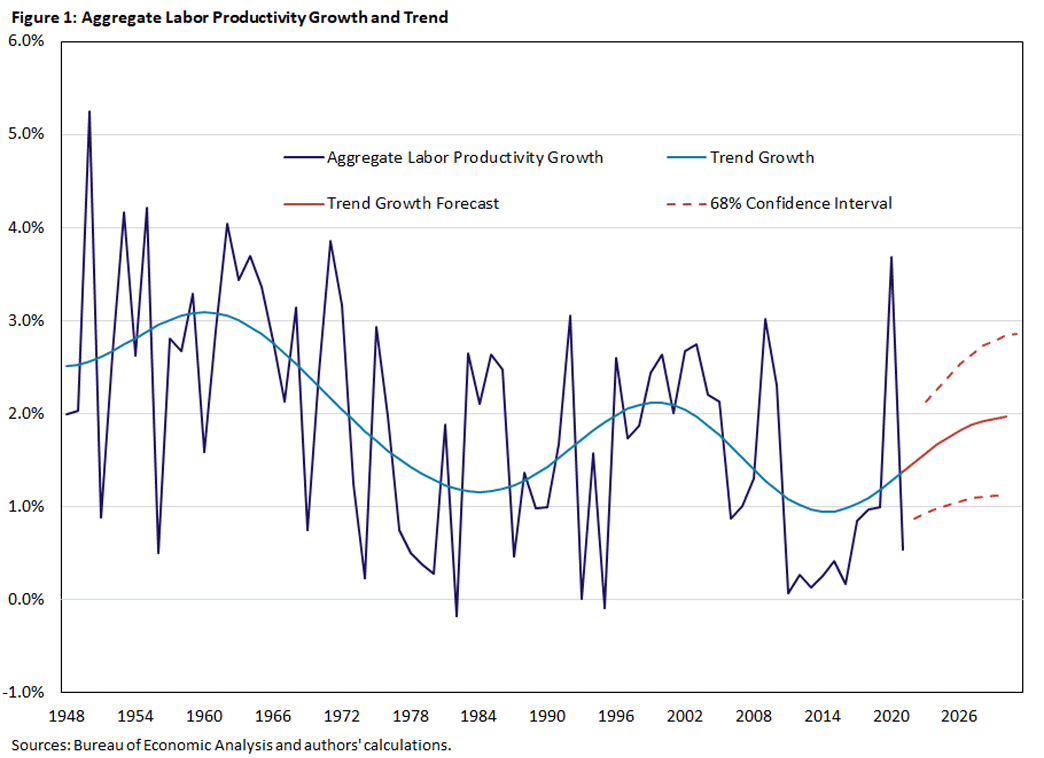
Trend aggregate labor productivity growth is estimated to be 2.5 percent at the beginning of the sample. This estimate then gradually declines to around 1.4 percent in 2021. Since our sample ends in 2021, we begin forecasting the trend growth rate of labor productivity after that point and find that it increases over the rest of the decade, reaching a growth rate of 2.0 percent in 2030.
Similarly, trend aggregate TFP growth began the postwar period at 1.3 percent before gradually declining to 0.6 percent in 2021, as seen in Figure 2. Trend TFP growth is then forecast to also increase, reaching 0.9 percent in 2030.
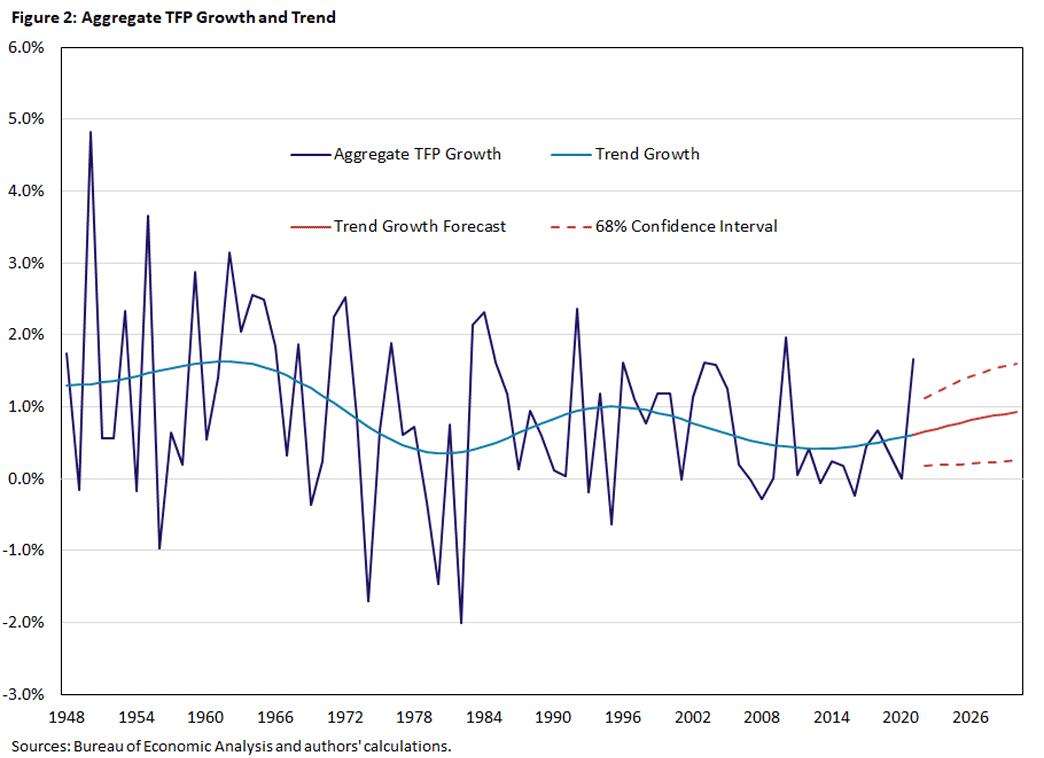
The expected paths of trend labor productivity and TFP growth in Figures 1 and 2 imply smaller point-to-point differences from the beginning of the postwar period to the end of the 2020s than at most dates in the sample. These forecasts further indicate end-of-decade trend aggregate productivity growth roughly in line with that of the early 1970s.
More generally, the behavior of aggregate productivity growth reflects a weighted average of its constituent sectoral counterparts. That is, it reflects productivity growth in different underlying production sectors with weights given by their corresponding value-added shares. In this article, we consider five sectors:
- Construction
- Durable goods
- Intellectual property products (IPP) services
- Nondurable goods
- Services
We draw a distinction between IPP services (which encompasses activities that serve mainly as inputs into production, such as research and development, and computer system designs) and all other services (which serve mainly as final consumption).
Thus, we now explore a comprehensive sector-by-sector characterization of trend growth in productivity for the period 2021-30. Table 1 shows average trend forecasts for labor productivity growth and TFP growth, as well as each sector's value-added shares.
| Construction | Durable Goods | IPP Services | Nondurable Goods | Services | |
|---|---|---|---|---|---|
| Labor Productivity | 0.12 | 3.33 | 2.64 | 2.68 | 1.22 |
| TFP | -0.13 | 2.19 | 1.32 | 1.02 | 0.49 |
| Value-Added Shares | 0.04 | 0.06 | 0.14 | 0.07 | 0.69 |
| Sources: Bureau of Economic Analysis and authors' calculations. | |||||
| Construction | Durable Goods | IPP Services | Nondurable Goods | Services | |
|---|---|---|---|---|---|
| Labor Productivity | 0.36 | 3.58 | 2.40 | 3.20 | 1.19 |
| TFP | 0.13 | 2.36 | 1.01 | 1.52 | 0.50 |
| Value-Added Shares | 0.04 | 0.11 | 0.08 | 0.14 | 0.62 |
| Sources: Bureau of Economic Analysis and authors' calculations. | |||||
Productivity in the construction sector is expected to be relatively unchanged, with average trend growth rates of labor productivity growth and TFP growth around 0.12 percent and -0.13 percent, respectively, compared to 0.36 percent and 0.13 percent during the postwar period. That said, this continued decline in labor productivity and TFP growth would have little effect on aggregate productivity, as the value-added share of construction is forecast to remain relatively small (around its postwar average of 4 percent). This finding speaks to the various factors that underlie "the strange and awful path of productivity in the construction sector," as discussed in the 2023 article of that name by Austan Goolsbee and Chad Syverson.
In the durable goods sector, trend labor productivity growth and TFP growth are expected to fall, as is its share of GDP. Average postwar trend productivity and TFP growth rates have been high compared to other production sectors at around 3.58 percent and 2.36 percent, respectively, but they are expected to decline to 3.33 percent and 2.19 percent in the next decade. This sector is also expected to see its trend share of GDP fall to an average of 6 percent for the 2020s, ending at a historical low of 5 percent in 2030.
After exhibiting trend labor productivity growth of 2.4 percent over the postwar period, IPP services are expected to become more productive in the current decade, with trend growth increasing to 2.64 percent over the 2020s. Moreover, trend TFP growth in that sector is also expected to increase to an average rate of 1.32 percent from a postwar trend growth rate of 1.01 percent. These increases in trend productivity growth are expected to further buoy aggregate productivity, as the share of IPP services in GDP is also forecast to rise to 14 percent by 2030.
Characterized by steadily falling labor productivity historically, the nondurable goods sector has nevertheless not hampered aggregate productivity growth, as its share of the economy has also simultaneously been declining (from 14 percent postwar average to 7 percent over the rest of the decade). However, the tides are expected to turn as that sector's trend labor productivity growth is expected to increase from its end of sample growth rate of -5.3 percent to a forecasted average of 2.68 percent by 2030 and its TFP growth is expected to increase to a forecasted average of 1.02 percent from -4.8 percent by 2030.
As discussed in our 2025 article "Sectoral Determinants of Aggregate Productivity Growth," the services sector continues to be the primary driver of aggregate economic behavior. Over the postwar period, trend labor productivity in the sector grew at an average rate of 1.19 percent, and trend TFP grew at an average of 0.50 percent. These productivity growth numbers are comparatively low relative to those of other sectors and often cause services to be the prime example of Baumol's Cost Disease.2 That said, over the 2020s, forecasts of trend labor productivity growth increase to an average of 1.22 percent, while those of TFP growth remain essentially unchanged.
Contributions to Aggregate Productivity Growth
Figure 3 provides a yearly breakdown of trend labor productivity growth forecasts.3 The first bar represents the average trend growth rate of each sector's contribution to aggregate labor productivity over the whole postwar period. Successive columns show each sector's expected contribution to the trend forecast of labor productivity growth — or each sector's productivity growth times its corresponding share of GDP — for the individual years 2025-2030.4
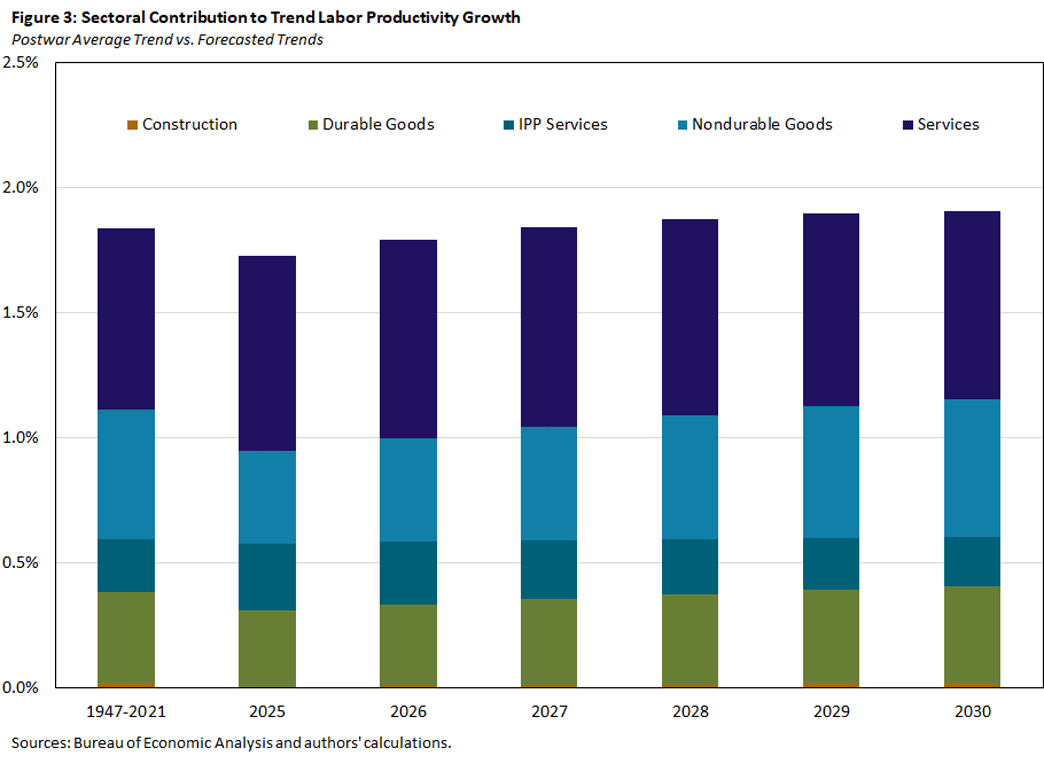
By the end of the 2020s, aggregate trend labor productivity growth is expected to be around its postwar average, driven primarily by labor productivity and TFP growth in services and nondurable goods. Durable goods and nondurable goods are both expected to contribute more than IPP services to aggregate trend productivity growth, with both sectors also seeing increasing contributions. This is because while their shares in GDP are declining and that of IPP services is increasing, productivity growth in the goods sectors is notably higher than in IPP services.
Taking a more disaggregated view of the services sector, on average over the postwar period, around half of that sector is made up of three subsectors:
- Finance, insurance and real estate (FIRE)
- Professional business services (PBS)
- Education and health care (EHC)
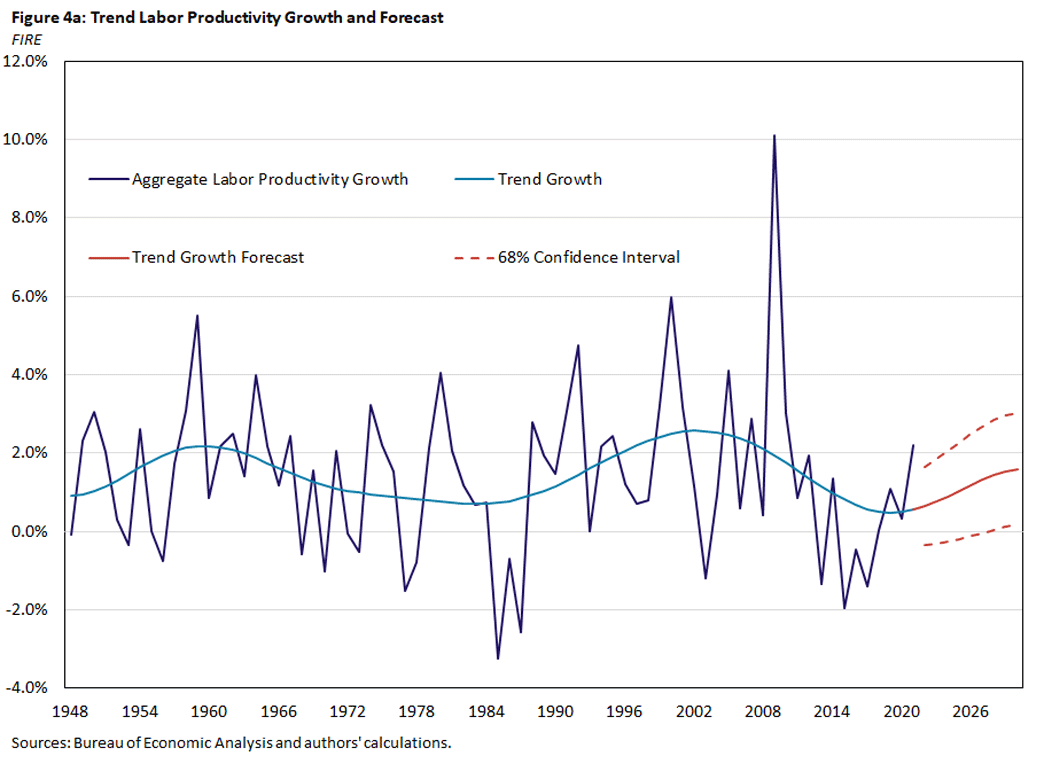
Over the next decade, the FIRE, PBS and EHC subsectors are forecast to account for nearly two-thirds of services and half of GDP. These areas are expected to see their trend labor productivity growth rates go from postwar averages of 1.65 percent, 1.42 percent and 0.93 percent, respectively, to 2.18 percent, 1.15 percent and 1.03 percent on average from 2021-30. Figure 4 shows the forecasts for these subsectors' labor productivity growth rates through the end of the decade.
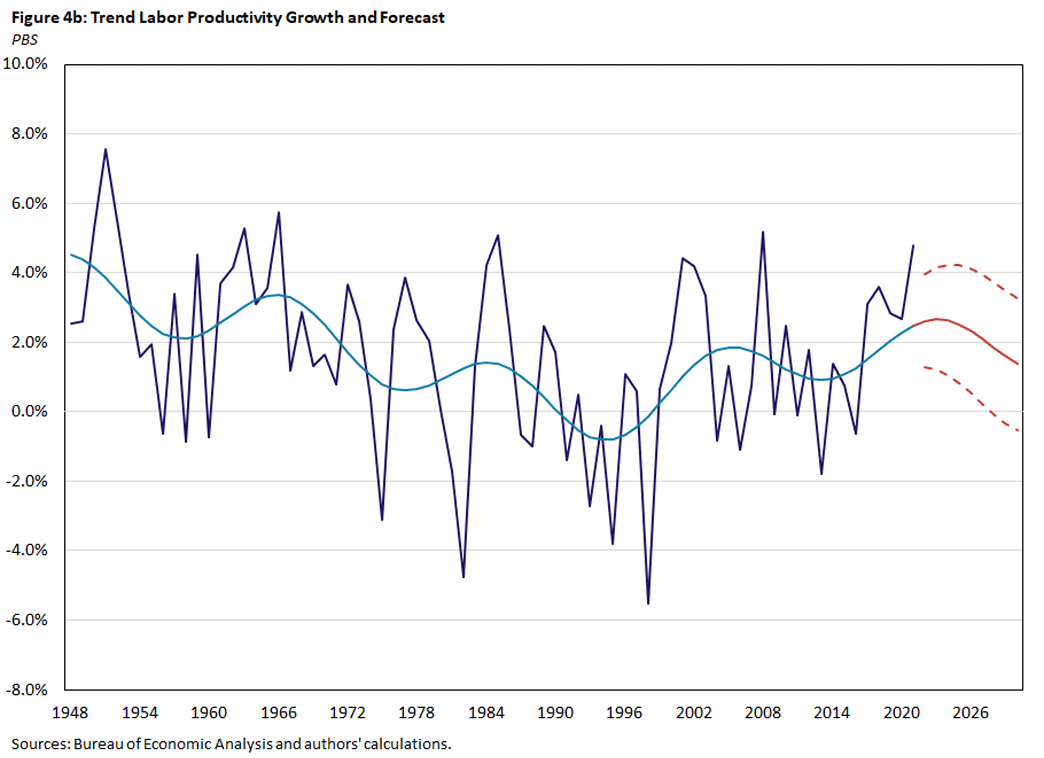
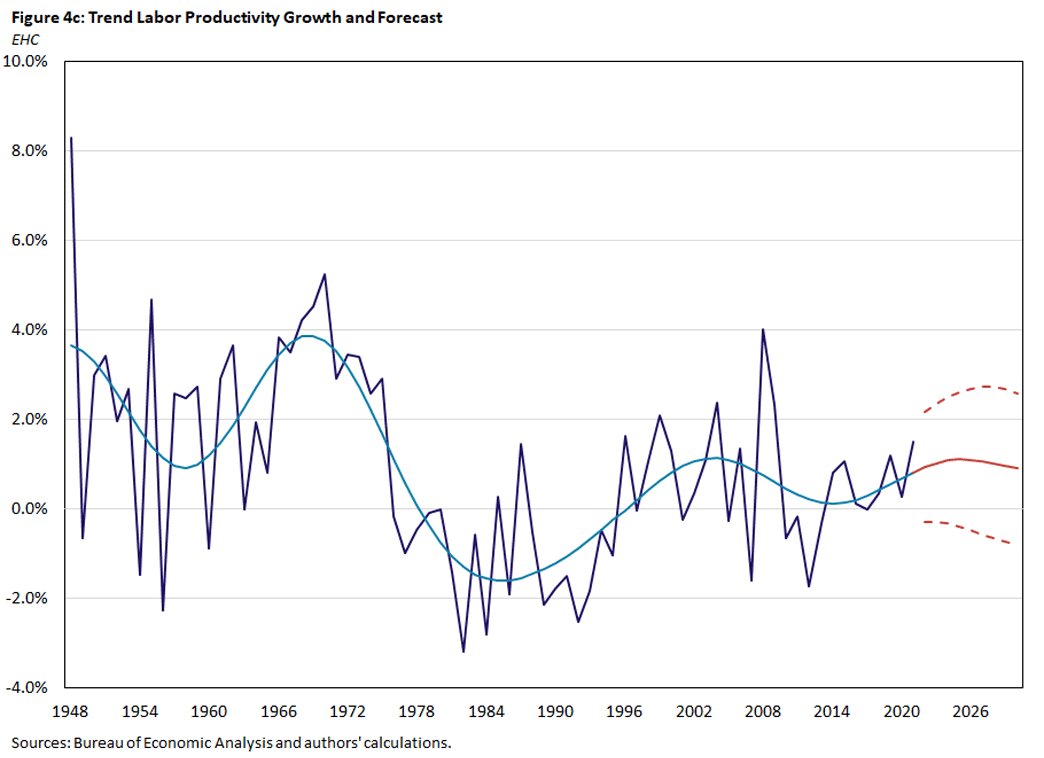
Since the aggregate productivity growth implications of different sectors depend not only on productivity growth in these sectors but also on their shares in the economy, Table 2 shows the postwar average trend contributions from these three services subsectors to aggregate labor productivity growth, as well as their average contributions to aggregate trend forecasts. Table 2 indicates that FIRE will contribute less, on average, over the decade to aggregate labor productivity growth than its postwar average, while PBS and EHC are expected to contribute to a greater extent.
| FIRE | PBS | EHC | |
|---|---|---|---|
| Postwar Mean | 0.23 | 0.11 | 0.03 |
| Forecast Mean | 0.19 | 0.17 | 0.04 |
| Sources: Bureau of Economic Analysis and authors' calculations. | |||
Finally, Figure 5 illustrates yearly forecasts of the contributions of each of these subsectors' contributions to trend aggregate productivity growth, juxtaposed with their postwar average trends.5 In other words, we break down the services portion of the bars in Figure 3.
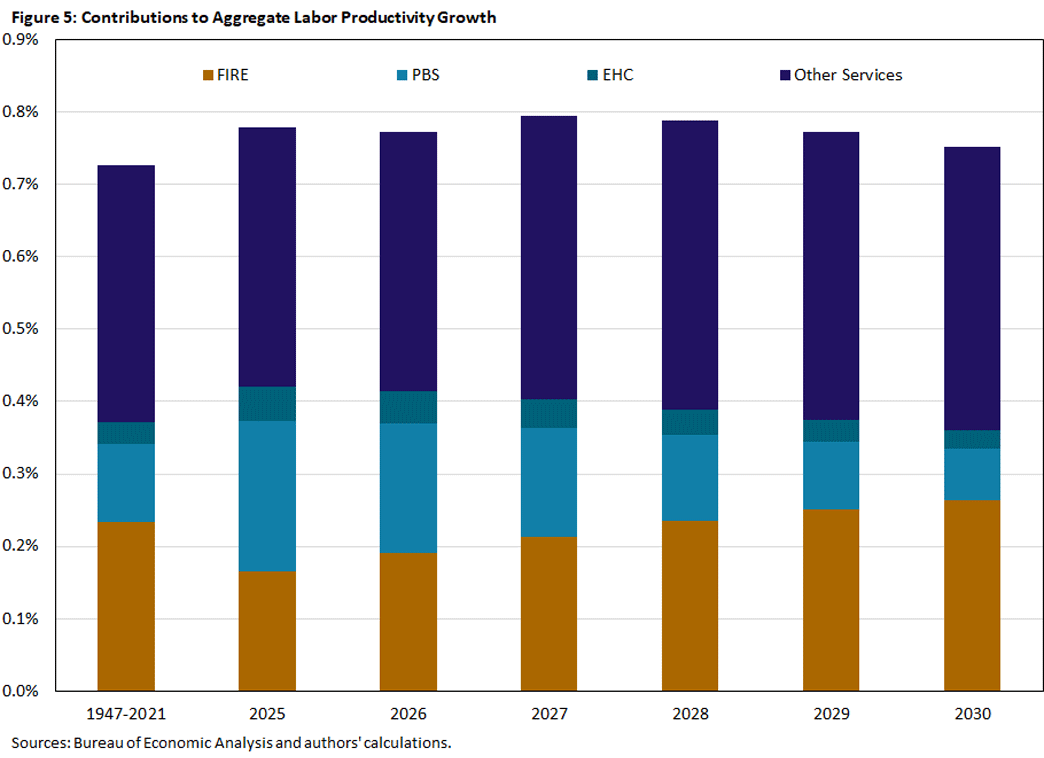
Notable in this figure is the increasing contribution from the FIRE subsector and the falling contributions from the PBS and EHC subsectors. The rising trend contribution from FIRE is attributable to its rising growth rate. However, it will have a lower average contribution than its postwar average because (as Figure 4 shows) the trend growth rate of FIRE is starting from a historically low level. Figure 5 also illustrates that the falling contributions of PBS, EHC and (after 2027) other services6 are responsible for the decreasing (but higher than average) yearly trend contribution of services to aggregate trend productivity growth.
Summary
Looking through the ups and downs of the business cycle, this article explores forecasts of trend U.S. productivity over the rest of the decade. These forecasts suggest that aggregate labor productivity and TFP growth will both increase throughout the rest of the decade and that services and IPP services will continue occupying a larger share of the GDP.
Furthermore, in forecasting trend behavior both across primary sectors and in the aggregate, we find that the future of U.S. productivity is driven primarily by both increasing growth rates in productivity and value-added shares in the services sector, as well as continued high productivity growth in nondurable goods.
Finally, the increasing growth rate of the services sector is attributable to three large subsectors (with either high or increasing growth rates) that will continue to occupy more of the services sector.
Pierre-Daniel Sarte is a senior advisor and Jack Taylor is a research associate, both in the Research Department at the Federal Reserve Bank of Richmond.
1
The dashed lines indicate 68 percent confidence intervals.
2
As we noted in our previous article, Baumol's Cost Disease is the notion that a sector with low productivity but an increasing share in production will bring down productivity in the aggregate.
3
While close, these contributions do not exactly match. In this exercise, we forecast separate contributions, and the sum of the forecast contributions can differ from the aggregate forecasts.
4
A sector's contribution to aggregate labor productivity growth is defined as the sector's own growth rate times its value-added share. The sum of every sector's contribution then yields aggregate productivity growth. We proceed as if forecasting each contribution in isolation. The required adjustments when forecasting jointly (since shares necessarily comove) follows from the aforementioned paper "Measuring Uncertainty About Long-Run Predictions" and my (Pierre's) 2022 paper "Aggregate Implications of Changing Sectoral Trends," co-authored with Andrew Forrester, Andreas Hornstein and Mark Watson.
5
See footnote 4, which applies to this forecast as well.
6
The "other services" subsector includes mainly the food and accommodation, transportation, and recreation subsectors.
To cite this Economic Brief, please use the following format: Sarte, Pierre-Daniel; and Taylor, Jack. (August 2025) "Forecasting U.S. Productivity." Federal Reserve Bank of Richmond Economic Brief, No. 25-30.
This article may be photocopied or reprinted in its entirety. Please credit the authors, source, and the Federal Reserve Bank of Richmond and include the italicized statement below.
Views expressed in this article are those of the authors and not necessarily those of the Federal Reserve Bank of Richmond or the Federal Reserve System.
Subscribe to Economic Brief
Receive a notification when Economic Brief is posted online.
Contact Us