Bank Liquidity and Financing of Nonbank Mortgage Companies
Economic Brief
August 2025, No. 25-33
Key Takeaways
- Nonbank mortgage companies (NMCs) are directly funded by banks and have significantly expanded their shares of the residential mortgage market.
- Bank liquidity helps drive the warehouse credit market for NMCs financing.
- We examine the COVID-19 shock and the subsequent boom in the mortgage market and find that banks with ex-ante higher liquidity expanded less aggressively in supplying credit to NMCs. This lower credit expansion is stronger for smaller NMCs with fewer banking relationships.
Nonbank mortgage companies (NMCs) have become increasingly important players in the mortgage market. These intermediaries finance their assets — mortgages held for sale (MHFS) and mortgage servicing rights (MSRs) — with warehouse lines of credit. This type of funding provides contingent liquidity during the short period between the origination of a mortgage and the sale or securitization of such an asset in the secondary market.1 The main providers of warehouse lines of credit are a handful of large banks with average assets of $100 billion.
Some have raised concerns regarding solvency and liquidity risks of NMCs stemming from their close financing ties with the banking sector. In this article, we explore how shocks to the banking system affect NMCs through warehouse lines of credit.
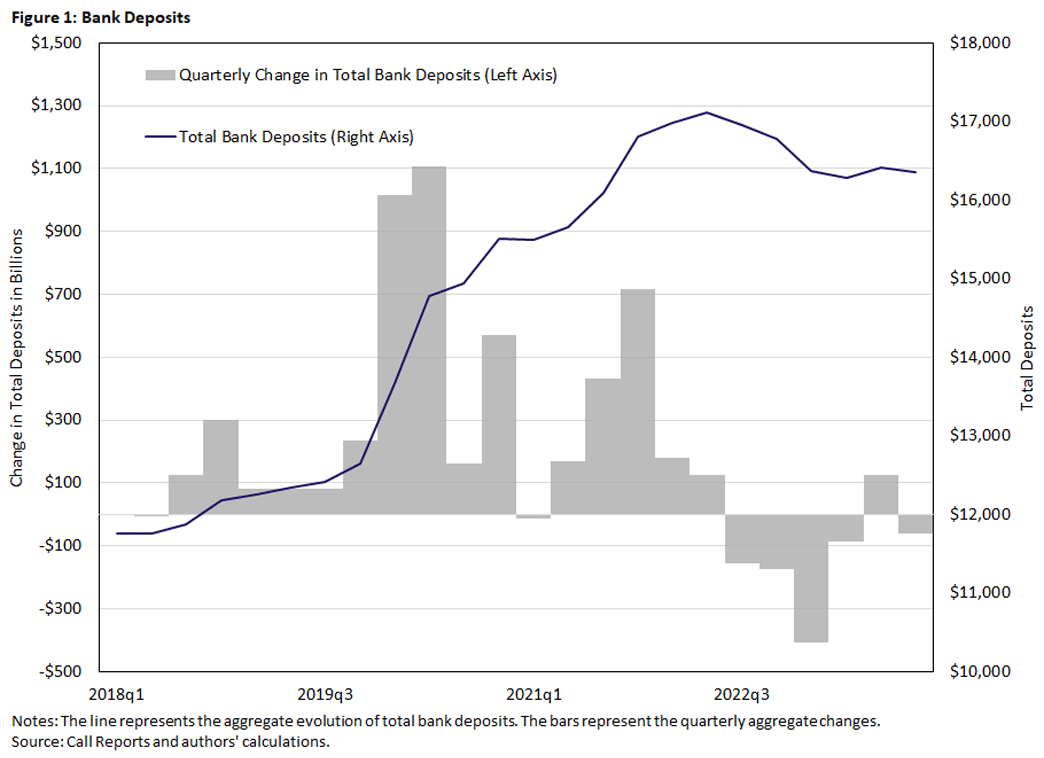
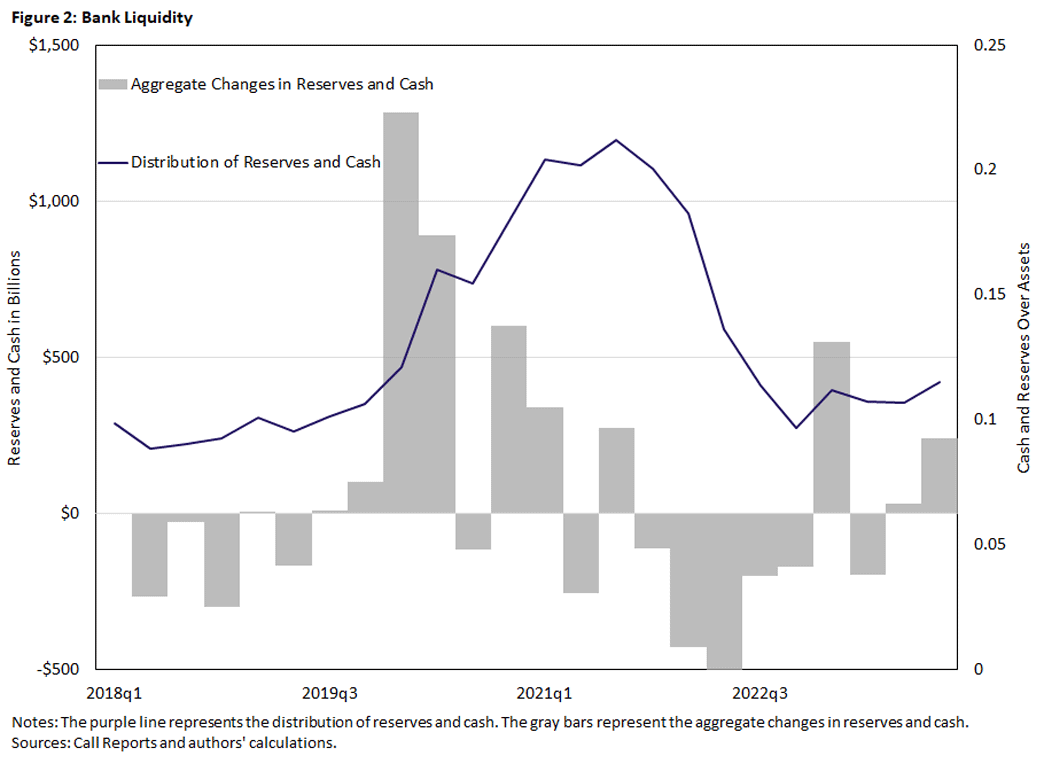
We focus on the COVID-19 shock, which led to financial market disruptions and a short-lived but deep recession. In turn, this prompted concerns about a potential increase in mortgage defaults, which could also put stress on originators and servicers' businesses. However, unprecedented fiscal and monetary stimuli instead led to an unexpected boom in the mortgage market. Near-zero interest rates led to a surge in demand for mortgage refinancing, and an increased pace of quantitative easing (QE) flooded banks with liquidity, which was partially diverted to the market for NMC funding. Between January and June 2020, deposits surged from about $13 trillion to $15 trillion (Figure 1), and bank reserves and cash positions also increased (Figure 2) due to QE.
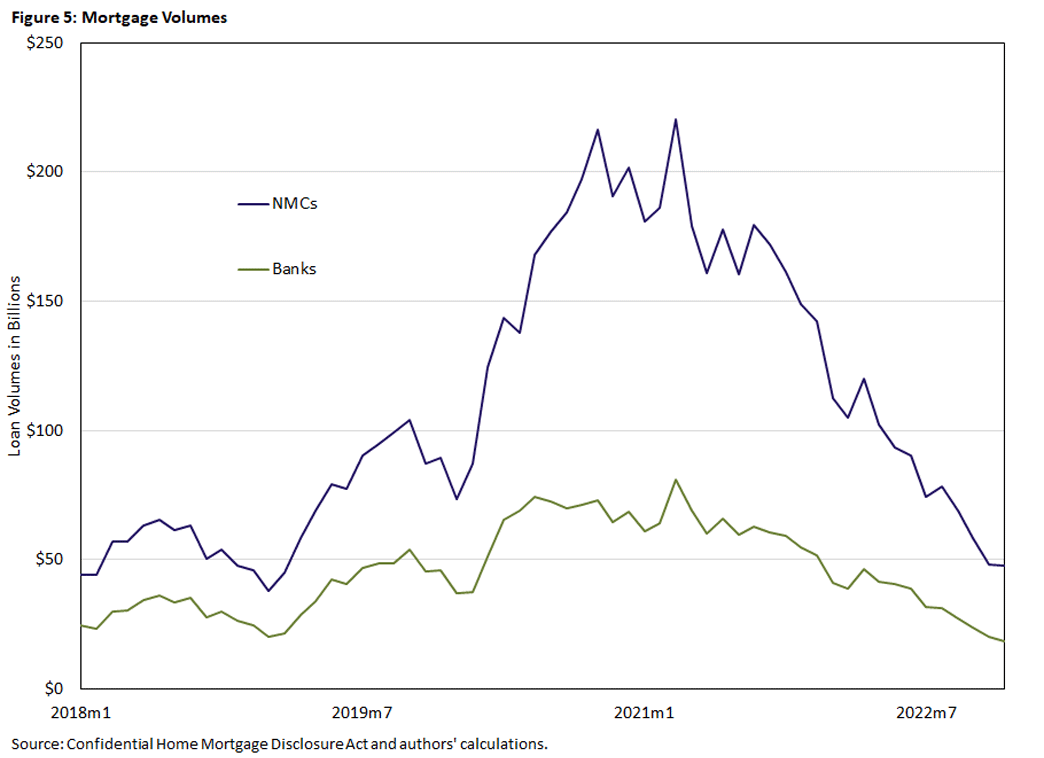
At the same time, credit lines to NMCs rose significantly from $125 billion at the beginning of 2020 to $200 billion at the end of the year. The expansion of credit lines was accompanied by an unprecedented refinancing boom: Monthly mortgage originations by NMCs rose from $75 billion at the beginning of 2020 to $200 billion by the end. Understanding how liquidity flows were redirected to NMCs and whether financing frictions might be at work is important for understanding the mortgage market boom and any policy lessons that might apply to the market for NMCs' financing.
Institutional Background
The Mortgage Market in 2020-21
In March 2020, liquidity pressures re-emerged in the mortgage market. The economic downturn and subsequent spike in unemployment raised concerns about potential increases in mortgage defaults. Financial markets were also volatile, and mortgage originators faced up to $5 billion in higher margin calls on to-be-announced hedges.2
The federal government and the Federal Reserve quickly responded. In terms of fiscal interventions, the Coronavirus Aid Relief and Economic Security (CARES) Act contributed to stabilizing the mortgage market.3 A 2021 paper shows that the CARES Act resulted in a spike in debt forbearance without a commensurate increase in delinquency rates.4 The high uptick in forbearance raised concerns that NMCs would not have the liquidity to advance funds to investors on behalf of borrowers in forbearance. In response, the Federal Housing Finance Agency and Ginnie Mae set up liquidity assistance measures for servicers in GSE and Ginnie Mae pools.
Also in March 2020, the Fed reduced short-term interest rates to almost zero and increased its purchases of agency mortgage-backed securities (MBS) and Treasury securities. The monthly pace of purchases in the following months was unprecedented, exceeding the QE programs introduced after the global financial crisis. Between March and May, the Fed purchased about $2.1 trillion in Treasurys and MBS. As market conditions improved starting in June 2020, the Fed reduced monthly purchases to $80 billion in Treasurys and $40 billion in MBS per month until October 2021.
The combination of lower interest rates and higher liquidity injections through QE led to a mortgage boom and a surge in house prices of more than 20 percent. The mortgage boom was mainly driven by higher refinancing activity of high-income and superprime borrowers.5 Despite the historic proportions of the refinancing boom, a 2021 paper documents an incomplete passthrough of lower interest rates to mortgage borrowers due to capacity constraints and operational frictions of credit supply.6 The boom vanished in 2022 after the Fed increased rates and house prices declined progressively.
Bank Liquidity and the Market for Warehouse Credit Lines
In March 2020, nonfinancial firms experienced cash flow disruptions and drew down unprecedented amounts of credit lines,7 and the banking system was short in its ability to provide liquidity. A pair of recent works show that unused credit line capacity is held by large firms that drew down the majority of credit following the pandemic, putting pressures on bank balance sheets and crowding out lending to smaller firms.8
Prompt and unprecedented fiscal and monetary policy interventions helped banks satisfy liquidity demands. In two quarters, bank deposits grew by 15.4 percent (or $2 trillion), as seen in Figure 1. This huge deposit inflow is related to several factors, including:
- Households' precautionary savings triggered by concerns about job market prospects9
- Firms' dash-for-cash (or firms drawing down credit lines and depositing the liquidity in the bank)10
- Fiscal stimulus
- The Fed's QE program
The Fed implemented QE by purchasing securities from authorized primary dealers by crediting reserve balances to the accounts of banks associated with the dealers' counterpart.11 If the ultimate seller of these securities was a bank, securities were swapped with reserve balances, and the bank balance sheet did not grow.
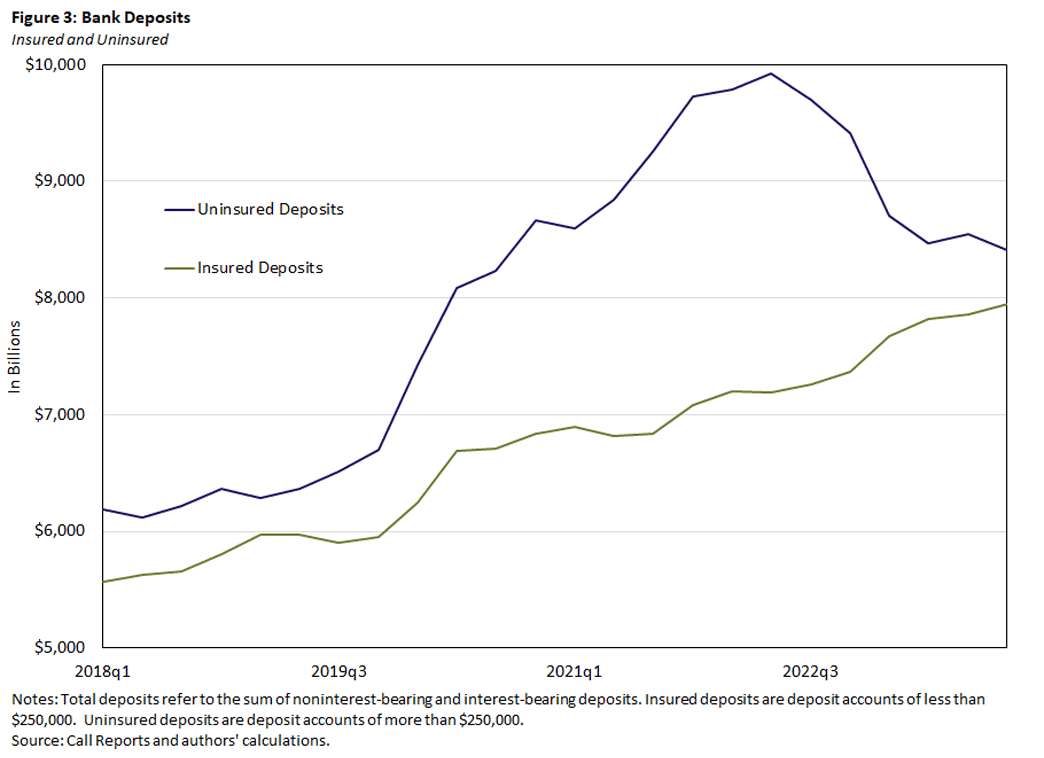
In most cases, however, the ultimate seller of the securities was not a bank. Instead, the Fed credited reserve balances to the accounts of the nonbank's correspondent bank, which then credited a deposit to the nonbank seller. This translates to an expansion of demand deposits on the liability side, especially uninsured deposits such as checking accounts that depositors can withdraw anytime, as shown in Figure 3. At the same time, reserves mechanically increased on the asset side, indicating that the monetary stimulus increased the aggregate liquidity of the banking sector, as previously seen in Figure 2.
Banks responded to the large liquidity injection by accommodating the demand for liquidity from the corporate sector and originating off-balance-sheet liabilities in the form of lines of credit. Both demand deposits and lines of credit are claims on bank liquidity and require a stock of liquid assets (that is, reserves and cash) to appropriately manage liquidity risk. Therefore, cash and reserve positions are central for the ability of banks to provide credit lines. Indeed, a 2000 paper shows that the effects of monetary policy changes on lending are stronger for initially liquidity-constrained banks, which has been confirmed by several subsequent papers.12
In our empirical analysis, we hypothesize that banks that were less liquid before the shock experienced a larger relaxation of their liquidity constraints, allowing them to further increase their lending relative to less liquidity-constrained depository institutions. This should also apply to banks' loan supply to NMCs. These institutions' demand for credit is cyclical and negatively correlated with the level of interest rates: Lower interest rates stimulate the mortgage market and the demand for credit from those institutions.
Market for Warehouse Lines of Credit
Unlike banks, NMCs cannot access insured deposit funding and are not required to maintain capital and liquidity buffers. Their primary sources of financing are warehouse lines of credit, as they cannot obtain liquidity from the Fed or the Federal Home Loan Banks. Their funding structures expose them to liquidity shocks in the banking market.
Warehouse lines of credit are short term in nature and are used to finance MHFS. Each originated mortgage is temporarily pledged as collateral to warehouse lenders until it is sold in the secondary market. Warehouse credit lines can be quickly increased or cancelled, and lenders can require additional features on the characteristics of the mortgages pledged as collateral. MSRs can also be pledged as collateral, but the lender might require margin calls, and these instruments may be repriced or even cancelled following interest rate fluctuations.
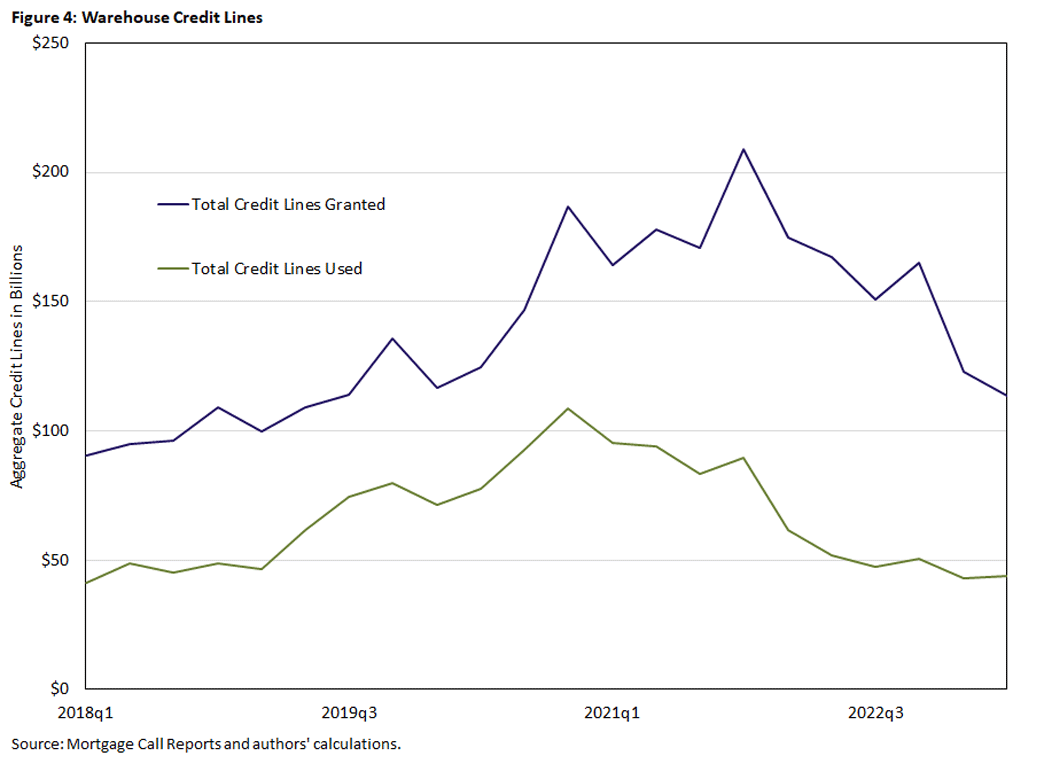
The volumes of warehouse credit lines in the system follow the dynamics of the mortgage market. Figure 4 shows the aggregate volumes of warehouse credit lines, while Figure 5 shows the aggregate origination volumes for NMCs and banks. The total amount of warehouse credit committed rose quickly from $120 billion in the third quarter of 2019 to nearly $225 billion at the peak of the mortgage credit market boom in the fourth quarter of 2021.13 On average, the amount used is 60 percent of the total amount committed, and it remained fairly stable throughout the period.
Despite some concerns about the ability of the banking system to supply contingent liquidity, credit flowed downhill to NMCs. The spike in forbearance granted to mortgage borrowers by the CARES Act had a very limited effect on the market for warehouse financing. The concern rapidly eased after the FHFA announcement that GSEs would purchase mortgages already in forbearance.14 Despite this effect, a few papers document that NMCs facilitated less forbearance than banks.15 To limit the risk of liquidity shortages of servicers, some lenders imposed stricter terms on warehouse credit lines.16
The sustained mortgage volumes in the second half of 2020 and all of 2021 increased NMC profits and strengthened their balance sheets, and the warehouse credit market expanded with the downstream mortgage origination of NMCs until monetary policy tightened in the first quarter of 2022. In an environment of increasing interest rates, the demand for mortgages decreased, and thus warehouse credit lines began falling.
Data
We assemble a unique dataset covering the bank-NMCs warehouse credit line relationship. Our dataset is the result of manually merging credit-level information from the residential mortgage loan activity segment of mortgage call reports with bank balance sheet data from FDIC call reports. We enrich our dataset with NMC balance sheet information from the financial condition segment of mortgage call reports.
The average committed credit line is $123.1 million, while the amount used is roughly 60 percent, or $69.7 million.17 The average NMC has 3.7 credit lines, with 15 percent of observations (typically the smaller ones in terms of assets) having only one credit line per NMC. Figure 6 shows the distribution of credit lines across NMCs, where most NMCs have a diversified funding structure with more than three lenders providing credit.18
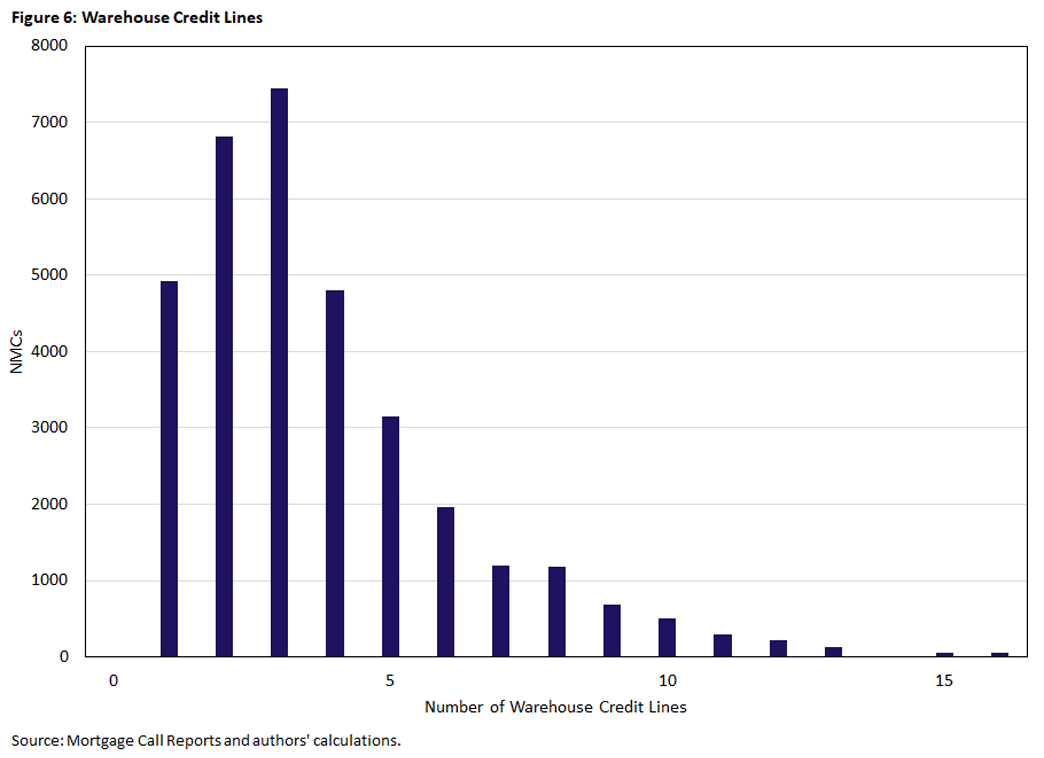
Table 1 reports summary statistics at the NMC level, showing that the share of equity capital over total assets is 23 percent for the average NMC, while MSRs are 25 percent of total book equity.19 MHFS is the main asset group in NMCs balance sheets, accounting for an average of 72 percent of total assets.20 These mortgages usually collateralize warehouse credit lines and are sold after origination in the secondary market.
| Observations | Mean | Standard Deviations | 25th Percentile | 50th Percentile | 75th Percentile | |
|---|---|---|---|---|---|---|
| Credit Line Limit (in Millions) | 9,779 | 123.1 | 351 | 32.1 | 139 | 571 |
| Credit Line Used (in Millions) | 9,779 | 69.7 | 98.8 | 15 | 45 | 100 |
| Number of Credit Lines | 9,779 | 3.644 | 2.421 | 2 | 3 | 5 |
| Total Assets (in Billions) | 9,779 | 1.21 | 6.9 | 0.15 | 0.45 | 1 |
| Log. Total Assets | 9,779 | 18.52 | 2.72 | 17.36 | 18.77 | 20.18 |
| Equity Capital Over Assets | 9,577 | 0.23 | 0.19 | 0.12 | 0.16 | 0.25 |
| MSR Over Equity | 9,577 | 0.25 | 0.39 | 0 | 0.05 | 0.37 |
| MHFS Over Assets | 7,340 | 0.72 | 0.19 | 0.65 | 0.78 | 0.84 |
| Cash Over Assets | 9,515 | 0.11 | 0.16 | 0.036 | 0.06 | 0.11 |
| Origination Income Over Assets | 9,451 | 0.12 | 0.38 | 0.07 | 0.02 | 0.04 |
| Source: Call reports and authors' calculations. | ||||||
In Table 2, we report summary statistics of the sample of warehouse banks. The average bank has $109 billion in total assets with a higher standard deviation than NMCs, meaning that the sample contains all the largest banks in terms of total assets.
| Observations | Mean | Standard Deviations | 25th Percentile | 50th Percentile | 75th Percentile | |
|---|---|---|---|---|---|---|
| Total Assets (in Billions) | 822 | 109 | 373 | 3.5 | 10.5 | 39.8 |
| Log. Total Assets | 822 | 16.414 | 1.862 | 15.08 | 16.173 | 17.5 |
| Book Equity Over Assets | 820 | 0.115 | 0.027 | 0.097 | 0.112 | 0.13 |
| Insured Deposits Over Deposits | 798 | 0.493 | 0.15 | 0.395 | 0.491 | 0.583 |
| Uninsured Deposits Over Deposits | 798 | 0.522 | 0.151 | 0.426 | 0.524 | 0.629 |
| Cash and Reserves Over Assets | 817 | 0.122 | 0.117 | 0.038 | 0.08 | 0.165 |
| Cash Over Assets | 815 | 0.072 | 0.065 | 0.027 | 0.049 | 0.095 |
| Reserves Over Assets | 817 | 0.05 | 0.054 | 0.01 | 0.031 | 0.068 |
| MBS Over Assets | 822 | 0.047 | 0.052 | 0.011 | 0.031 | 0.062 |
| Gov. Securities Over Assets | 820 | 0.052 | 0.062 | 0.011 | 0.037 | 0.062 |
| RE Loans Over Assets | 822 | 0.42 | 0.163 | 0.315 | 0.44 | 0.536 |
| C&I Loans Over Assets | 816 | 0.142 | 0.081 | 0.08 | 0.135 | 0.196 |
| Consumer Loans Over Assets | 814 | 0.038 | 0.062 | 0.004 | 0.014 | 0.054 |
| ROA | 822 | 0.026 | 0.034 | 0.015 | 0.028 | 0.041 |
| Source: Call reports and authors' calculations. | ||||||
Results
In this section, we discuss econometric specifications and report results. We first exploit within-NMC variation that enables us to control for loan demand effects and to study the intensive margin of bank credit supply to nonbanks. We then collapse the data at the NMC level and examine whether a bank funding shock also affects NMCs along the extensive margin.
Within-NMC Analysis: the Intensive Margin
The setting is a difference-in-difference analysis around the COVID-19 shock. To trace the impact of the shock on the provisioning of credit to NMCs, we exploit variation in ex-ante liquidity positions of banks. Our identification hinges on each NMC borrowing from at least two different banks before and after the shock. This strategy isolates within-NMC variation in the change in credit line supply from banks differently exposed to the shock.
Our strategy nets several key findings with NMCs:
- Less-liquid banks expand more of their supplies of credit lines to NMCs. An increase in liquidity of one standard deviation leads to a 6.5 percent lower expansion of warehouse credit lines.
- The effect is higher for small NMCs. An increase in liquidity of one standard deviation is associated with a 7 percent supply-driven decrease in credit expansion.
- There are no differential effects along NMCs capitalization and quality of mortgages originated.
- Liquidity's effect on the supply of credit lines is relevant for small and regional banks but not for large ones.
- Liquidity interacts with capital: Less-capitalized banks expand credit lines more than well-capitalized counterparts.
Cross-NMC Analysis: the Extensive Margin
Although the within-NMC specification allows us to examine whether banks with lower liquidity positions benefited more and expanded credit lines to NMCs, it is not appropriate to assess the overall effect of the shock. This is because our model focuses on existing credit lines, ignoring new and terminated credit line relationships and, hence, the extensive margin.
Given the importance of the overall effect, we created a second model to estimate the cross-sectional effect of NMCs exposure to the shock. This model yields several more key findings across NMCs:
- After the shock, there is no decrease in the overall credit expansion for NMCs borrowing from banks more exposed to the shock (low-liquidity banks).
- The effect is concentrated on small NMCs and triggers a 5 percent lower expansion of credit lines.
- Small NMCs are less likely to establish new credit relationships.
Conclusion
This article discusses how an aggregate bank funding shock affects banks' credit line supply to nonbanks. We exploit the significant expansion of bank deposits in the first quarter of 2020 in combination with banks' differential exposure to this shock, which we measure by a bank's liquid asset ratio before the shock. Our results suggest that more exposed banks increased their credit line supply to NMCs significantly more following the aggregate increase in bank deposits. This effect is present along the intensive and extensive margins.
Alessandro Rebucci is an economics professor in the Carey Business School at Johns Hopkins University. Alex Sclip is an associate professor in the Department of Management at the University of Verona. Horacio Sapriza is a senior economist and policy advisor in the Research Department at the Federal Reserve Bank of Richmond. Daniel te Kaat is an associate professor of finance at the University of Groningen.
1
We estimate an average of 15 calendar days between the origination and sale of a mortgage in the second quarter of 2020. In that quarter, the average amount of used credit was $70 billion, and the total amount in mortgages originated by NMCs was $410 billion. We estimate the time between origination and securitization in the following way: $70 billion * (90 / 15) = $410 billion.
2
Mortgage originators use margin calls on the to-be-announced hedges to protect against changes in the value of their mortgage originations that are not yet sold. For more information, see the 2020 article "Dirt-Cheap U.S. Mortgages Thwarted by $5 Billion in Margin Calls" by Shahien Nasiripour.
3
The law, signed on March 27, 2020, imposed an eight-week foreclosure moratorium on residential mortgage loans held in securitization pools guaranteed by government-sponsored enterprises (GSEs) or Ginnie Mae. The CARES Act also introduced a 12-month forbearance benefit for federally guaranteed mortgages and cash assistance that helped many borrowers continue making payments.
4
See the 2021 paper "Government and Private Household Debt Relief During COVID-19" by Susan Cherry, Erica Jiang, Gregor Matvos, Tomasz Piskorski and Amit Seru.
5
See the 2020 working paper "Refinancing Inequality During the COVID-19 Pandemic" by Sumit Agarwal, Souphala Chomsisengphet, Hua Kiefer, Leonard Kiefer and Paolina Medina.
6
See the 2021 working paper "How Resilient Is Mortgage Credit Supply? Evidence From the COVID-19 Pandemic" by Andreas Fuster, Aurel Hizmo, Lauren Lambie-Hanson, James Vickery and Paul Willen.
7
See the 2024 paper "Why Did Bank Stocks Crash During COVID-19?" by Viral Acharya, Robert Engle, Maximilian Jager and Sascha Steffen.
8
See the 2022 paper "Bank Liquidity Provision Across the Firm Size Distribution" by Gabriel Chodorow-Reich, Olivier Darmouni, Stephan Luck and Matthew Plosser and the 2024 working paper "Monetary Transmission Through Bank Securities Portfolios" by Daniel Greenwald, John Krainer and Pascal Paul.
9
See the 2021 paper "How Did Depositors Respond to COVID-19?" by Ross Levine, Chen Lin, Mingzhu Tai and Wensi Xie.
10
See the 2020 papers "The Risk of Being a Fallen Angel and the Corporate Dash for Cash in the Midst of COVID" by Viral Acharya and Sascha Steffen and "Banks as Lenders of First Resort: Evidence From the COVID-19 Crisis" by Lei Li, Philip Strahan and Song Zhang.
11
See the 2023 working paper "Liquidity Dependence and the Waxing and Waning of Central Bank Balance Sheets" by Viral Acharya, Rahul Chauhan, Raghuram Rajan and Sashca Steffen and the 2024 paper "Liquidity, Liquidity Everywhere, Not a Drop to Use: Why Flooding Banks With Central Bank Reserves May Not Expand Liquidity" by Acharya and Rajan.
12
See the 2000 paper "What Do a Million Observations on Banks Say About the Transmission of Monetary Policy?" by Anil Kashyap and Jeremy Stein. Subsequent papers confirming the finding include the 2008 paper "Tracing the Impact of Bank Liquidity Shocks: Evidence From an Emerging Market" by Asim Ijaz Khwaja and Atif Mian and the 2013 paper "Interbank Liquidity Crunch and the Firm Credit Crunch: Evidence From the 2007-2009 Crisis" by Rajkamal Iyer, José-Luis Peydró, Samuel da-Rocha Lopes and Antoinette Schoar.
13
The amount of credit granted to NMCs is lower than the amount of credit drawn during the COVID-19 pandemic by U.S. publicly listed firms. In such a case, the amount of credit drawn grew from $160 billion to $320 billion. See the 2024 paper "Why Did Banks Stocks Crash During COVID-19?" by Viral Acharya, Robert Engle, Maximilian Jager and Sascha Steffen for additional information.
14
For more information, see the 2021 commentary "Why Wasn't There a Nonbank Mortgage Servicer Liquidity Crisis?" by Lara Loewenstein.
15
See the 2022 paper "Liquidity in the Mortgage Market: How Does the COVID-19 Crisis Compare With the Global Financial Crisis?" by Karen Pence and the 2024 paper "Intermediation Frictions in Debt Relief: Evidence From CARES Act Forbearance" by You Suk Kim, Donghoon Lee, Tess Scharlemann and James Vickery. This behavior raised concerns similar to those during the global financial crisis that financially constrained servicers pursued foreclosures and modifications at the expense of investors and borrowers. For more information, see the 2022 paper "Financially Constrained Mortgage Servicers" by Darren Aiello.
16
See the previously cited paper "Liquidity in the Mortgage Market: How Does the COVID-19 Crisis Compare With the Global Financial Crisis?" Data on interest rates, covenants and collateral characteristics of each warehouse credit lines are not available. Such information would be useful to draw inferences on how banks change margin calls on credit lines and impose stricter terms on NMCs following the COVID-19 shock. This paper reports anecdotal evidence that some lenders required stricter covenants on warehouse credit lines during the COVID-19 period.
17
In 5 percent of the observations, a lender has more than one warehouse credit line committed to an NMC. In that case, we aggregate the credit lines volumes and treat them as a unique credit line. We do not have information on the collateral pledged on these credit lines, which might be different between them.
18
Summary statistics on the number of credit lines and their amounts are similar to those shown in the 2023 paper "Financing Competitors: Shadow Banks’ Funding and Mortgage Market Competition" by Erica Xuewei Jiang.
19
MSRs are a significant revenue source for NMCs. After loans are sold and servicing is retained, MSRs should be capitalized as assets and recorded in the balance sheet at fair value. Servicing is riskier than origination, so we scale this variable by total equity instead of total assets. In case of borrower default, the servicer is responsible for enforcing the mortgage contract and advance missing payments until the foreclosure procedure starts.
20
Very few NMCs hold mortgages on their balance sheets for investment purposes, and they are not displayed in our table.
To cite this Economic Brief, please use the following format: Rebucci, Alessandro; Sclip, Alex; Sapriza, Horacio; and te Kaat, Daniel. (August 2025) "Bank Liquidity and Financing of Nonbank Mortgage Companies." Federal Reserve Bank of Richmond Economic Brief, No. 25-33.
This article may be photocopied or reprinted in its entirety. Please credit the authors, source, and the Federal Reserve Bank of Richmond and include the italicized statement below.
Views expressed in this article are those of the authors and not necessarily those of the Federal Reserve Bank of Richmond or the Federal Reserve System.
Subscribe to Economic Brief
Receive a notification when Economic Brief is posted online.
Contact Us