Sea Level Rise and Effects on House Prices
Economic Brief
November 2025, No. 25-43
Key Takeaways
- High-resolution data allows detailed mapping of where sea level rise will affect U.S. coastlines.
- Linking inundation maps with housing data provides estimates of when specific properties may be inundated.
- Housing markets already appear to reflect long-term sea level rise exposure in property prices.
Sea level rise has the potential to reshape the landscape of coastal properties. In this article, we delve into recent research that highlights how high-resolution data and inundation maps can be used to gauge the possible impact of sea level rise on specific properties. Linking these projections with housing data can provide estimates of when and where properties could be affected, providing valuable insights for policymakers and property owners alike.
Mapping Sea Level Rise
Sea level rise is gradual but measurable, and its effects vary across coastal regions. Newly released data from the National Oceanic and Atmospheric Administration offer high-resolution spatial projections in half-foot increments, allowing for precise visualization of permanent inundation patterns.
When overlaid on urban maps, these projections reveal how sea level rise exposure varies across coastal geographies. Figure 1 shows the effects in three example cities:
- In Miami, the gradual rise in water levels expands inland from Biscayne Bay, affecting extensive low-lying residential areas.
- In New York, vulnerable zones appear along the edges of Brooklyn, Queens and the Bronx, where modest changes in elevation lead to substantial differences in exposure.
- In Charleston, S.C., the maps show how tidal creeks and marshlands amplify risk around the city's historic peninsula and nearby barrier islands.
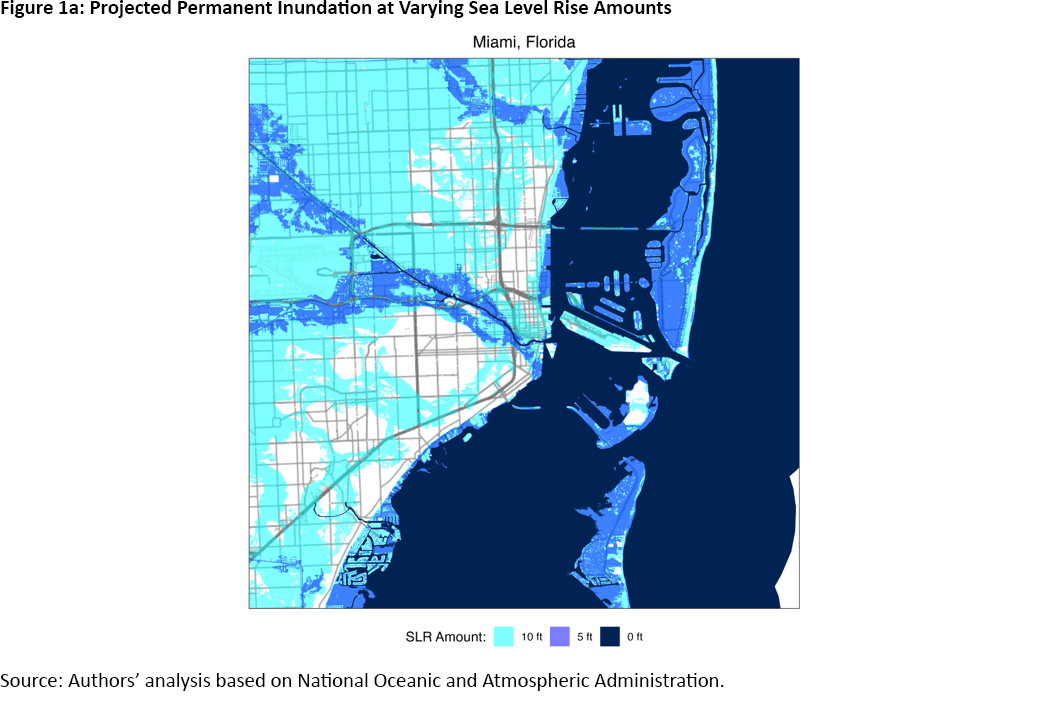
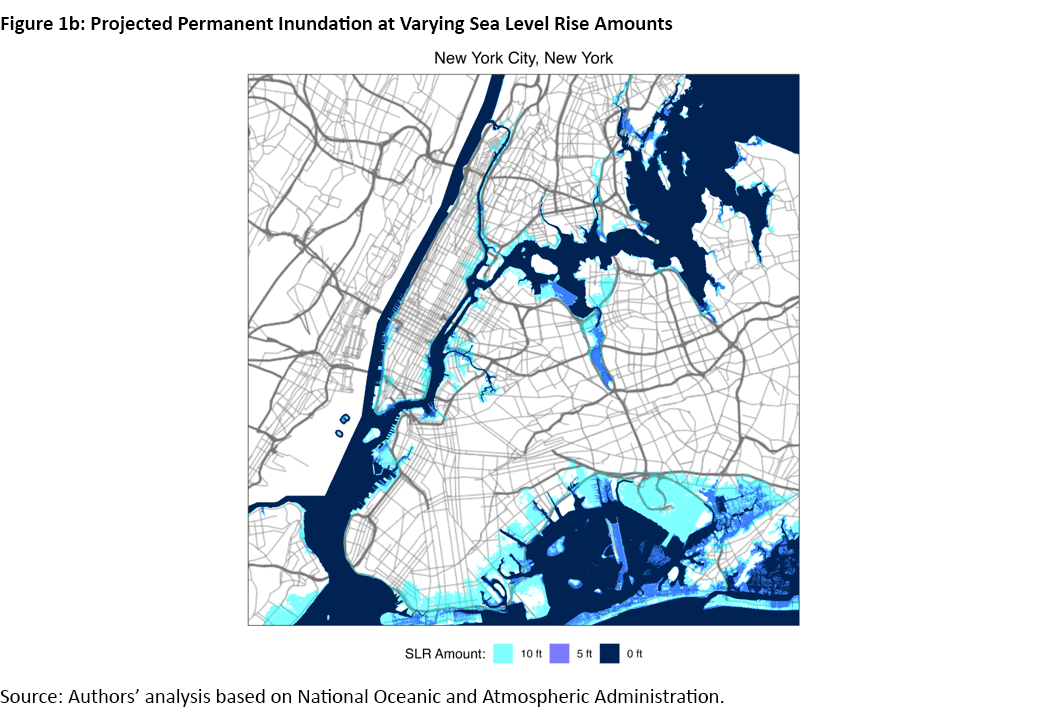
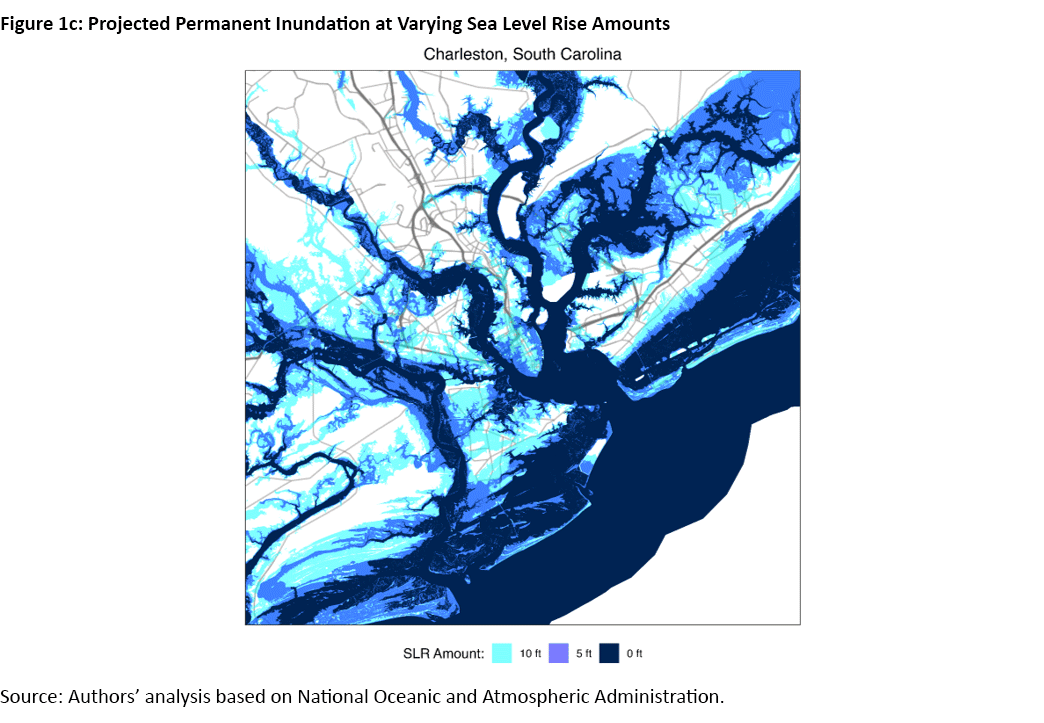
These maps clarify where inundation risk is concentrated and can help policymakers and property owners better understand local exposure.
Sea Level Rise Over Time
Knowing where the sea will rise is one thing, but knowing when is another. For markets and communities, timing determines how quickly risk becomes real.
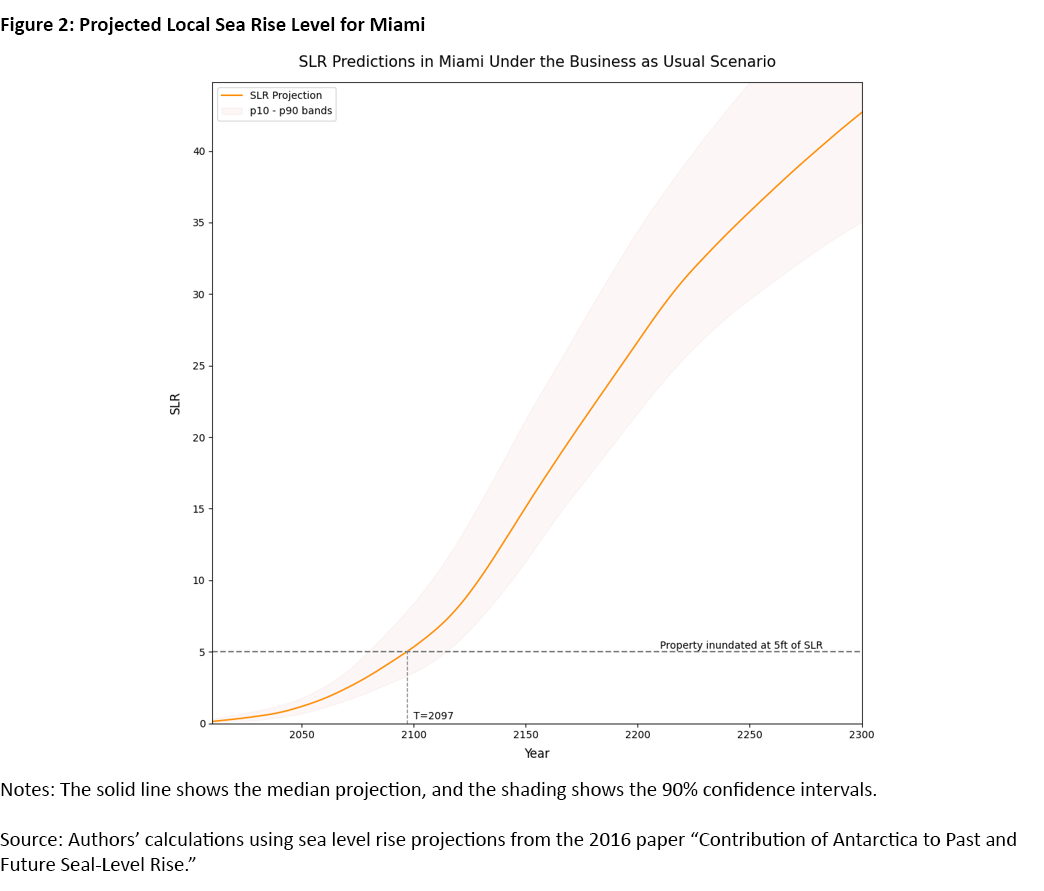
For each property, we estimate the smallest increase in sea level that would result in permanent flooding. We then match this threshold with local tidal gauge projections under a "business-as-usual " scenario (IPCC RCP 4.5) to identify the first year of permanent inundation, or the point when rising seas are expected to exceed that property's flood threshold. This approach translates spatial exposure into a timeline, showing not only where flooding is likely to occur, but also when.1
In practical terms, this means that if a property would be inundated at 5 feet of sea level rise, we look to the local projection to determine when 5 feet of rise is expected to occur. This process converts spatial exposure into a timeline of expected inundation, as seen in Figure 2.
Nationally, about 2.8 million single-family homes fall within the 0-to-10 foot sea level rise range, with most at risk between 5 feet and 10 feet of rise. These calculations and projections make it possible to translate hydrological data into meaningful temporal risk estimates.
Sea Level Rise and House Prices
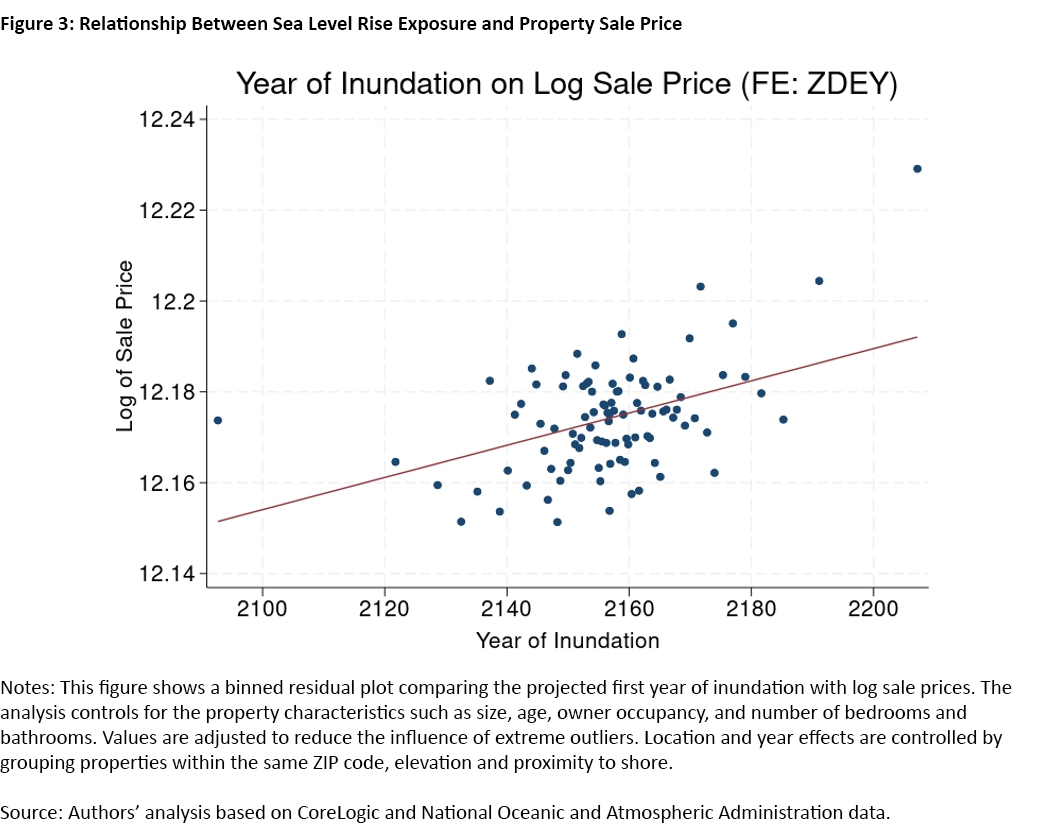
Although most projected inundations occur far in the future, housing markets appear to account for this risk today.
By matching property sales with projected inundation thresholds, we find that homes with higher exposure tend to sell for less, even after controlling for structural features and location. The relationship is consistent across markets: Properties expected to face earlier or greater inundation trade at a discount relative to less-exposed homes.
This pattern suggests that market participants are forward-looking, incorporating long-run coastal risk into property values well before those risks materialize.
Conclusion
Real estate offers a grounded view of how gradual physical risks translate into economic outcomes. Homes are fixed assets with long investment horizons, making their values sensitive to location-specific, long-term changes in coastal conditions.
By combining fine-scale spatial maps, local timing projections and market data, this research provides a clear, evidence-based view of how sea level rise is beginning to shape property values across U.S. coastlines.
Toan Phan is a senior economist, and Nicholas Weitzel is a research associate, both in the Research Department at the Federal Reserve Bank of Richmond.
1
Calculation details behind this article's figures and numbers will be made available in the future in my working paper "A Market-Based Measure of Ambiguity Aversion: Housing Prices Under Rising Seas," co-authored with Michael Barnett, Jacob Dice, David Rodziewicz and Constantine Yannelis.
To cite this Economic Brief, please use the following format: Phan, Toan; and Weitzel, Nicholas. (November 2025) "Sea Level Rise and Effects on House Prices." Federal Reserve Bank of Richmond Economic Brief, No. 25-43.
This article may be photocopied or reprinted in its entirety. Please credit the authors, source, and the Federal Reserve Bank of Richmond and include the italicized statement below.
Views expressed in this article are those of the authors and not necessarily those of the Federal Reserve Bank of Richmond or the Federal Reserve System.
Subscribe to Economic Brief
Receive a notification when Economic Brief is posted online.
Contact Us