Recent Employment Changes in the Washington, D.C., Area
Regional Matters
July 17, 2025
Introduction
An important role of the Richmond Fed is understanding economic developments in our Fifth District. The concentration of federal employees and spending in the District of Columbia, Maryland, and Virginia has made it particularly important to understand any potential impact of federal spending and workforce cuts on the regional labor market. This post describes some of the labor market data that we track and explores recent employment declines and elevated unemployment claims in the public and private technical sector of the Washington, D.C., Maryland, Virginia (DMV) region.
The Shape of the Federal Workforce is Changing
The federal government is an important part of the labor market (or employer) in D.C. proper, Maryland, and Virginia. In the United States as a whole, federal government employment is only 1.8 percent of civilian, nonfarm employment, compared to Maryland's 5.4 percent, Virginia's 4.4 percent, and Washington, D.C.'s 24.6 percent. Maryland and Virginia have seen a steeper drop in cuts to the federal workforce compared to Washington, D.C. For example, Maryland lost 5.4 percent of its federal workforce between January and May 2025, followed by Virginia at 4.8 percent. In Washington, D.C., federal employment declined by 1.9 percent. Cumulatively, Washington, D.C., Maryland, and Virginia saw a decrease of around 22,100 federal employees from January through May 2025.
Many of these federal job losses occurred in Washington, D.C., and its larger metropolitan statistical area (MSA) as well as Baltimore.
Between January and May, the Washington-Arlington-Alexandria MSA, which also includes some parts of West Virginia, saw a 3.7 percent reduction in its federal workforce, representing roughly 14,100 jobs, and the Baltimore-Columbia-Towson MSA experienced a 5.4 percent reduction, or 3,000 jobs.
Although it is an important measure of labor market activity, regional employment data from the Bureau of Labor Statistics (BLS) is lagged: As of this publication date, the employment data is only available through May. Data on initial claims for unemployment can provide more real-time information on regional layoffs, and the data on Unemployment Compensation for Federal Employees (UCFE) claims can be particularly informative for federal government workers.
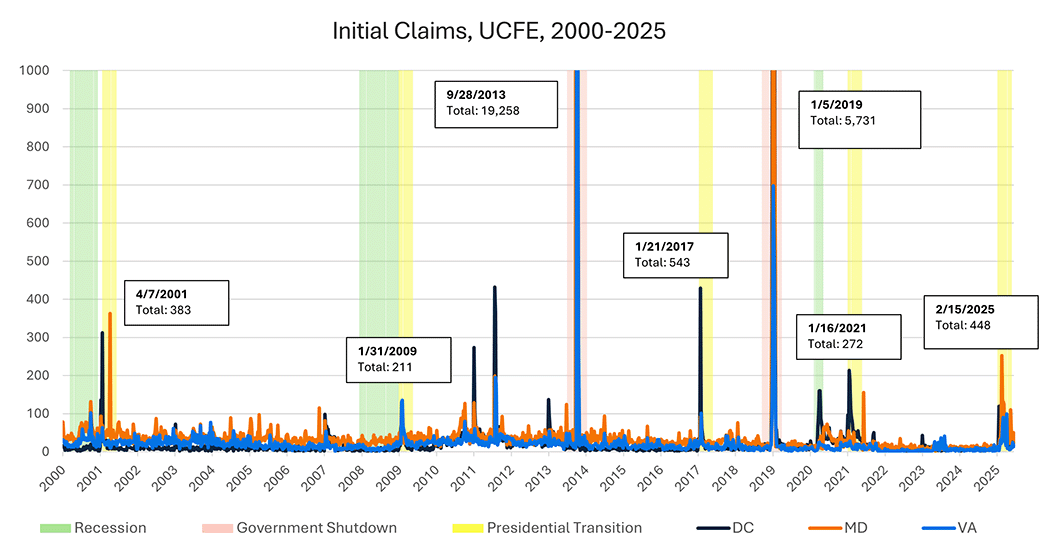
The chart above shows that initial unemployment claims for federal employees will usually increase during recessionary periods (although they tend to come down faster than in the private sector), presidential administration transitions, and federal government shutdowns.1 In fact, during the 2013 federal government shutdown, initial claims in Maryland got as high as 17,368 in one week. Usually, the impact of a shutdown on most employees is short-lived.
Like most presidential transitions, initial unemployment claims rose in Washington, D.C., Maryland, and Virginia since January. D.C. proper experienced its first major increase in mid-January, with the highest number of claims filed during the week of Feb. 15. Maryland experienced its most abrupt spike during that same week, with a 334.8 percent increase from the week before, and another 400 percent weekly increase reported on May 10. Virginia experienced its highest number of initial claims on the weeks of March 1 and April 5. The distribution of initial claims over the weeks following a presidential transition has looked different this year than in previous transitions. For example, with most presidential transitions, there is a spike in initial claims in the weeks immediately following inauguration, with a steady decline thereafter. This year, we saw increased initial claims vary by agency and by state over the months following inauguration.
Initial unemployment claims — or first-time claims among workers who have been laid off — offer a more real-time understanding of layoffs among federal government workers. However, in order to understand the ongoing impact for workers, we need to look at the extent to which workers continue to file for unemployment. Continued unemployment claims, which are a measure of how many workers file for unemployment in a given week, can provide this picture.
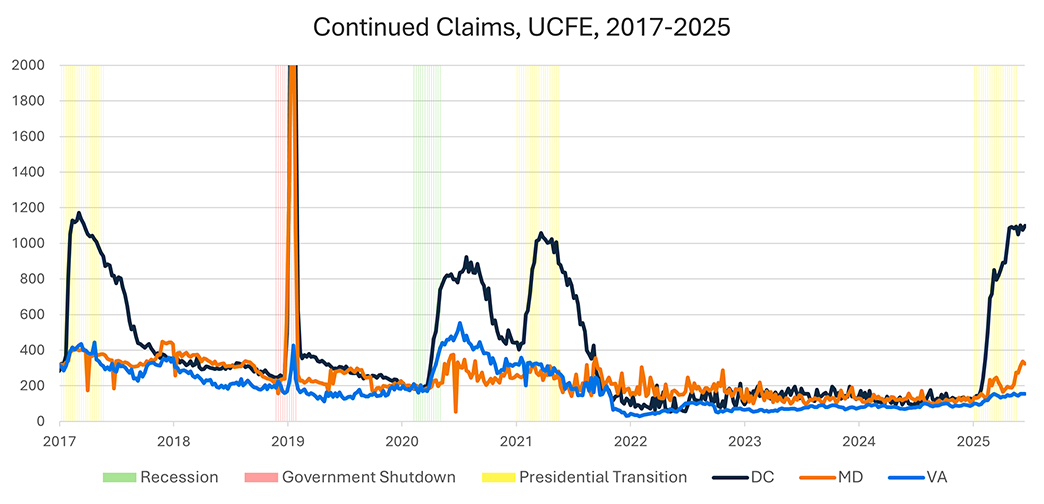
Compared to past government shutdowns and previous presidential transitions, continued UCFE claims in 2025 have remained elevated for a longer period. Additionally, claims have stayed much higher in Washington, D.C. than in Maryland or Virginia. Considering that nearly a quarter of jobs in Washington, D.C. are with the federal government, it might be harder for workers in Washington, D.C. to find alternative employment than those in Maryland or Viriginia, where federal jobs comprise a smaller share.
When a federal worker files for unemployment, they file with the unemployment office in the state where their last duty station was located. Then, the federal government reimburses on a dollar-to-dollar basis. Due to the sustained increase in continued claims, UCFE payments in Washington, D.C. have increased notably since January and remained high. Comparing the same periods in 2024 and 2025, UCFE spending increased 24.4 percent nationally but even higher in these states: 110.7 percent in Maryland, 215.3 percent in Virginia, and 543.3 percent in Washington, D.C.
The Private Sector Workforce Has Also Experienced Changes Since January
Federal government spending extends beyond just the workforce in the DMV area. Both Virginia and Maryland are top receivers of government contract dollars and have some of the largest defense and non-defense contractors in the country. Additionally, cuts to federal contracts and grants can have an impact on staffing at affected organizations. Many of them, such as Leidos, ABT Global, ACDI/VOCA, and the Institute of International Education, are located within the DMV.
There has been an increase in both initial and continued claims between January and June 2025 compared to the same period in 2024. In Washington, D.C., there were 112.2 percent more initial claims and 74.2 percent more continued claims in 2025 than in 2024. Maryland and Virginia did not see changes that were as large: Initial claims were 19.7 percent and 32.7 percent higher, respectively. In comparison, this year's national initial claims are 14.9 percent lower and continued claims are 13.8 percent lower than they were in 2024.
The Professional, Scientific, and Technical Services Sector Has Experienced a Disproportionate Shift This Year
It seems likely that the increase in initial private sector claims in Washington, D.C., Maryland, and Virginia is connected to the outsized role of federal government in the region, not only because the number of claims in the region has grown compared to the United States as a whole. Many federal grants and contracts are made in Professional, Scientific, and Technical Services sector where the DMV has seen the largest increase in claims. For the most part, this sector is composed of establishments and employees performing activities that require a high level of training and expertise in a variety of industries, such as engineering, consulting, and research services.
Since January, UI claims from the Professional, Scientific, and Technical Services sector have been the highest of all sectors in each state. It is also worth noting that claims in the Administrative and Support and Other Services (except Public Admin) sectors, which often overlap with the Professional, Scientific, and Technical Services sector and have also been impacted by contract and grant cancellations, are the second and third highest categories.
What Else Can We Use to Track Local Labor Market Conditions?
Another way to track changes in employment is through the use of Worker Adjustment and Retraining Notification (WARN) data. The WARN Act requires that private sector employers with over 100 employees submit advance notice of closures and mass layoffs — where 50 or more of their employees will be laid off — directly to their state's labor department. These notices include the name and location of the organization, as well as the number of employees affected. This information helps predict upticks in unemployment before it occurs, although these notices are sometimes changed or rescinded before terminations actually take place.
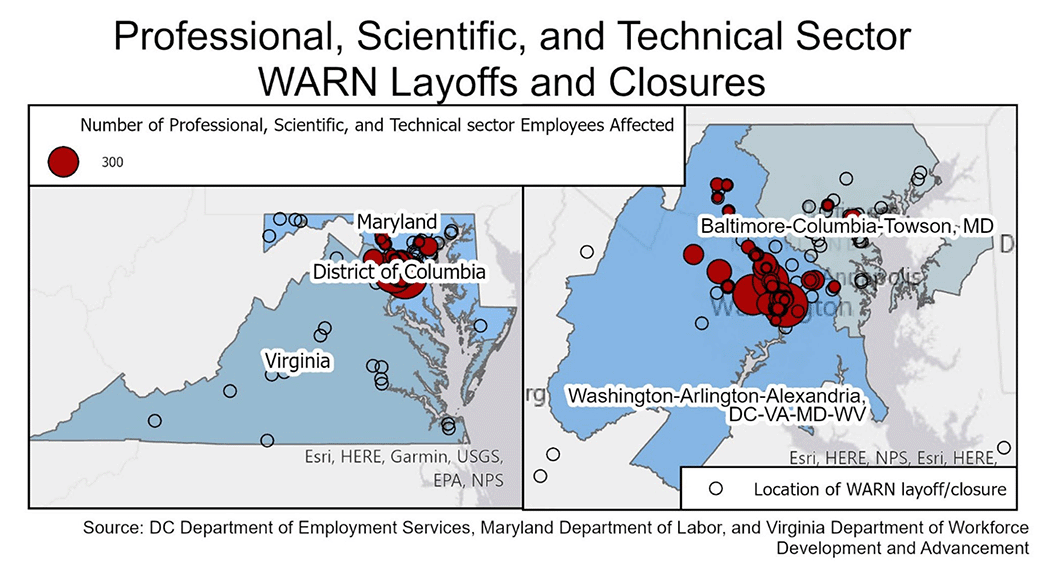
Of all employees affected in Washington, D.C., Maryland, and Virginia between January and early July, 81.9 percent are employed within the Baltimore or Washington, D.C. MSAs, with the Washington-Arlington-Alexandria MSA containing the highest number (10,442) of affected employees.
Of the 4,950 Professional, Scientific, and Technical Services sector employees impacted by WARN-reported layoffs and closures, almost all (96.6 percent) were from organizations inside of the Washington, D.C. MSA. The remaining 3.4 percent were located in the Baltimore MSA, and no WARN layoffs from this sector have been reported outside of an MSA.
Conclusion
There is evidence that the attempt to shrink the federal workforce is having an impact on the DMV region of the Fifth District. On net, federal employment in Washington, D.C., Maryland, and Virginia has declined by roughly 22,100 positions, and there has been a sustained increase in unemployment claims, particularly in D.C. proper.
Employment changes within the DMV will have an impact on a variety of economic outcomes in the area, including tax revenues, household spending and debt, and the housing market. This post lays out just one set of labor market data that the Richmond Fed is tracking to understand the impact of federal spending and workforce cuts in the region. We will continue to monitor economic conditions within the DMV to understand the full impact of changes across the Fifth District.
1
Federal government shutdowns often have the largest impact on UCFE claims.
Views expressed are those of the author(s) and do not necessarily reflect those of the Federal Reserve Bank of Richmond or the Federal Reserve System.
Contact Us