Dipping into Savings
Macro Minute
October 12, 2021
The holiday season is coming up soon. For those concerned that supply chain problems will delay or hinder their gift buying, the spending spree may have already started. Household savings, which have been elevated since the start of the pandemic, are expected to fuel this seasonal burst of demand.
"These numbers suggest that U.S. households — especially high-income households — have much higher financial reserves to support a spending spree now than they did prior to the pandemic."
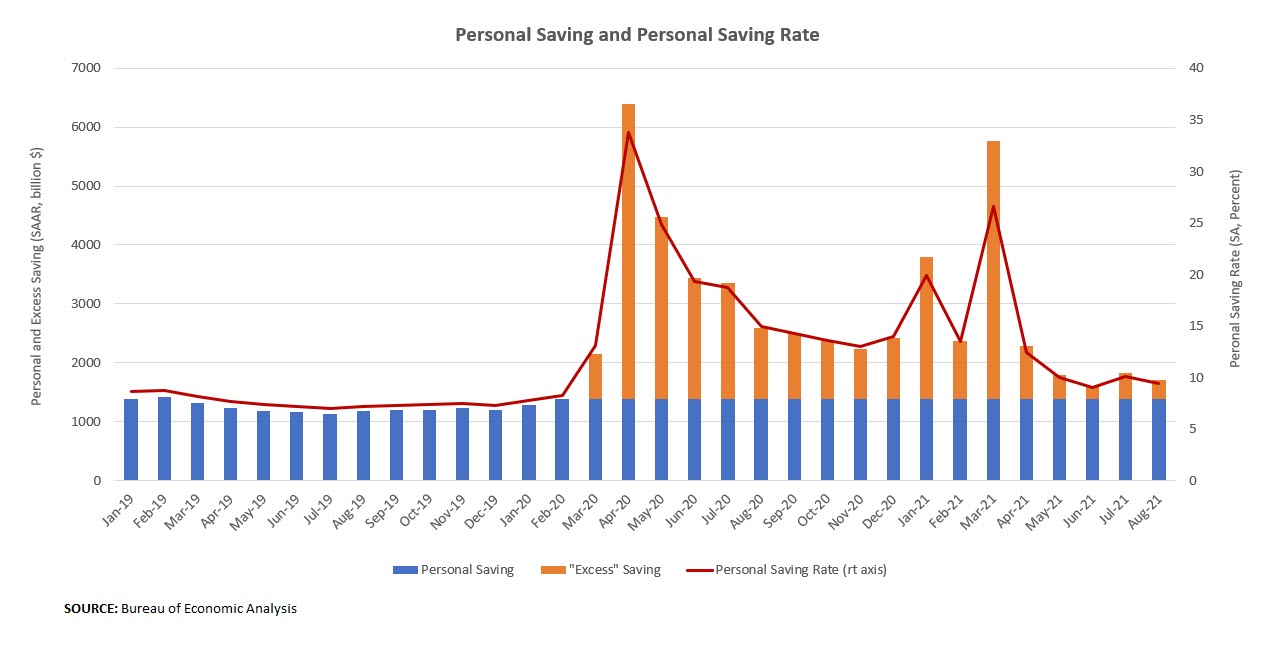
August's personal income and spending data showed households saved 9.4 percent of disposable income, compared to a 2019 average personal saving rate of 7.6 percent. As shown in Figure 1 below, the personal saving rate reached as high as 33.8 percent in April 2020, when household spending was limited by lockdowns and plummeting sentiment, and it has remained above pre-pandemic levels ever since. (In these data, savings refers to personal income that is not consumed. These funds may have gone into cash holdings or savings and checking accounts. Or, they may have been invested in stocks, bonds, real estate or other assets, leading to an increase in household net worth.) The total stock of "excess savings" — which in this blog post refers to the sum of monthly savings above pre-pandemic (Feb 2020) levels squirreled away by households — has reached $2.3 trillion dollars (non-annualized), or 11 percent of U.S. GDP in 2020.
Who's doing the saving? The Distributional Financial Accounts (DFAs) published by the Federal Reserve Board of Governors provides some clues. The DFAs provide quarterly estimates of household wealth from Q3 1989 through the present, breaking out aggregate U.S. household wealth according to income and wealth levels, age, generation, education, and race. Data for Q2 2021 were published this month.
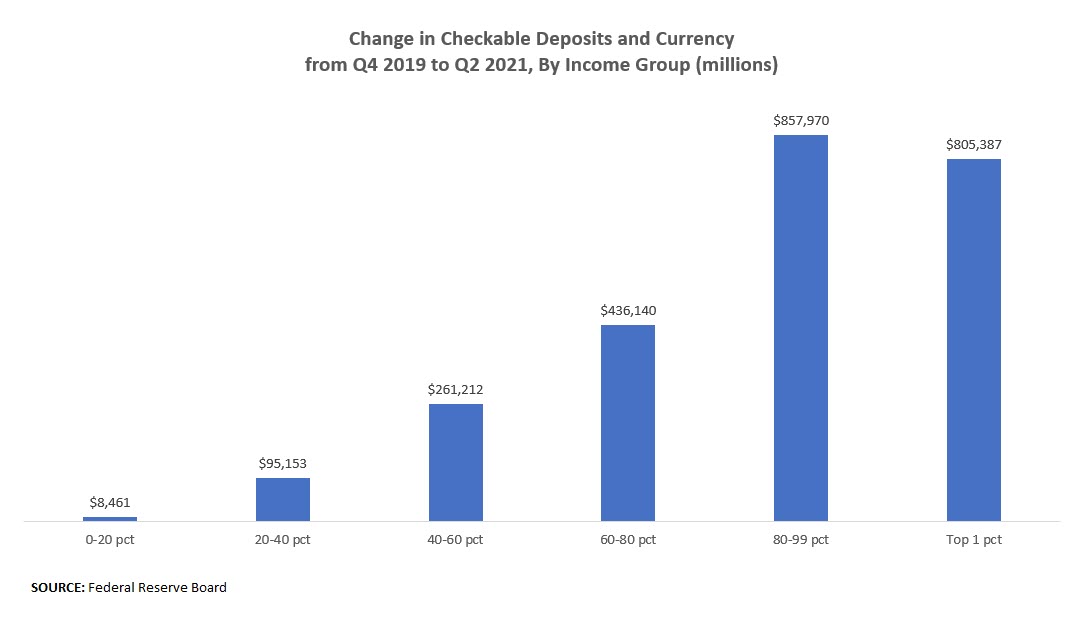
Figure 2 below shows the change in household checkable deposits and currency (an asset class that includes checking accounts and physical cash) between Q4 2019 and Q2 2021 by household income level. Since the onset of the pandemic, households have accumulated just under $2.5 trillion in checkable deposits and currency holdings — close to the $2.3 trillion "excess savings" estimate described above. The bulk of the increase has accrued to households above the 80th percentile of the income distribution. Growth in checkable deposits and currency for the top 20 percent of households ($1.7 trillion) was over twice the $0.8 trillion growth for the bottom 80 percent of households. These numbers suggest that U.S. households — especially high-income households — have much higher financial reserves to support a spending spree now than they did prior to the pandemic.
And this is only part of the picture. Many higher income households have assets such as stocks, bonds and real estate that have grown in value over the course of the recovery and which could further fuel a consumption surge. If these funds enable consumer demand to further outstrip supply, as it has for much of this year, expect pricing pressures to persist as we enter the next calendar year.
On the other hand, for forecasters predicting that today's inflationary pressures will dissipate relatively quickly next year, the distribution of gains in household net worth means that pandemic savings might be spent relatively slowly. A 2019 Boston Fed paper finds the marginal propensity to consume is lower at higher wealth quintiles. A slower pace of dissaving could give supply chain pressures enough time to unwind as demand steadily grows, allowing inflation to settle back closer to the Fed's target range.
Views expressed in this article are those of the author and not necessarily those of the Federal Reserve Bank of Richmond or the Federal Reserve System.
Contact Us