Income, Consumption, and the COVID-19 Pandemic
Special Report
June 18, 2020
The COVID-19 pandemic and the associated economic downturn have impacted the wallets of many Americans. April 2020 alone was a historically extraordinary month for personal income and spending dynamics. In April, the country saw the largest decline in consumer spending to date as well as the largest increase in nominal personal income and, thus, a personal saving rate almost double any prior high. What's behind those consumer spending and saving dynamics, and what do those April numbers mean for the broader economy?
What Happened to Consumption?
Data for April 2020 released by the Bureau of Economic Analysis (BEA) showed real personal consumption expenditures down 13.2 percent in April — a $1.89 trillion nominal decrease — after a 6.7 percent decline in March. This is by far the largest decline in personal consumption. Prior to March, the largest monthly decline since the BEA began collecting the data in 1959 was around -2.5 percent in very early 1987.
The COVID-19 pandemic has impacted consumer spending for a variety of reasons. First, stay-at-home orders restricted economic activity across a number of industries as consumers could no longer patronize restaurants and stores, travel, or stay in hotels. Second, even without formal restrictions, some consumers have been wary to go out to public places for fear of catching or inadvertently spreading the virus. Third, uncertainty naturally constrains spending and the increased unemployment and stock market volatility of the past months have created an uncertain economic environment for households and businesses alike. Altogether, these forces caused the number of patrons to plummet across industries, along with the number of dollars spent.
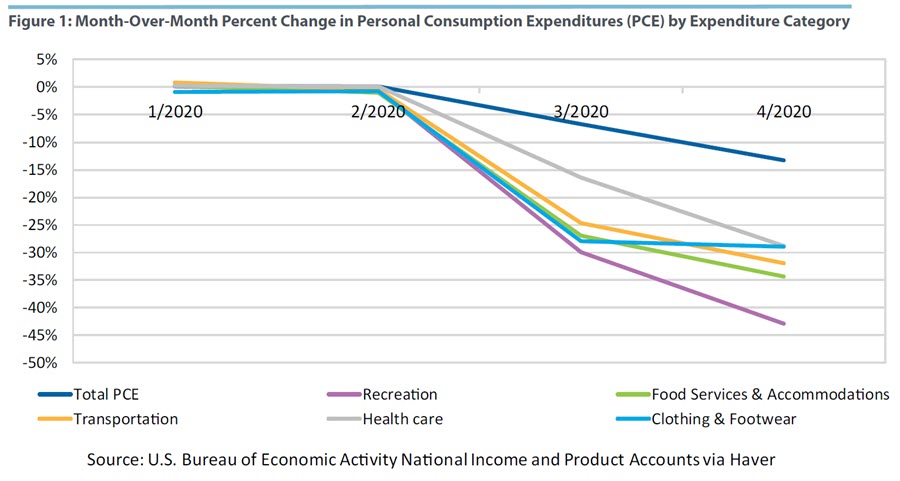
When we look at month-over-month consumption expenditures by type of goods and services, the results are unsurprising, and the hardest-hit categories were largely identified even before the April data release. Decreases were widespread across almost all categories of goods and services, but the largest declines were in categories such as recreation (−42.9 percent), food services and accommodations (−34.4 percent), and transportation (−31.9 percent). Clothing and footwear (−28.9 percent) and health care (−28.8 percent) also saw big decreases. (See chart below.)
In addition to the decline in personal consumption, personal interest payments — which include all nonmortgage interest payments — were down 6.4 percent in April. There was a 0.05 percent increase in personal transfer payments, which include donations, fees, and fines paid to federal, state, and local governments. But altogether, the money flowing out of households in April was remarkably lower than previous months.
What Happened to Personal Income?
In normal times, movements in personal income and personal consumption are positively correlated. In April, however, the sharp decline in personal consumption was accompanied by a sharp increase in personal income, which jumped 10.5 percent from March to April. Like the decrease in personal consumption, this increase in personal income was by far the largest change in the history of the data. Previously, the largest personal income increase was 4.6 percent in May 2008. The May 2008 increase was driven by transfer payments — specifically, the 2008 economic stimulus payments that were distributed to over 130 million individuals.
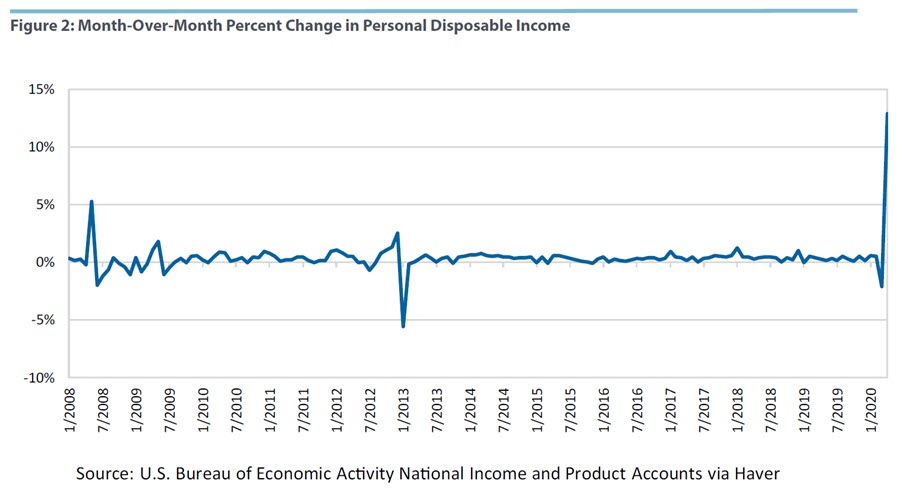
The April 2020 income increase was also driven by transfer payments. Federal and state policy interventions more than made up for the 7.7 percent decline in employee compensation (including wages and salaries). Unemployment insurance grew 518 percent, and "other" personal current transfer receipts — including the coronavirus relief bill — grew 491 percent. In other words, the growth in personal income is entirely due to transfer payments from the coronavirus relief bill, primarily unemployment insurance payments and the $1,200 economic impact payments. Disposable personal income (personal income minus taxes) was up 12.9 percent in April. (See chart below.)
What Does That Mean for the Saving Rate?
The fact that consumer spending accounts for two-thirds of gross domestic product means that as a pure accounting exercise, any decline in consumption expenditures will have a notable effect on headline economic activity in the country. However, for longer-term economic growth, investment matters, and thus savings matters, which is why economists and practitioners also follow the saving rate.
Personal savings is calculated by subtracting consumption costs from disposable personal income. Thus, it is not surprising that the saving rate (savings divided by disposable personal income) increased considerably in April. In terms of month-over-month change, personal savings went up 52 percent in March and 192 percent in April. Practically, this means the saving rate increased from 8.2 percent in February to 12.7 percent in March to 33 percent in April. Previously, the highest saving rate was 17.3 percent in May 1975, so this saving rate is a new record by almost 16 percentage points. Of course, as with many other economic realities of the last few months, April is probably an anomaly. The COVID-19 pandemic is, first and foremost, a health crisis that stopped much economic activity, and spending, in its tracks. The rise in personal income was the result of government policy trying to ensure that Americans could stay home, thus containing the pandemic while continuing to, for example, pay their mortgage. No one is predicting that the saving rate will stay at this historic high, because consumption is widely predicted to increase in May, with perhaps a faster recovery than aggregate employee compensation.
What Happens Next?
On June 26, the BEA will release personal income and consumer spending for the month of May. The rebound in the retail sales report provides some indication that consumer spending will rise considerably and probably above expectations. Total retail sales increased 17.7 percent in May, including a 29 percent rise in sales at food and beverage service establishments, a 90 percent increase in furniture stores, and a whopping 188 percent increase in clothing stores. In fact, the May recovery brings retail trade and food services within 7.9 percent of the pre-pandemic February level, which is far stronger growth than anticipated. This does not answer the concerns about the spread of the virus or the concerns about the economic recovery to come, but given the sizable fraction of consumer spending that is in retail sales, this report is particularly relevant to the total personal consumption spending that we will see in May.
The Questions We Can't Answer (Yet)
April's changes in personal consumption, income, and savings were remarkable, but that one month of data does not provide answers to the broader questions about how household balance sheets have changed during the pandemic, either in aggregate or for subgroups of Americans. Assuming the spread of COVID-19 remains contained, consumption will increase in May and then throughout the year — but will we see consumption return to the levels seen prior to March 2020 across categories, or will there be lasting changes to the amount or the way that Americans consume? Will employment and income bounce back, or will we see lasting economic damage from the shutdowns and continued pandemic concerns? In addition to differing effects on industries and occupations, we know that this crisis is not hitting Americans uniformly — what sort of a legacy will those differing effects leave for income distribution or savings? These are questions that economists will try to answer for months and years to come.
Emily Wavering Corcoran is a research analyst, and Sonya Ravindranath Waddell is a vice president and economist in the Research Department of the Federal Reserve Bank of Richmond.
This article may be photocopied or reprinted in its entirety. Please credit the authors, source, and the Federal Reserve Bank of Richmond and include the italicized statement below.
Views expressed in this article are those of the authors and not necessarily those of the Federal Reserve Bank of Richmond or the Federal Reserve System.