
State Labor Markets: What Can Data Tell (or Not Tell) Us?
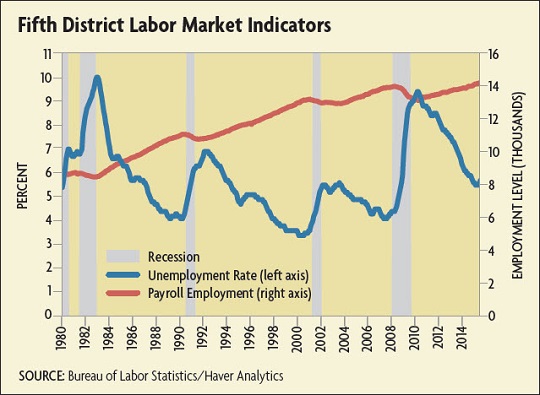
From December 2007 through January 2010, the Fifth Federal Reserve District lost 766,000 net jobs — more than 5 percent of total employment in the District. Over the same period, the regional unemployment rate jumped from 4.4 percent to 9.4 percent. During the recovery, employment grew, and by March 2015, payroll employment in the region exceeded its pre-recession level by 179,100 jobs while the unemployment rate had fallen back to 5.5 percent (see chart 1).
As the national and regional economies have undergone the fluctuations of the last eight years, understanding state and local labor market conditions has been extremely important to academic economists, to practitioners in state and local government, and to other organizations involved in local economic development. Employment statistics at the national level mask significant movement at the state level, and even state numbers mask activity at the metropolitan area or county level. In addition, information availability at the state and local level is limited — for example, we don’t have timely data on gross domestic product or consumer spending — so employment numbers are used even more broadly to understand local economic conditions and the breakdown of industry in a region.
There are many sources of labor market information, most of which are maintained by the Department of Labor’s Bureau of Labor Statistics (BLS). For example, the information in the opening paragraph above on the number of net jobs lost in the Fifth District during the recession came from the BLS's Current Employment Statistics (CES) program. While the national unemployment rate is developed in the BLS's Current Population Statistics (CPS) area, state and local unemployment rates come from the BLS's Local Area Unemployment Statistics (LAUS) program.
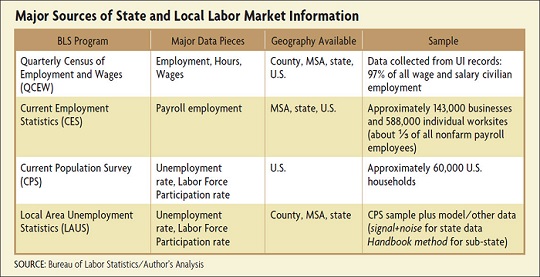
This article will focus on understanding the origination and use of three critical sources of labor market information at the state and local level: the CES data, the LAUS data, and the Quarterly Census of Employment and Wages (QCEW) data. It will shed light on questions such as what economists mean when they refer to "establishment" or "household" data and what role revisions play in developing the data. Finally, how does one interpret the data and what can it tell us about the Fifth District economy?
The Quarterly Census of Employment and Wages (QCEW)
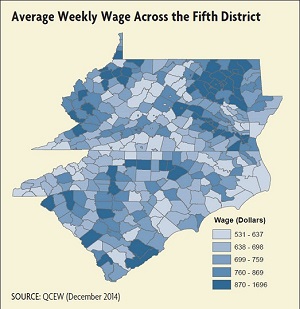
The QCEW is the most comprehensive source of information on employment, hours, and wages by industry in the United States. The QCEW program cooperates with the various state labor market information agencies to collect data from the roughly 9 million U.S. business establishments covered by unemployment insurance (UI) on a quarterly basis (as well as federal agencies subject to the Unemployment Compensation for Federal Employees program). The data represent about 97 percent of all wage and salary civilian employment in the country and comprise a complete set of monthly employment and quarterly wage information at the national, state, metropolitan area, and county levels (see map).
The Establishment Survey and the CES
The modern surveys and methods for collecting information on employment and unemployment in the United States developed throughout the 20th century. Before 1915, only a few states produced employment statistics. In 1915, the BLS entered into a cooperative agreement with New York and Wisconsin whereby sample data was collected from employers by a state agency and used jointly with the BLS to prepare state and national series. The Great Depression prompted increased interest in employment data and by 1933, the federal government published employment, average hourly earnings, and average weekly hours for total manufacturing, 90 manufacturing industries, and 14 nonmanufacturing categories. By 1940, estimates of total nonfarm employment for all 48 states and the District of Columbia were available. Since 1949, the CES program has been a joint federal-state program that provides employment, hours, and earnings information by industry on a national, state, and metropolitan area basis.
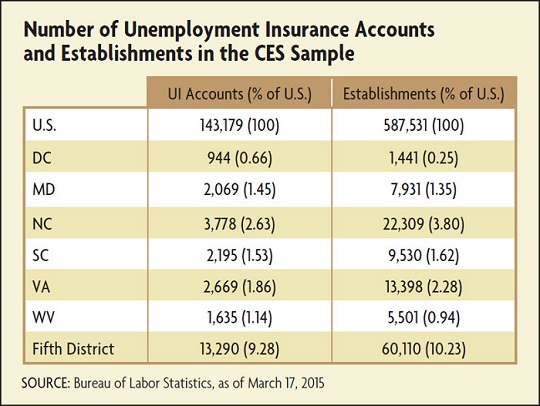
The CES sample covers employment, hours, and earnings from about 143,000 businesses and government agencies, which, in turn, cover approximately 588,000 individual worksites — about one-third of all nonfarm payroll employees in the 50 states and Washington, D.C. The sample is drawn from the QCEW database (that is, from the 9 million establishments that are covered by unemployment insurance).
The CES data is frequently cited. On the first Friday of every month (unless the Friday is a holiday), the BLS releases information on the number of jobs added to the U.S. economy the previous month; for example, on July 2, 2015, the BLS announced that the United States added 223,00 jobs in June. Later in the month, the state data is released. For example, on July 21 the BLS announced that Virginia added 13,400 jobs in June.
Although modeling techniques are used to develop the CES results for some locality and industry combinations that do not have a large enough sample, at the state level estimates are based on the same establishment reports as the national estimates, using direct sample-based estimation. The size of the samples for Fifth District states can be seen in the table; it is important to remember that because state and area samples are smaller, the error component associated with these estimates are bigger than that for the nation.
The Household Survey and the LAUS
In the beginning of July, the public found out not only that the United States had added 223,000 jobs in June, but also that the unemployment fell slightly to 5.3 percent — in other words, 5.3 percent of the total labor force was defined as unemployed by the household survey. The figure of 223,000 jobs came out of the CES program, discussed above. The unemployment rate, however, is developed through an entirely different survey; while the payroll numbers come from a survey of establishments, the labor force and unemployment rate come out of a survey of about 60,000 households across the United States.
Precise definitions, or at least more specific concepts, of labor force, employment, and unemployment were developed during the Depression and throughout the 1930s. The mass unemployment in the early 1930s created the need to directly measure the number of jobless people, and widely conflicting estimates based on a variety of indirect techniques began to appear. In 1940, the Works Progress Administration used the concepts developed in the late 1930s for a national sample survey of households, called the Monthly Report of Unemployment. The household survey was transferred to the Census Bureau in 1942 and in 1948, the name was changed to the Current Population Survey (CPS). Although the Census Bureau continues to collect the data, responsibility for analyzing and publishing the CPS labor force data was transferred to the BLS in 1959.
The Department of Labor began developing unemployment estimates at the subnational level during World War II in order to identify areas with inadequate labor supply, material shortages, or transportation difficulties. After the war, the emphasis was to identify areas of labor surplus, and a program was established to classify areas in accordance with severity of unemployment. In 1950, the Department of Labor published a handbook entitled Techniques for Estimating Unemployment in order to produce comparable estimates of the unemployment rate for all states. This led to the formulation of the “handbook method” in the late 1950s: a series of computational steps designed to produce local employment and unemployment estimates using available data at a much lower cost than a direct survey.
In 1972, the BLS assumed technical responsibility for the state and local program, and in 1973 a new system for developing labor force estimates was introduced, combining the handbook method with the concepts, definitions, and estimation controls from the CPS. Beginning in 1989, the handbook estimation was discontinued for states in favor of time series statistical modeling, although estimates for most substate areas continue to be based on the handbook method. Until 1996, for a handful of the largest states, labor force estimates were calculated directly from the CPS data. Starting in 1996, however, labor force data have been estimated for all states using the time series approach mentioned in this section.
At the state and local level, the 60,000-household sample is not large or representative enough to use the straight sample data. In January 2015, for example, the CPS sample contained 3,347 individuals (in 1,567 households) from North Carolina — only about 0.04 percent of the total state population. In West Virginia, the CPS sample in January 2015 contained only 2,839 individuals from 1,156 households. Variance estimates of employment and unemployment in the household survey are low enough to be acceptable for the nation, but at the state level, the small sample size results in the data being much more variable.
To address the high variability, the BLS develops estimates of unemployment using signal extraction techniques developed in the time series literature. The model takes advantage of the time series of sample estimates in order to reduce the variance by pooling data over time for a given area. In other words, the model uses past data to help reduce the variance associated with current estimates. In addition, the model incorporates additional data series. To estimate employment, the model uses CES data; to estimate unemployment, the model includes unemployment claims as an input. (The labor force is then the sum of employment and unemployment.) The model is referred to as a signal-plus-noise model because it postulates that the observed CPS estimate consists of a true, but unobserved, labor force value (the signal) plus noise that reflects the error arising from taking a sample of the adult population rather than the full population.
To calculate labor force indicators at the local labor market level, the handbook method is used. As mentioned earlier, this approach is a building block approach that utilizes data from the CPS, the CES program, state UI systems, and the American Community Survey (recently changed from the decennial census) to create estimates that are adjusted to statewide measures of employment and unemployment. Below the labor market area level (i.e., for counties and cities/towns), estimates are prepared using disaggregation techniques based on inputs from the decennial census, annual population estimates, and current UI data.
Data Revisions and Interpreting Differences
There is another important part of CES data development: the annual benchmarking process. Because the CES data is a sample, it does not account for the opening and closing of firms during the year. When the economy is growing and new businesses are opening, the CES data is likely to underestimate employment growth. On the other hand, in periods of decline, when firms are closing their doors, the CES data is likely to overestimate employment. The CES program uses non-sampling methods to account for this bias, but the BLS also uses the QCEW data to adjust the CES data (called "benchmarking") — a revision that can have a substantial effect on the employment numbers. For example, with the benchmark that came out on March 17, 2015, the average employment in the Fifth District in 2014 was revised up by 9,300 jobs.
The LAUS estimates are also revised. Monthly, the BLS imposes a process to ensure that substate employment/unemployment estimates add up to the state estimates and state totals add up to the national total. Annual revisions are also made at the beginning of each calendar year using statistical techniques that are built into the model process and incorporating changes to the inputs (revision to the CES data, revision to unemployment insurance claims counts, new population controls, etc.).
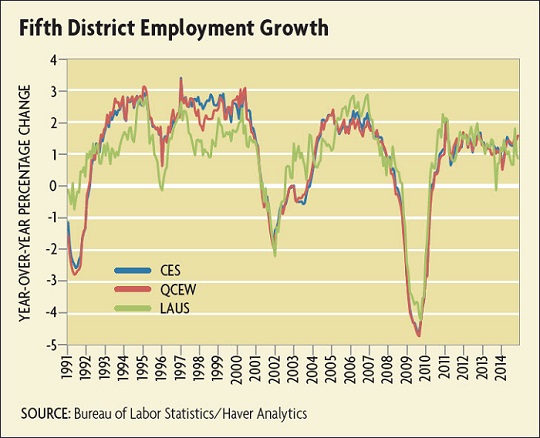
It is not uncommon at the state level to see contradictions between the CES data and the LAUS data, particularly before the annual revisions occur. That's because the data come from different surveys. Furthermore, even when the data trend together (see chart 2), they show slightly different numbers for employment. Most of the time, what analysts are interested in are the trends, however, and particularly the QCEW and the CES data tend to trend together.
Where Else Do Labor Market Data Come From?
Different agencies repackage the QCEW data and combine them with other data to offer the user alternative ways of analyzing local area labor markets. For example, the Census Bureau produces Longitudinal Employer-Household Dynamics (LEHD) data using UI earnings data, QCEW data, and censuses and surveys. Firm and worker information are used to create data on job-level quarterly earnings, on where workers live and work, and on firm characteristics. Some of these data are available only to qualified researchers on approved projects, but the LEHD program also creates public use data sets and online tools.
States themselves often provide further information about state and local labor markets. The Virginia Employment Commission (VEC), for example, provides data on Virginia labor markets through its Labor Market Information (LMI) website. Some of the data, such as unemployment rates, are just repackaged BLS data. Some other data, such as characteristics of the unemployed who have access to UI benefits, include pieces that are available for states through the BLS as well as pieces or geographies unavailable anywhere else. Finally, some of the data, such as characteristics of new job applicants or top employers by county, are available only through the VEC's LMI tools. Different states have different amounts of data available to the public. For the most part, outside of the QCEW, CES, and LAUS data, the information the public can get and at what level of geography varies considerably by state.
Interpreting the Data for the Fifth District
Although there can be short-run discrepancies between the CES and the LAUS data, over the long term they usually tell the same stories. In the Fifth District, the main story they tell is that the states in the southern part of the District experienced a more severe economic downturn but have recovered more quickly and more completely than the northern part of the District. Combined, North Carolina and South Carolina lost almost 60 percent of the 828,700 jobs lost in the Fifth District from December 2007 through February 2010, but both of them regained the losses of the recession by the fall of 2014. As of June, North Carolina was 70,200 jobs above the pre-recession level and South Carolina was 53,700 jobs above. On the other hand, although employment declined less steeply (as a percentage of total employment) in Virginia, Maryland, and the District of Columbia, they have also not grown as strongly during the recovery, particularly in the last few years.
A major factor in the slower recovery in the latter states has been employment in professional and business services. Using the CES data, we can drill down by industry; in Virginia, for example, the professional and business services industry was a driver of growth coming out of past recessions, but the industry expanded more slowly coming out of this recession. More recently, that sector of the state has suffered losses. One of the contributors to the sluggish growth in the northern part of the region, and particularly in professional and business services, is the decline in and uncertainty surrounding federal government contract spending, which plays a large role in the economies of Maryland and Virginia.
West Virginia also survived the recession better than North Carolina and South Carolina, but that state's labor market has also been struggling in the last few years. The decline in energy prices and, more particularly, the contraction in the coal industry has hit the state hard. Of the 8,800 net jobs lost from June 2014 through June 2015 in West Virginia, 2,900 were in mining and logging.
This story plays out in the LAUS data, as well. For example, in December 2009, South Carolina, with an unemployment rate of 11.7 percent, had one of the top unemployment rates in the country. By June 2015, the rate had fallen to 6.6 percent.
Conclusion
The Fifth District economy has expanded slowly but steadily in recent years — a trend best evidenced by the employment data provided through the Bureau of Labor Statistics. In addition, much of the job expansion and the sharpest decline in unemployment has occurred in the southern part of the District, namely in North Carolina and South Carolina. We know this primarily because of the data the BLS provides to the public. Economists, analysts, and various researchers use this information not only to judge current economic activity, but also to better understand the structure of local economies and to analyze which other parts of the economy affect and are affected by labor markets.
Subscribe to Econ Focus
Receive an email notification when Econ Focus is posted online.
By submitting this form you agree to the Bank's Terms & Conditions and Privacy Notice.
Contact Us