Monetary Policy across Space and Time
Economic Brief
August 2019, No. 19-08
Many major macroeconomic events have occurred across multiple countries. This Economic Brief looks at similarities and differences among the euro area, the United Kingdom, and the United States and finds that macroeconomic variables tend to become more interconnected during periods of financial distress. Movements in monetary policy are highly correlated across all three regions. In addition, inflation and unemployment become less responsive to monetary policy shocks over time.
In 2008, industrialized economies across the world experienced a financial crisis and subsequent recession. Central banks responded by lowering interest rates to — or even below — zero and implementing a variety of unconventional measures for monetary stimulus. More than a decade later, interest rates remain quite low by historical standards in much of the world.
The Great Recession is not the only macroeconomic event broadly shared across developed countries. The Great Inflation of the 1970s and the Great Moderation that began in the 1980s also were global phenomena, although the magnitude varied.1 To what extent do these experiences reflect similarities or differences in how macroeconomic variables are connected within different economies, and have those relationships changed over time? How similar is monetary policy across countries?
These questions are the subject of research by Laura Liu of Indiana University, Christian Matthes of the Richmond Fed, and Katerina Petrova of Pompeu Fabra University in Barcelona. In a 2018 working paper, they study the conduct of monetary policy across time and across the United States, the United Kingdom, and the euro area, which together account for more than one-third of global GDP. To do so, the authors build on recent econometric advances that enable them to model a large number of variables and still maintain simplicity and computational efficiency relative to other approaches.
Methodology
Vector autoregression, or VAR, models are a class of models that enable researchers to study time series with multiple variables. These models are widely used to describe the behavior and inter-action of economic and financial time series. One drawback of early VAR models, however, was that they did not allow for "parameter drift," or changes in the model's parameters over time. For example, the unemployment rate tends to rise much more quickly at the beginning of a recession; and many aggregate series show a change in behavior and volatility over time, such as when the Great Inflation transitioned to the Great Moderation. For this reason, researchers have developed "time-varying parameter vector autoregressions," also known as TVP-VAR models.2
TVP-VAR models also have a drawback, however: they are generally only amenable to analyzing a few variables, at most five. This is because the methods used to filter the drifts in the parameters are subject to what's known as the "curse of dimensionality," or the idea that as the dimensions being modeled increase, the amount of data required increases exponentially. To address this problem, Matthes and his coauthors employ a method introduced by Petrova in a 2018 article.3 This method dramatically reduces the number of required calculations. For example, Petrova was able to estimate an eighty-variable VAR model in a little over a minute of computation time. Estimation of the traditional TVP-VAR model would require more than 9,700 equations just to allow for a single lag. This approach offers several other advantages as well, including allowing the authors to use priors established by previous researchers and not requiring overly restrictive assumptions about the law of motion for the drift in the parameters.
The authors apply these methods to study the dynamics of a set of macroeconomic and financial variables for the United States, the United Kingdom, and the euro area. For each economy they use quarterly data beginning in 1971 and continuing through 2013 on the unemployment rate, the short-term nominal interest rate, the ten-year nominal interest rate on government bonds, year-over-year inflation, the annual growth rate of an exchange rate index, and the annual growth rate of a stock price index. One challenge, of course, is that until the late 1990s, countries in what is now the euro area conducted monetary policy separately. To address this challenge, the authors use synthetic data constructed as a composite from the individual countries' data series.4 As a robustness check, the authors replace the euro area data with German data and find that the main results do not change.
Findings
The authors' empirical results focus on three main questions: (1) the differences in the economic environments of the United States, the United Kingdom, and the euro area; (2) whether these economies have become more similar and more interconnected over time; and (3) how similar the conduct of monetary policy is across these economies.
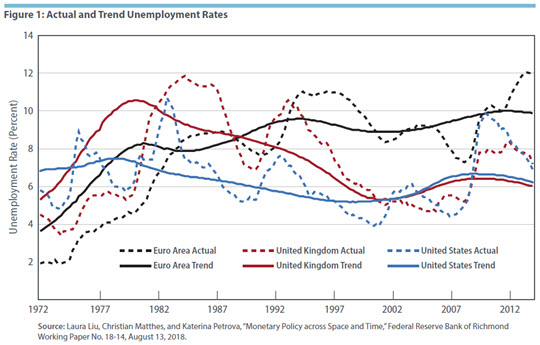
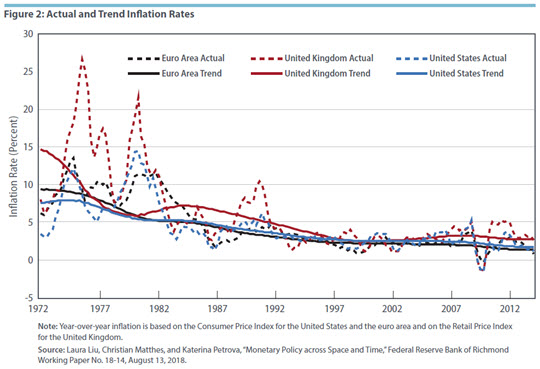
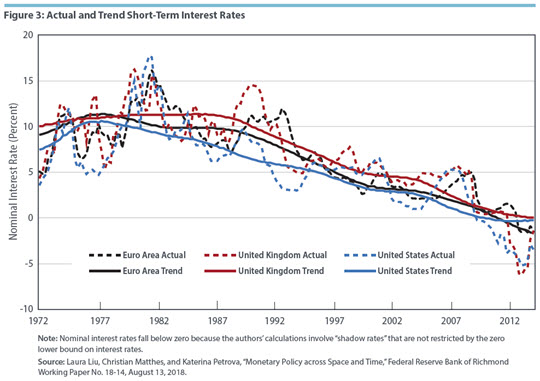
The greatest divergence is in unemployment. The long-run trends in the United States and the United Kingdom converged around the year 2000, but unemployment remained several percentage points higher in the euro area. (See Figure 1 below.) The long-run trends in inflation follow a very similar pattern in all three areas, declining steadily over the sample period. Both actual and trend inflation tend to be highest in the United Kingdom. (See Figure 2 below.) Also displaying a similar pattern are nominal short-term interest rates. The largest differences in rates emerge during the 1980s, and the rates converge in the aftermath of the financial crisis and global recession. (See Figure 3 below.)
Using the calculations of long-run trends, Matthes and his coauthors can derive a measure of the relationship between unemployment and inflation — the Phillips curve — by comparing deviations in each series from their long-run trends. They then can determine whether this relationship is constant across time and across countries. In each economy, the Phillips curve is downward sloping, meaning that when inflation is above trend, unemployment tends to be below trend. The curve is the "flattest" in the United States, such that any movement in inflation requires a larger move in unemployment to remain on the curve. The curve is the steepest in the United Kingdom, meaning that small movements in inflation are associated with smaller movements in unemployment.
To evaluate the extent to which monetary policy is similar or different across countries, the authors compare the real interest rate (the short-term nominal interest rate minus inflation) to the estimated long-run, or so-called "natural," interest rate. In many models of monetary policy, the central bank influences economic activity through its influence over the real rate, but the natural rate is outside its control. The authors thus interpret deviations of the real rate from the natural rate as monetary policy actions.5
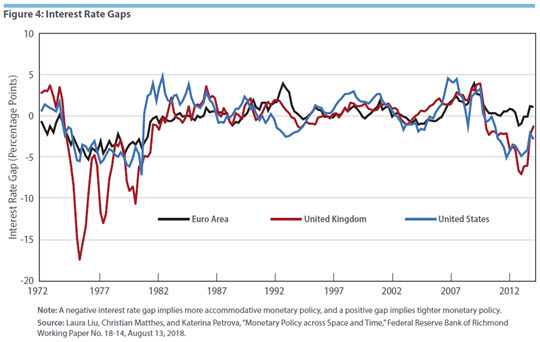
As seen in Figure 4 below, movements in the authors' measures of monetary policy stances are highly correlated across economies, although the absolute levels and the directions of the interest rate gaps can vary substantially over time. (A negative interest rate gap means that the short-term, or policy, rate is below the long-run rate. In other words, monetary policy is more accommodative. A positive interest rate gap implies tighter monetary policy.) One notable difference is in the 1970s, when the interest rate gap was much larger in the United Kingdom than in the United States or the euro area. Also notable is that the authors' estimates imply that after the onset of the Great Recession, monetary policy in the euro area remained tighter for longer than policy in the United States or the United Kingdom. Overall, however, interest rate gaps in the three economies tend to turn positive or negative around the same general time.
Macroeconomic and Monetary Policy Connections
The authors' model enables them to study not only differences and similarities in how economic variables change over time and across countries, but also how interconnected those variables are.
During the early 1970s, the time of the first global oil shock, commodity price inflation explains a large part of the variation in exchange rates and inflation rates across countries. The effects are larger in the United Kingdom, which is consistent with the more severe oil crisis in that country. The authors also find greater cross-variable and cross-country connectedness after the second oil shock in 1979. After 1982, however, short- and long-run interest rates explain the variation in variables, rather than commodity inflation.
During the Great Moderation in the 1990s, the authors find little connection between financial and macroeconomic variables, suggesting minimal spillover from financial markets to the real economy. Also during that time period, short- and long-term interest rates in the United Kingdom are strongly connected to inflation in that country. This likely reflects the fact that the Bank of England introduced inflation targeting in 1992 and became formally independent from the government in 1997. During and after 2008, global interdependence increases and stock returns become central to the network, implying large contagion effects from financial markets to the macroeconomy.
Overall, interconnectedness appears higher during periods of economic distress, such as the Great Inflation, the mid-1990s recessions in the euro area and United Kingdom, and the financial crisis and Great Recession. In particular, during the crisis, more than 80 percent of the variance in the model is explained by past shocks to other variables, compared with 60 percent of the variance during the Great Moderation. But, as the authors note, this difference does not necessarily imply that greater interconnectedness contributed to the Great Recession; rather, the stronger network effects also could be a consequence of the downturn.
How does monetary policy affect economic variables? The authors begin to answer this question by first assessing the domestic response to a monetary policy shock. In all three economies, a monetary policy shock leads to a relatively short-lived response in nominal interest rates but a more persistent response in unemployment. In the 1980s and 1990s, responses to monetary policy shocks are much more persistent than in later years. In addition, monetary policy shocks in the euro area have less effect on inflation and unemployment than shocks in the United States and the United Kingdom, even though the impact on nominal interest rates is similar. Overall, the authors find that both inflation and unemployment became less responsive to monetary policy shocks over time. This may be because policymakers became more adept at managing expectations.6
Conclusion
In sum, the authors find that the United States and the United Kingdom are more similar than the euro area. This is a logical result, since the European Central Bank sets policy for a currency union composed of diverse member states. This result is particularly evident in the measures of the monetary policy stances, as well as in the domestic responses to monetary policy shocks. The authors also find meaningful changes in the United Kingdom's monetary policy after the Bank of England underwent structural changes in the 1990s. In addition, the results reveal increased connections between macroeconomic variables during the recent financial crisis and, more generally, in periods with financial distress — although the results do not suggest whether increased connectedness is a cause or merely a symptom of recessions. Finally, the analysis suggests that monetary policy shocks were larger in magnitude, and the responses to those shocks more persistent, in all three areas in the early 1980s than during any subsequent period.
Laura Liu is an assistant professor of economics at Indiana University, Bloomington, and Katerina Petrova is an assistant professor of economics at Pompeu Fabra University in Barcelona. Christian Matthes is a senior economist and Jessie Romero is an economics writer in the Research Department at the Federal Reserve Bank of Richmond.
1
For more on these events in the United States, visit www.federalreservehistory.org.
2
TVP-VAR models were popularized by Timothy Cogley and Thomas J. Sargent, "Drifts and Volatilities: Monetary Policies and Outcomes in the Post WWII U.S.," Review of Economic Dynamics, April 2005, vol. 8, no. 2, pp. 262–302; and Giorgio E. Primiceri, "Time Varying Structural Vector Autoregressions and Monetary Policy," Review of Economic Studies, July 2005, vol. 72, no. 3, pp. 821–852. For an overview, see Thomas A. Lubik, "Time-Varying Parameter Vector Autoregressions: Specification, Estimation, and an Application," Federal Reserve Bank of Richmond Economic Quarterly, Fourth Quarter 2015, vol. 101, no. 4, pp. 323–352.
3
Specifically, they use a quasi-Bayesian local likelihood approach. See Katerina Petrova, "A Quasi-Bayesian Local Likelihood Approach to Time Varying Parameter VAR Models," Journal of Econometrics, forthcoming.
4
Gabriel Fagan, Jerome Henry, and Ricardo Mestre, "An Area-Wide Model (AWM) for the Euro Area," European Central Bank Working Paper No. 42, January 2001.
5
This measure does not capture all aspects of monetary policy, but it is a useful proxy because it allows the authors to identify the central bank's monetary policy stance without having to identify a monetary policy rule or monetary policy shocks.
6
Jean Boivin and Marc P. Giannoni, "Has Monetary Policy Become More Effective?" Review of Economics and Statistics, August 2006, vol. 88, no. 3, pp. 445–462.
This article may be photocopied or reprinted in its entirety. Please credit the authors, source, and the Federal Reserve Bank of Richmond and include the italicized statement below.
Views expressed in this article are those of the authors and not necessarily those of the Federal Reserve Bank of Richmond or the Federal Reserve System.
Subscribe to Economic Brief
Receive a notification when Economic Brief is posted online.
Contact Us