Measuring Labor Market Power in the U.S. Manufacturing Sector
Policymakers have recently considered several policies to mitigate a perceived increase in employers' market power. However, the lack of direct evidence on labor market power has complicated the policy debate. In this article, we show that the degree of employers' market power is substantial and widespread in the U.S. manufacturing sector. A worker in the average manufacturing plant receives only 65 cents on each dollar generated in the margin. Furthermore, we propose a novel aggregate measure for labor market power. We find that employers' market power decreased between the late 1970s and the early 2000s but has sharply increased since.
Most economic models assume that labor markets are perfectly competitive. In that case, worker pay equals the marginal contributions to their employers' revenues, or marginal revenue products of labor (MRPLs). For example, workers who generate $10 in employer revenues per hour should be paid $10 per hour. Those who are paid less could simply switch to other employers who would pay their "fair share." This specific assumption of perfect competition is convenient in terms of modeling, but does it accurately describe the U.S. labor market?
Actually, the notion of a perfectly competitive U.S. labor market has been contested in the past few years. It has been argued that employers' market power has increased in recent decades. In turn, this rise is responsible for the decline in workers' compensation relative to value added (i.e., the labor share).1
While such a narrative of employers "abusing" their market power seems plausible in the face of ever-growing firms, direct evidence for this hypothesis is lacking. The reason for this lack of evidence is simple: While wages are observable in some datasets, firms' MRPLs are hard to measure. Without the latter, it is almost impossible to determine whether MRPLs are equal to wages as predicted by perfect competition.
In this article, we resolve some of these measurement issues by borrowing methods from the industrial organization (IO) literature that can be applied to the U.S. manufacturing sector. As a result, we can characterize the extent to which employers have labor market power in the U.S. manufacturing sector.
We find that the degree of employer market power is quite substantial. For every dollar generated in the margin, a worker receives only 65 cents. This is a strong departure from the perfectly competitive benchmark in which the same worker would have instead received a full dollar. Also, while labor market power is apparent in U.S. manufacturing, we find little-to-no evidence that employers' market power has been continually increasing in the past few decades.
Measuring Employers' Labor Market Power
Under a perfectly competitive labor market, marginal gains in employer revenues generated by workers should go fully to workers. The intuition for this is straightforward: Employers that don't do this would see all their workers depart to competitors.
The presence of labor market power, on the other hand, implies that employers can withhold some of these marginal gains. Hence, an employer with labor market power compensates its workers with wage rates below their MRPLs. Typically, economists have expressed labor market power through the ratio of a firm's MRPL and the wages paid to workers, also known as the markdown. By construction, a firm's markdown is larger than 1 in the presence of labor market power whereas it is equal to 1 under perfect competition.
The main problem with measuring markdowns is that their components are often not directly observable. MRPLs are never reported, and wages (as opposed to total earnings or compensation) are not always available in firm-level data. Under weak assumptions for firm behavior, however, it can be shown that markdowns can be retrieved through two outlets:
- A firm's output elasticities (that is, the percentage increase in a firm's physical output by increasing an input by 1 percent)
- Revenue share of inputs (that is, total input expenditure as a share of a firm's revenues)
Most firm-level data have revenue share of inputs readily available. Thus, we need ways to estimate production functions from which we can infer output elasticities. Fortunately, the IO literature has provided many methods to do so.
A huge benefit of this "production" approach is that researchers can distinguish labor market power from market power in output markets. In other words, markdowns are not confounded by price-cost markups. The only restriction is that researchers need to observe revenues and expenditure for each available input at the micro level. While datasets like this are scarce, the Census Bureau has fortunately prepared such data for plants in the manufacturing sector. This allows us to characterize labor market power for each plant or firm in the U.S. manufacturing sector.
Labor Market Power in the U.S. Manufacturing Sector
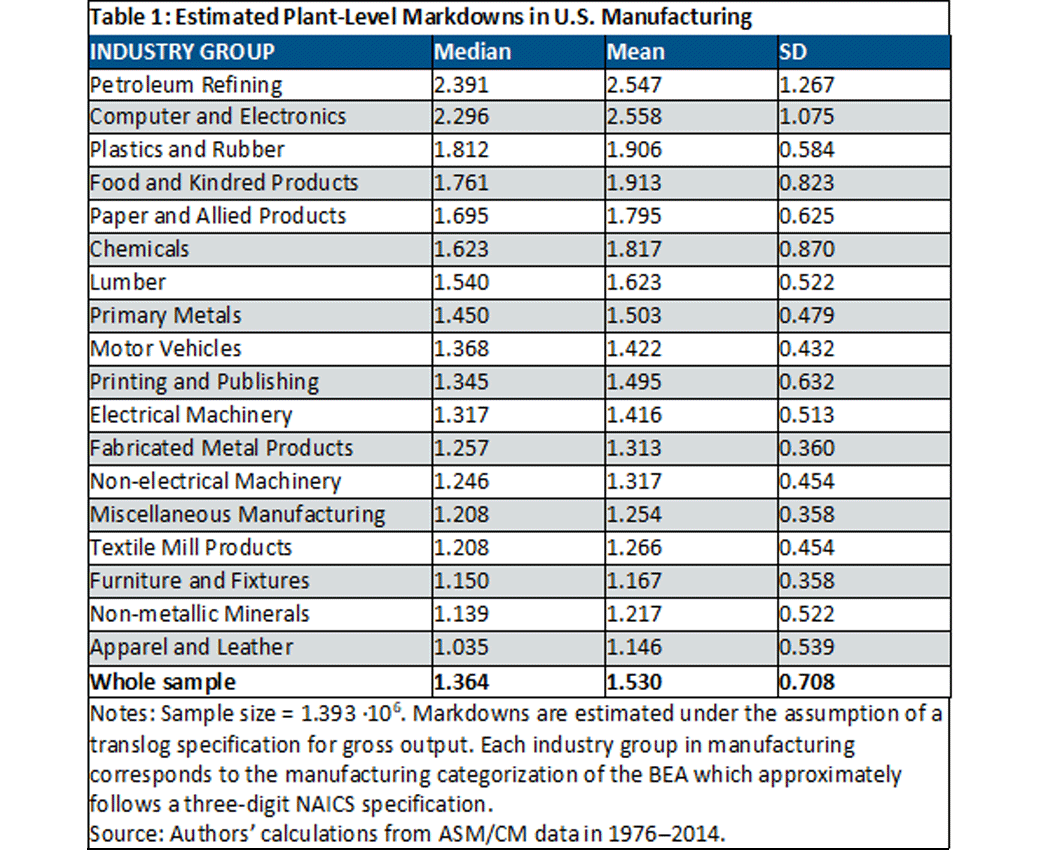
Our main results can be found in the table below. The key takeaway is that labor market power is substantial for U.S. manufacturing plants. The average plant charges a markdown of 1.53, implying that workers only collect $1 for every $1.53 (or 65 cents of every dollar) they generate in the margin for their employers.
Note that the presence of labor market power is not restricted to a few manufacturing subsectors. We find that the average plant within a manufacturing subsector always has a markdown above 1, reflecting a departure from perfect competition.
However, the degree of labor market power varies a lot across these subsectors: Markdowns for the average plant are highest in the Petroleum Refining subsector, whereas they are lowest in the Apparel and Leather subsector.
While there is a lot of variation in labor market power across subsectors, most of the markdown variation can be found within subsectors instead. This can be seen from the high values for the within-subsector standard deviation for markdowns. While it is certainly plausible that industry-level factors (such as, for example, unionization rates) can explain variation in markdowns, our results indicate that idiosyncratic factors within subsectors seem more relevant.
Sources of Markdown Variation
To uncover the source(s) of markdown variation, we look at several factors that have previously been considered by the literature, namely size, age and productivity. We find no role for the latter two factors, but there is an important role for size.
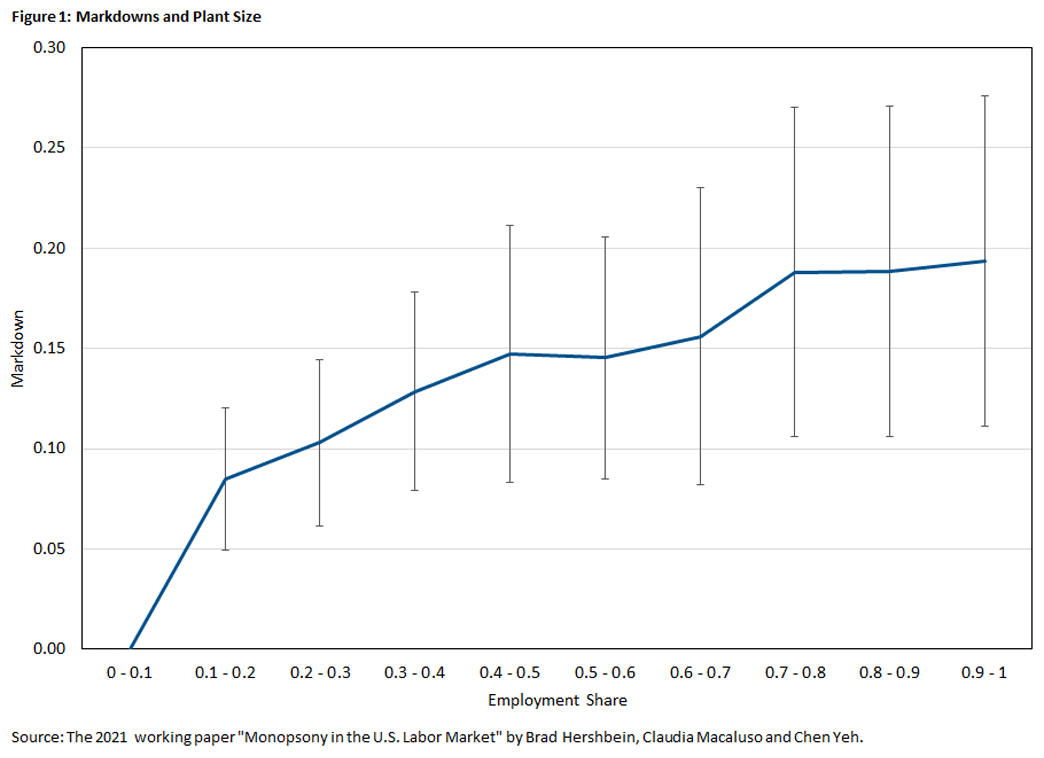
We measure size by a plant's employment share in its local labor market, which is defined as a subsector-county pair. It is important to consider a plant's employment share rather than its absolute size. If workers have limited employment options locally, workers cannot credibly threaten to leave their employer for being underpaid because there are simply no other employers to go to. The locality of labor markets is crucial since workers' mobility has been shown to be costly.
We show that local size matters: Employers with larger local employment shares charge higher markdowns. Intuitively, workers' outside options are more limited whenever the local labor market is mostly controlled by a handful of plants. The extreme case — when there is only one employer in a local labor market — is known as a monopsony. Labor market power can be exercised more aggressively (through higher markdowns) when workers' alternatives are limited.
Aggregate Trends in Labor Market Power
So far, we have documented several facts on labor market power at the plant level. As mentioned in the beginning of this article, some policymakers and academics have suggested that labor market power has increased for the whole economy. Even though we have obtained measures for employers' market power at the micro level, it is not obvious how to combine these plant-level measures and obtain some statistic that reflects the aggregate economy. That is, how do we calculate the aggregate markdown?
We base our methodology on the fact that markdowns are a function of output elasticities and revenue shares. If we apply a similar logic to the aggregate markdown, then we can derive that the aggregate markdown can be calculated as the ratio of two sales-weighted harmonic averages of plant-level markdowns.
An advantage of this approach is that the calculation of the aggregate markdown is not dependent on a specific economic model. It only relies on the notion that the aggregate markdown is calculated in a comparable way as at the micro level.
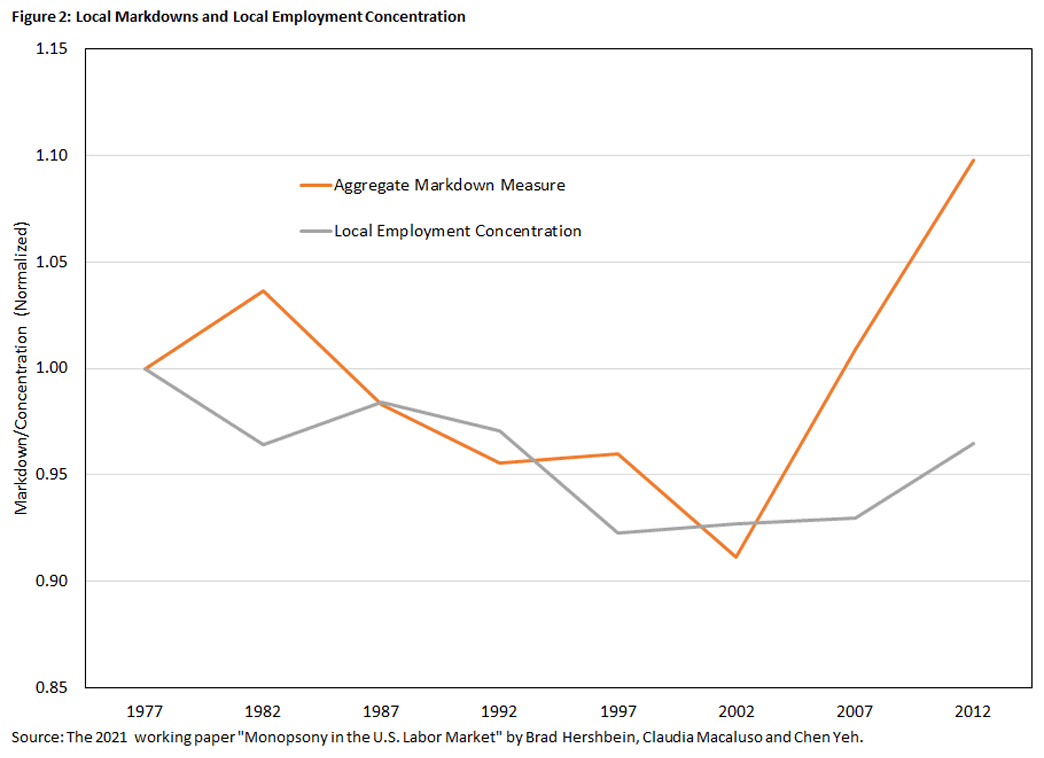
The above figure shows how the aggregate markdown for the U.S. manufacturing sector would evolve over time if we apply this aggregation method. We find that the aggregate markdown displays a non-monotone path: It decreases moderately from 1977 to 2002 and sharply increases afterward.
As a result, it is difficult to rationalize the decline in the U.S. labor share through a narrative of increasing labor market power. The former has been declining quite steadily over time, whereas the aggregate markdown has only been increasing from 2002 onward.
Previous studies have drawn conclusions on labor market power based on employment concentration. Intuitively, concentrated labor markets feature only a handful of firms. Hence, outside options are limited for workers, which creates a pathway for employers exercising their labor market power.
While this argument is attractive, the IO literature has been extremely cautious when it comes to drawing inferences on market-level outcomes based on concentration measures. Our work illustrates that this caution is valid. Aggregate markdowns and concentration are not only weakly correlated across markets, but their time paths are also radically different (as illustrated by the orange line in Figure 2). As a result, it is crucial to obtain independent estimates of markdowns to draw meaningful conclusions on labor market power.
Conclusion
In this article, we show that labor market power is pervasive in the U.S. manufacturing sector. Workers are not fully compensated for their marginal contributions to their employers' revenues. Instead, a worker at the average U.S. manufacturing plant only receives 65 cents for every dollar of revenue generated in the margin. Also, while labor market power is widespread, there is a tremendous amount of heterogeneity: Markdowns vary across but mostly within subsectors.
Finally, aggregate measures of labor market power indicate that employers' market power has not been monotone over time. Instead, it has only been increasing since the early 2000s. This makes it difficult to use rising labor market power as a narrative to explain the declining labor share since its downward trend started decades earlier.
Chen Yeh is an economist in the Research Department at the Federal Reserve Bank of Richmond.
In a 2018 Federal Trade Commission hearing, policy makers and academics fiercely debated this issue.
This article may be photocopied or reprinted in its entirety. Please credit the author, source, and the Federal Reserve Bank of Richmond and include the italicized statement below.
Views expressed in this article are those of the author and not necessarily those of the Federal Reserve Bank of Richmond or the Federal Reserve System.
Receive a notification when Economic Brief is posted online.


