Economic Policy Uncertainty in Election Years
In this article, I focus on the measurement techniques and historical trends of a specific form of uncertainty: economic policy uncertainty, as measured by the EPU index. I describe how the EPU index has behaved during presidential election years, offering insights into its potential evolution.
In his 2003 speech "Monetary Policy Under Uncertainty," then-chairman of the Federal Reserve Alan Greenspan noted that "uncertainty is not just an important feature of the monetary policy landscape; it is the defining characteristic of that landscape." His words were echoed by his successor Ben Bernanke in his 2007 speech of the same name: "Uncertainty about the current state of the economy is a chronic problem for policymakers. At best, official data represent incomplete snapshots of various aspects of the economy, and even then they may be released with a substantial lag and be revised later."
While we've made progress in measuring and understanding uncertainty, it continues to pose challenges for policymakers today. In November, Fed Vice Chair Philip N. Jefferson emphasized the increase in global uncertainty in recent years, underscoring "the necessity of monetary policymakers to consider what they don't know in their decision making."
What Is Economic Policy Uncertainty?
Uncertainty is distinct from observable metrics like inflation and output, making it challenging to measure. While related to the concepts of risk and volatility, it is not defined as either of them. Risk refers to situations with unknown outcomes but known probabilities. For instance, flipping a coin has a 50 percent chance of heads or tails, yet each flip's result is unknown. Volatility (though sometimes confused with risk) measures how much outcomes deviate from their average or expected values. For example, a stock's price can exhibit high volatility if it rapidly changes over short periods of time.
Uncertainty, however, involves outcomes that are not only unknown but whose probability distributions are also unknown. Economic policy uncertainty (EPU) refers to the lack of clarity or predictability regarding government policies that have economic implications. This uncertainty can stem from various sources, including elections, party shakeups, legislative actions, revolutions or geopolitical events. Leading up to an election, there is uncertainty associated with three key areas:
Uncertainty About Decisionmakers
During periods such as elections or political upheavals, it's often unclear who will take control and be responsible for making important policy decisions. For example, not knowing who will win the 2024 presidential election has consequences on our expectations about the path of policy in the next four years.
Uncertainty About Future Policies
Once it's known who will be in charge, there's still uncertainty about what policies they will implement. This aspect is especially pronounced in situations where there's political friction or legislative gridlock, leading to delays or unpredictability in policymaking. Businesses and investors often find themselves in a holding pattern, waiting to see the direction of new policies before making key decisions.
Uncertainty About the Economic Impact of Policies
This involves concerns about how future government actions — such as new laws, taxation, industry regulation or international trade agreements — will impact the economy.
In summary, EPU encompasses the unpredictability in who will make critical economic decisions, what those decisions will be and how they will impact the economy. It's a significant factor that can influence investment decisions, business strategies and overall economic activity.
How Is Economic Policy Uncertainty Measured?
Over the past two decades, research on EPU has significantly expanded. This field of study encompasses various methods, each with unique advantages and limitations.
Market-Based Measures
The VIX index (or CBOE Volatility Index) was the "gold standard" measure for uncertainty in the early 2000s. It is computed using S&P 500 Index options prices, reflecting expected market volatility in the near-to-medium term. Larger anticipated changes in options prices lead to higher VIX levels, indicating increased financial market uncertainty. While the VIX provides real-time insights into market sentiment, it may not fully capture the broader uncertainty experienced by households and firms, limiting its relevance for specific economic assessments.
Survey-Based Measures
These involve collecting information from households, businesses and market participants regarding their forecasts about the economy and the level of confidence in these forecasts.1 They provide specific insights about societal segments facing uncertainty but may not be timely for fast-emerging events.
Econometric-Based Measures
This approach evaluates how far off econometric model forecasts are compared to actual outcomes, with higher uncertainty being indicated by worse predictions from the models.2 While straightforward to calculate, the choice of model and data availability can impact their effectiveness, and a lack of timely data is its biggest drawback.
Text-Based Measures
Indexes are derived from the frequency of newspaper articles mentioning drivers of uncertainty or terms involving "policy uncertainty." The EPU index — developed by Scott Baker, Nicholas Bloom and Steven Davis in 2016 — is the most widely used measure to date. While closely linked to stock price volatility, it suffers from the dual causality issue: Does media coverage reflect or influence economic outcomes? Among its advantages are that it can be computed in real time, for narrow intervals (even daily!) and for a large set of countries, and it can be conditioned to a large set of topics.
Because of its versatility, I'll focus on the EPU index. It integrates three key elements to capture the essence of EPU:
- The frequency of policy uncertainty discussions in major U.S. newspapers
- Data from the Congressional Budget Office on expiring federal tax code provisions
- Variations in economic forecasts about key macroeconomic indicators, derived from the Federal Reserve Bank of Philadelphia's Survey of Professional Forecasters
Economic Policy Uncertainty Over Time
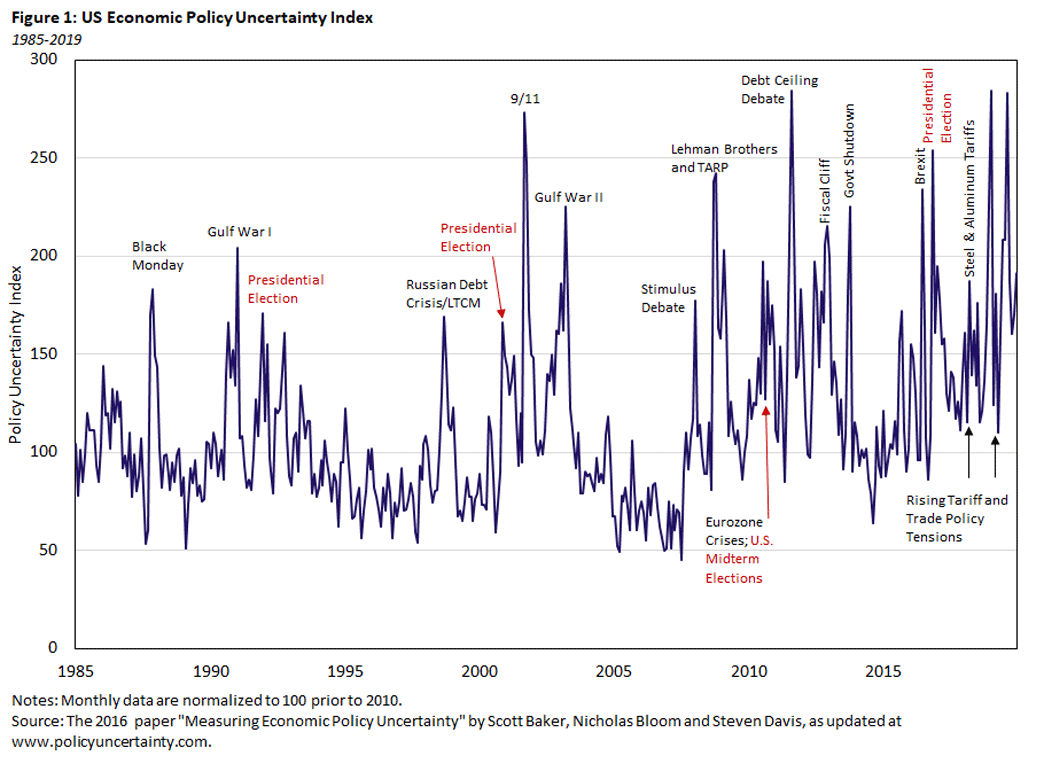
The evolution of the EPU index is shown in Figure 1. The series exhibits distinct spikes during global events (such as the Gulf Wars, 9/11 and the 2008 financial crisis) and significant political events (such as presidential elections). For readability, this figure only includes data until 2019.3
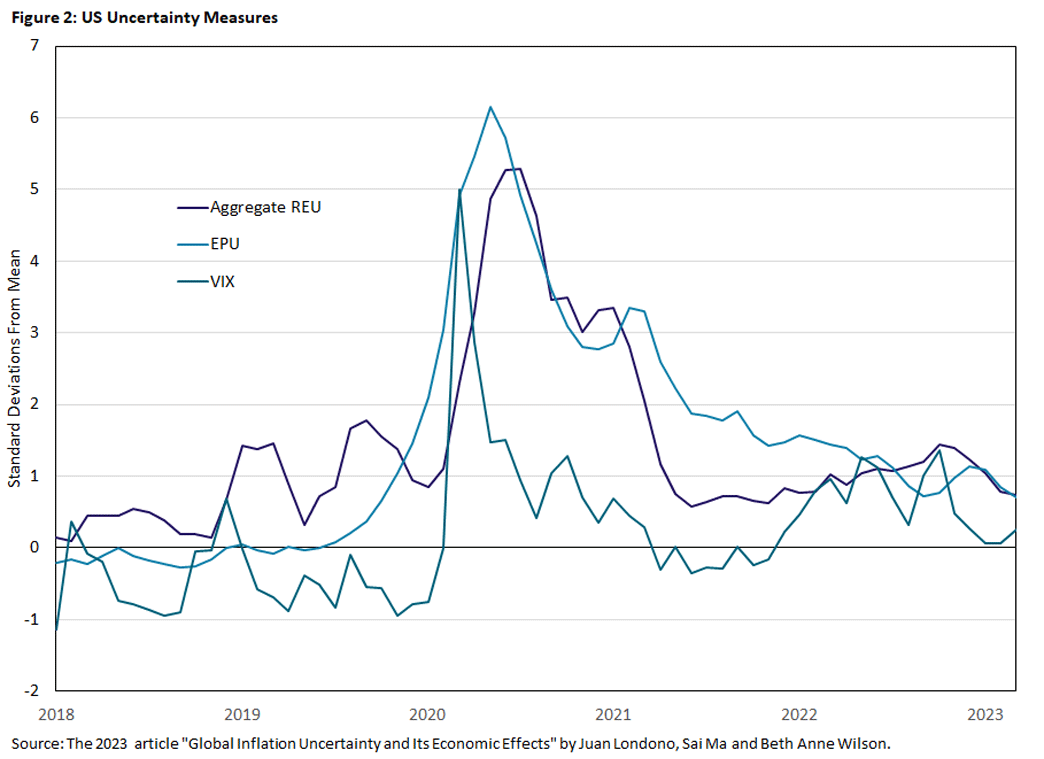
Figure 2 shifts the focus to the period 2018 to 2023. The onset of the pandemic — combined with the presidential election in the same year — led to a historic peak in EPU, where the U.S. experienced unprecedented levels of uncertainty in both health and economic policies.
This figure also includes the VIX index and the Real Economic Uncertainty (REU) index. All three measures reached unprecedented levels at the onset of the pandemic. While the REU index declined slightly in the months following the pandemic's onset, it remained elevated through 2022.
Policymakers (including Federal Open Market Committee members) have highlighted that this persistent uncertainty — particularly concerning inflation — poses challenges for monetary policy. This sentiment is reflected in their economic projections and in the Fed's Beige Book, which shows a higher frequency of the terms "uncertain" and "uncertainty" in recent editions, especially relating to inflation.4
In contrast, the EPU index and the VIX index declined quickly after the initial shock of the pandemic and have remained low, suggesting that they capture different aspects of uncertainty from the REU. It also suggests that, currently, high inflation unpredictability doesn't correlate with increased near-term equity market volatility or frequent EPU discussions in the news.
What Drives Economic Policy Uncertainty?
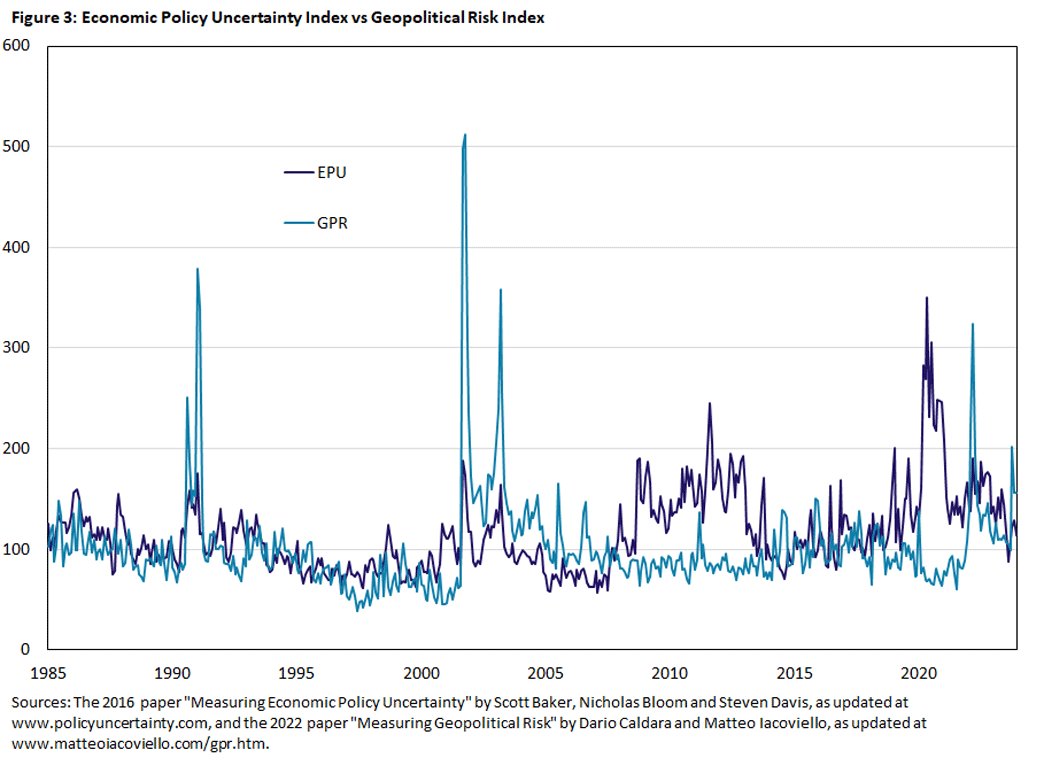
One driver of EPU is geopolitical risk, defined in the 2022 paper "Measuring Geopolitical Risk" as "the threat, realization and escalation of adverse events associated with wars, terrorism and any tensions among states and political actors that affect the peaceful course of international relations."5 The paper's authors developed the Geopolitical Risk Index (GPR), following a methodology similar to the EPU index approach but focused on geopolitical risk.
Increases in GPR are expected to lead to higher EPU levels. For example, the GPR spiked at the outset of the Israel-Gaza conflict, which led to an increase in EPU, albeit to a lesser degree.
However, the two indexes only co-move when geopolitical events drive uncertainty. For instance, the indexes diverged during the pandemic (which can be seen in Figure 3), reflecting how health-related uncertainty was the primary concern.
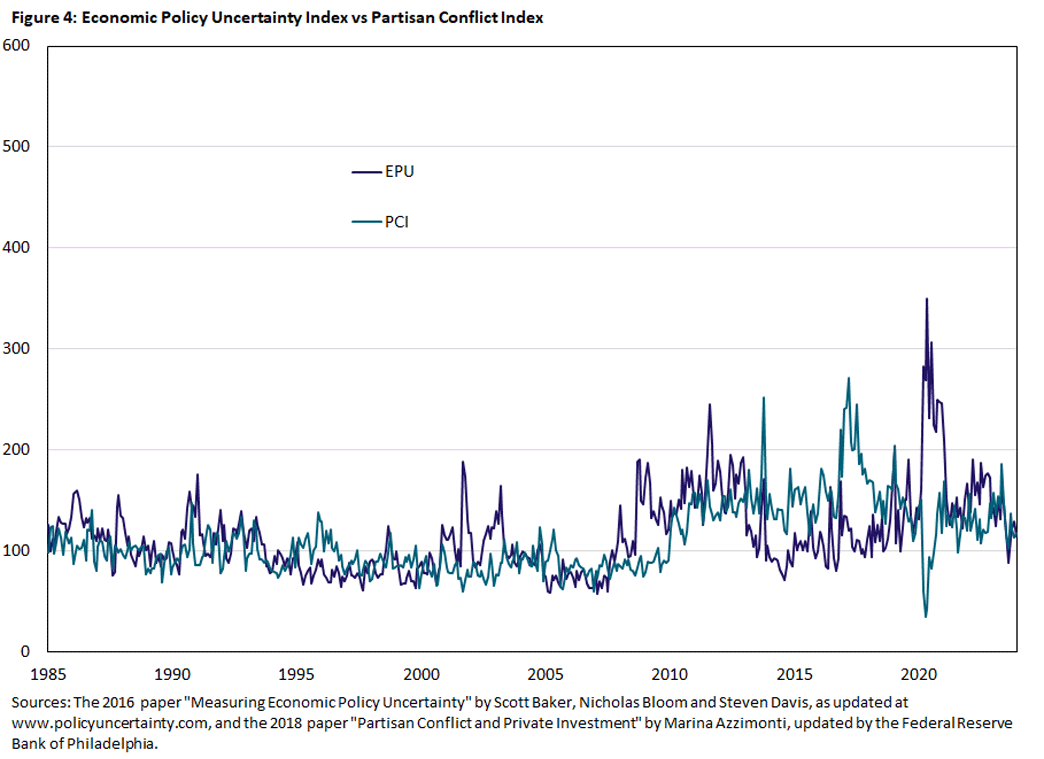
Another driver of EPU is partisan conflict, defined in my 2018 paper "Partisan Conflict and Private Investment" as "the degree of political disagreement among U.S. politicians at the federal and state level." The Partisan Conflict Index (PCI) measures political disagreement among U.S. politicians at federal and state levels, developed using a text-based approach. The PCI rises with polarization, gridlock, shutdowns and elections.6
Although PCI and EPU typically move in tandem, they diverged during the 9/11 attacks and the beginning of the pandemic (as seen in Figure 4), reflecting distinct dynamics. The 2020 pandemic divergence is most likely due to a "rally around the flag" effect among policymakers, akin to the post-9/11 response, indicating that political disagreement wasn't the main driver of uncertainty in these instances. Over the past two years, the EPU and PCI have more closely tracked each other, indicating a potential closer connection between political dynamics and economic policy uncertainty.
What We Know About Economic Policy Uncertainty During Election Years
Using U.S. data between January 1952 and February 2020, the 2020 working paper "Elections, Political Polarization and Economic Uncertainty" finds that EPU increases by 18 percent in the November of a typical presidential election. When elections are close (less than 5 percent apart) and polarized, EPU is significantly higher, increasing by 28 percent in the month of the election. This suggests that political polarization and the closeness of an election significantly amplify EPU. Also, the increase in EPU is not just observed during the election month: The index rises up to six months before the election happens and remains elevated even two months after the election. Figure 5 illustrates this at the quarterly level.
What does this mean for businesses? The increase in EPU during election periods can significantly impact business and consumer spending plans. In situations with high EPU, businesses tend to restrict investment and hiring decisions, and households delay major purchases.7 This reaction to uncertainty can create short-term swings in the economy, akin to an electoral business cycle. Spikes in uncertainty are not just a phenomenon of the U.S., but a global one. One study finds that EPU rises 13 percent in the month of and the month prior to an election compared to other months in the same election cycle in a panel of 23 countries.8
Conclusion
It's yet to be seen whether the 2024 U.S. election will be polarized or close, but the year is set to be momentous for another reason: As coined by the IMF's Fiscal Monitor, 2024 is the "Great Election Year," with elections held in 88 economies, representing over half of the world's population and GDP. The impact of these elections on global EPU will likely shape the economic landscape for years to come.
Marina Azzimonti is a senior economist and research advisor in the Research Department at the Federal Reserve Bank of Richmond. The author would like to thank Acacia Wyckoff for her excellent research assistance.
Examples include the Survey of Economic Activities or the ICC index, developed in the 2020 paper "The Information Content and Statistical Properties of Diffusion Indexes" by Santiago Pinto, Pierre-Daniel Sarte and Robert Sharp.
An example is the Real Economic Uncertainty index, developed in the 2015 paper "Measuring Uncertainty" by Kyle Jurado, Sydney Ludvigson and Serena Ng.
See the EPU website for the complete time series of this variable, as well as global EPU and uncertainty measures for other countries.
See, for example, Richmond Fed President Tom Barkin's 2022 speech "Why We Care About Inflation" or 2024 speech "Heading for a Soft Landing?"
Authored by Dario Caldara and Matteo Iacoviello.
See my 2023 article "Partisan Conflict in the U.S. and Potential Impacts on the Economy" for a discussion.
See the 2015 paper "Policy Uncertainty and Corporate Investment" by Huseyin Gulen and Mahai Ion and the 2016 paper "Measuring Economic Policy Uncertainty" by Scott Baker, Nicholas Bloom and Steven Davis.
See the previously mentioned 2020 paper "Elections, Political Polarization and Economic Uncertainty" by Scott Baker, Aniket Baksy, Nicholas Bloom, Steven Davis and Jonathan Rodden.
To cite this Economic Brief, please use the following format: Azzimonti, Marina. (June 2024) "Economic Policy Uncertainty in Election Years." Federal Reserve Bank of Richmond Economic Brief, No. 24-20.
This article may be photocopied or reprinted in its entirety. Please credit the author, source, and the Federal Reserve Bank of Richmond and include the italicized statement below.
Views expressed in this article are those of the author and not necessarily those of the Federal Reserve Bank of Richmond or the Federal Reserve System.
Receive a notification when Economic Brief is posted online.


