Redlining and U.S. Residential Mortgage Market Pricing
Economic Brief
July 2024, No. 24-21
Does redlining have implications for mortgage pricing today? This article summarizes our research assessing long-lasting implications from the "residential security maps" developed by the Home Owners Loan Corp. in the 1930s that color/letter-coded U.S. neighborhoods. The study finds (1) that the average levels of mortgage rates and fees are modestly higher for all borrowers on the historically targeted (redlined, that is, C-coded or D-coded) side of a neighborhood color boundary; (2) that mortgage rates and fees are modestly higher for minorities on either side of the boundary; (3) that these higher rates and fees that minorities pay are even higher on the historically C-coded or D-coded side of the boundary; and (4) that the rejection rates for borrowers in targeted areas is larger. The pricing results are economically larger and more statistically significant for more segregated cities, for riskier borrowers and for mortgages issued by the shadow banking system.
Credit treatment can significantly shape households' future economic conditions. Our (Andrew, David, Horacio and Alex's) forthcoming work "The Historical Roots of Lending Discrimination" empirically evaluates whether past institutional practices help shed light on pricing in today's U.S. residential mortgage market. We focus on "redlining," understood here as the practice of restricting financial services to residents of certain neighborhoods due to race or ethnicity. Specifically, our study assesses long-lasting mortgage pricing implications from the "residential security maps" developed by the Home Owners Loan Corp. (HOLC) in the 1930s to measure mortgage risk at the neighborhood level.
Classifying Lending Risk Historically
After the Great Depression, HOLC — a now-defunct but then-new federal agency — drew maps to classify neighborhoods in major U.S. cities by perceived credit risk. With collaboration of local real estate agents and mortgage lenders, HOLC agents classified city neighborhoods based on detailed information about housing age, type, occupancy, ownership, minority share and other characteristics. Neighborhoods were classified on a risk scale with four possible grades, from A ("safest," shaded in green) to D ("riskiest," shaded in red). Figure 1 shows an example using Richmond, Va.
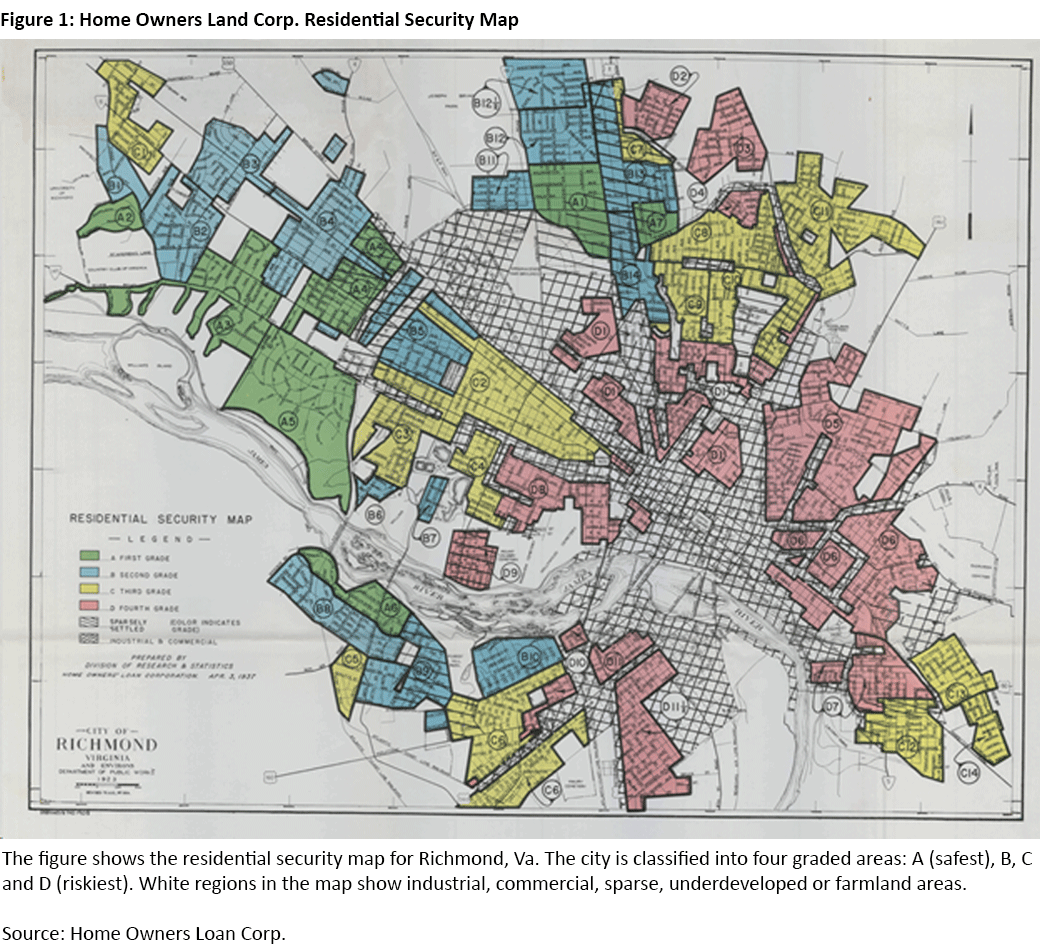
Areas classified as hazardous were generally those with the highest shares of nonwhite population. HOLC maps institutionalized redlining and plausibly influenced the practices of both the Federal Housing Administration (FHA) and private lenders.1 As shown in other studies, neighborhood differences along dimensions like racial composition, homeownership rates, housing values and rents increased after the introduction of the maps, peaking around the 1970s before beginning to decline following the implementation of Fair Lending laws.2
Does Historical Redlining Still Have an Impact Today?
Our approach involved matching geographic information from the old residential risk maps with loan origination data from the confidential version of the Home Mortgage Disclosure Act for the period 2018 to 2021. The risk score attributed by HOLC to a mapped neighborhood changed discretely at its boundary: Communities on one side of a boundary experienced restricted access to mortgage credit, while communities on the other side were less constrained by mortgage lenders. The discrete change suggests a regression discontinuity approach for evaluating the long-term effects of the risk scores, forming a discontinuity in longitude-latitude space. We document that borrower characteristics like credit risk (FICO) scores and loan-to-value (LTV) ratios are generally very similar across adjacent census tracts. Thus, our methodology compares mortgage conditions for applications with basically the same race and risk on adjacent census tracts located on each side of HOLC boundaries repealed over 50 years ago. If adjacent geographies with different HOLC grades also differ along other dimensions (such as housing value and median household income), the estimated effects could be biased upwards, so we control for this by also considering propensity score matching methods based on several neighborhood features at the time the maps were drawn.
Testing for differences in mortgage lending terms across historical boundaries — and, in particular, whether these differences remain after controlling for factors that affect mortgage pricing on similar loans — is generally challenging due to omitted variables (such as credit scores) and the need to consider two dimensions of mortgage pricing menus: rates and fees.
To address the first point (omitted variables), we use a sample of homogeneous mortgage loans — first lien, fixed-rate, 30-year, single-family residential mortgages — securitized by the government-sponsored enterprises (GSEs) or insured by the FHA that went through one of the three main automated underwriting systems and were issued in adjacent census tracts (small geographic areas). We also control for all the business factors affecting mortgage prices used in the literature. This includes controlling for GSE (that is, Fannie Mae, Freddie Mac and the FHA) credit-risk pricing, which involves replicating the GSEs' loan level price adjustment matrix based on grid combinations of FICO and LTV scores. In additional exercises, we match neighborhoods by their characteristics in the 1930s (when the HOLC maps were drawn), and we assess redlining effects based on this subsample. We alternatively run propensity matching score exercises based on current neighborhood characteristics and analyze redlining effects on this subsample. Finally, we perform the analysis controlling for neighborhood groupings based on third-party classifications (in particular, Zillow neighborhoods).
To address the second point (rates and fees), the study analyzes both interest rates and fees including origination fees, discount points, lender credit, appraisal fees and other costs associated with purchasing and refinancing loans.
With these considerations in mind, we run econometric regressions that involve pairwise comparisons of C-coded versus D-coded adjacent neighborhoods and separately B-coded versus C-coded adjacent neighborhoods. The regression specifications have the mortgage pricing (interest rates or alternatively fees) paid by households as the dependent variable, and the explanatory variables include:
- Our first variable of interest: a dummy variable equal to 1 if the borrower is in the lower-graded side of the two sides being compared and 0 otherwise (for example, if comparing C vs D, a variable of 1 if the borrower is in D)
- The second variable of interest: a dummy variable equal to 1 if the borrower is a minority and 0 otherwise
- The controls described above to make sure we capture the mortgage pricing effects of being on the lower-graded side neighborhood or of being a minority
We also include the interaction of the first two explanatory variables in many specifications to assess the effect of being a minority in a lower-graded side neighborhood.
Our econometric analysis yields several findings on mortgage pricing:
- The mortgage rates and fees are modestly higher for borrowers on the historically lower-graded side of a boundary. That is, mortgage costs are higher for borrowers living on a C-coded side compared to those living on a B-coded side, and they are also higher for borrowers living on a D-coded side compared to those living on the C-coded side of a boundary.
- Mortgage rates and fees are modestly higher for minorities on either side of a boundary.
- The higher rates and fees that minorities pay are even higher on the historically targeted side of the boundary.
These results are economically larger and more statistically significant for more segregated cities, for riskier borrowers and for loans issued by the shadow banking system.3
More specifically, conditional on obtaining a loan, borrowers located in a C-coded area pay, on average, about 1.5 to 2 basis points more in interest rates and an additional 7 to 11 basis points in higher fees than borrowers in adjacent B areas. Borrowers in D-coded areas pay about 3 basis points in additional fees relative to a similar borrower in an adjacent C-coded area.
We find that minorities, irrespective of where they live, pay 3 to 5 basis points more in mortgage interest rates and 20 to 30 basis points more in fees than non-minorities. Minorities living in formerly targeted neighborhoods pay an additional 1.5 basis points in higher interest rates and 6 to 9 basis points in higher fees than minorities living in non-targeted areas. The study also finds that such price differentials are higher in cities where minorities are confined in specific suburbs and are not widespread within the entire city.
It is further shown that most types of lenders charge higher interest rates, and particularly higher fees, in the targeted areas. The largest differences correspond to shadow banks, and the economically smallest and statistically weakest differences correspond to small banks.
Our data show that the share of mortgage loans originated by shadow banks is larger in targeted areas than in non-targeted areas. Also, while the branch presence of traditional lenders in targeted areas is not lower than in non-targeted areas, the share of mortgage loans originated by traditional lenders in targeted areas is relatively lower than in non-targeted areas.
Finally, our analysis shows that rejection rates of mortgage applications for borrowers in targeted areas are 0.2 to 0.5 percentage points higher. Rejection rates for minorities (irrespective of geography) are 3.1 to 3.5 percentage points higher than non-minorities, and about 4 percentage points higher for minorities in targeted areas.
Conclusion
The results of our analysis may have implications for policies aimed at promoting credit access in previously redlined neighborhoods, where we document that differential credit access rooted in historic biases seems to persist, to some degree. We also find that the differential mortgage pricing in these neighborhoods is larger for shadow banks. In contrast to areas that were not redlined, mortgage issuance by nonbank lenders (shadow banks and fintech companies) in previously redlined neighborhoods represents a larger market share compared to traditional bank lenders. Finally, we document that borrowers in previously redlined areas and minorities experience higher mortgage application rejection rates. Our results might inform discussions regarding policies that aim to increase competition and improve financial services access to formerly redlined neighborhoods.
Andrew Ellul is a professor of finance at Indiana University. David Marquez-Ibanez is an economist at the European Central Bank. Alex Sclip is a professor at the University of Verona. Horacio Sapriza is a senior economist and policy advisor, and Jack Taylor is a research associate, both in the Research Department at the Federal Reserve Bank of Richmond.
1
For example, see the 1980 paper "Race, Ethnicity and Real Estate Appraisal: The Home Owners Loan Corporation and the Federal Housing Administration" by Kenneth Jackson.
2
For example, see the 2021 paper "The Effects of the 1930s HOLC 'Redlining' Maps" by Daniel Aaronson, Daniel Hartley and Bhashkar Mazumder.
3
We use the definition of shadow banks found in the 2018 paper "Fintech, Regulatory Arbitrage and the Rise of Shadow Banks" by Greg Buchak, Gregor Matvos, Tomasz Piskorski and Amit Seru.
To cite this Economic Brief, please use the following format: Ellul, Andrew; Marques, David; Sapriza, Horacio; Sclip, Alex; and Taylor, Jack. (July 2024) "Redlining and U.S. Residential Mortgage Market Pricing." Federal Reserve Bank of Richmond Economic Brief, No. 24-21.
This article may be photocopied or reprinted in its entirety. Please credit the authors, source, and the Federal Reserve Bank of Richmond and include the italicized statement below.
Views expressed in this article are those of the authors and not necessarily those of the Federal Reserve Bank of Richmond or the Federal Reserve System.
Subscribe to Economic Brief
Receive a notification when Economic Brief is posted online.
Contact Us