Tariff Update: Incorporating Recent Decisions and Deals
Economic Brief
June 2025, No. 25-23
Key Takeaways
- We updated our analysis of how the latest tariff announcements would affect the average effective tariff rate (AETR).
- Following the recent court decisions and deals with China and the U.K., we find that the AETR currently sits at 17.4 percent, down from 27.5 percent immediately following the April 9 announcement.
- We also introduced an "impact factor" that estimates how tariffs affect the cost of intermediate inputs used in production.
In March, we introduced a benchmark measure of the average effective tariff rate (AETR), using detailed trade data for 2024. We subsequently updated this analysis to reflect the tariff announcements on April 2 (commonly referred to as "Liberation Day") and April 9. This article provides another update by incorporating recent court decisions involving these tariff announcements as well as trade agreements with the U.K. and China, described later in this article in more detail.
As in our previous analysis, we report AETRs by country and industry. While the industry-level AETR reflects the direct cost of importing goods into a specific sector, it does not account for broader production linkages across the economy. Since industries rely on inputs from both domestic and foreign sources (including inputs from other sectors), we complement this measure with an "impact factor" that estimates how tariffs affect the cost of intermediate inputs used in production. We construct this metric using input-output data from the Bureau of Economic Analysis (BEA) to capture the upstream exposure of each industry to tariffs. While the measure does not account for changes in wages, investment behavior or supply chain restructuring, it provides a first step toward identifying which sectors and geographical regions are most vulnerable to proposed tariff increases.
The 2025 Tariffs
Using the same methodology employed in our previous analysis, we compute the AETR implied by each major policy announcement since January 2025. In calculating the AETR, we hold import shares by country and product fixed at their 2024 levels. This approach isolates the impact of the tariff announcements themselves, abstracting from any endogenous adjustment by firms or consumers in response to changing trade policy. Figure 1 traces the cumulative impact of these announcements, showing how successive tariff measures (particularly those in March and April) contributed to sharp increases in the AETR.
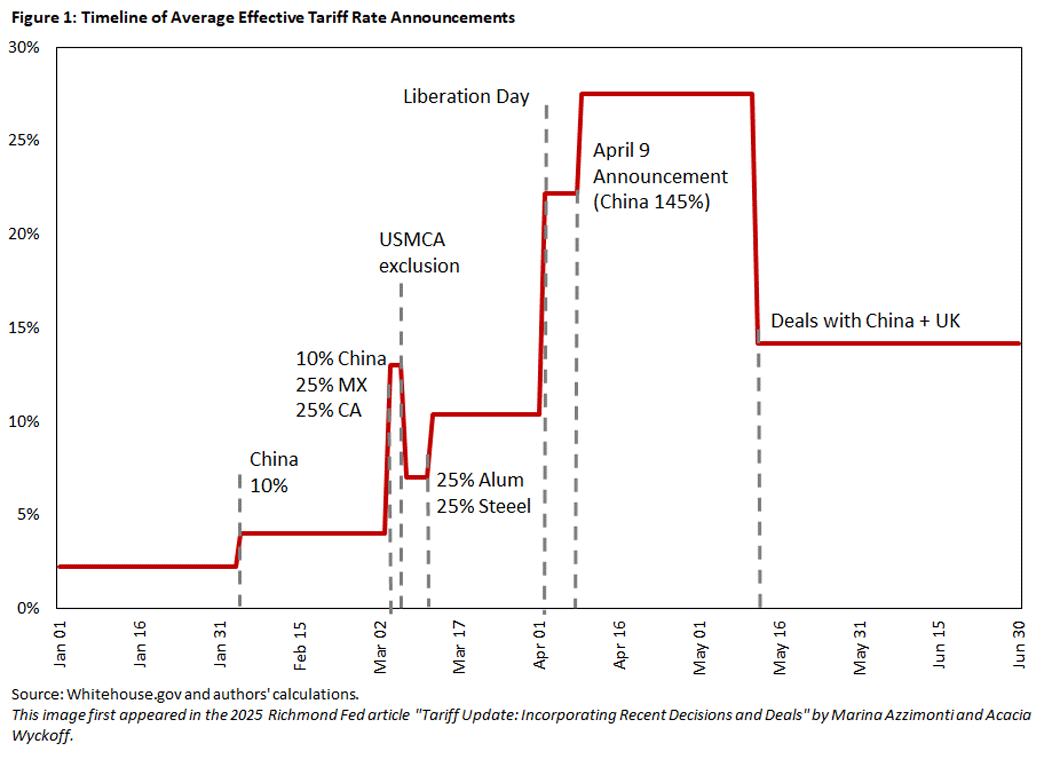
The AETR at the beginning of the year was about 2.3 percent. Figure 1 shows the rapid escalation of trade barriers beginning in early March — when the U.S. imposed a 20 percent tariff on Chinese imports and a 25 percent tariff on goods from Mexico and Canada — increasing the AETR to over 13 percent. These measures were partially offset by temporary exclusions under the United States-Mexico-Canada Agreement (USMCA), which reduced the AETR to 7 percent. However, the imposition of 25 percent tariffs on aluminum and steel in mid-March raised the AETR to about 9.9 percent.
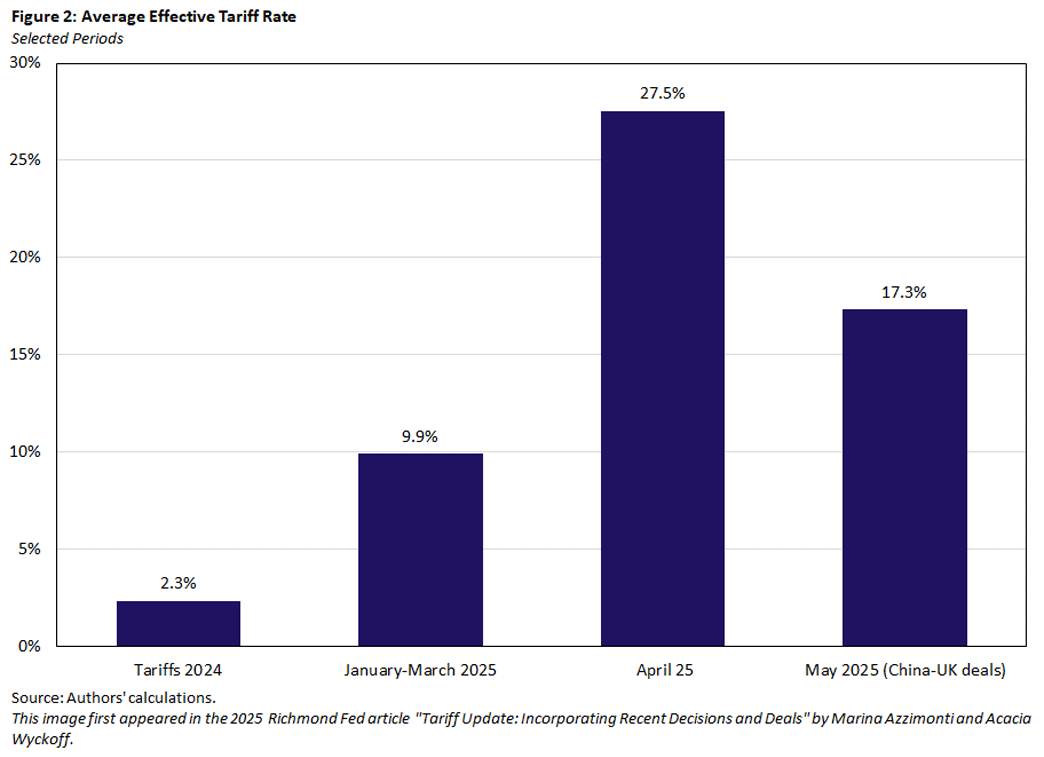
On April 2, the administration significantly expanded tariff coverage through the introduction of "reciprocal tariffs," which are tariffs applied in varying amounts across countries. These measures extended to trade partners that had previously been largely exempt from tariffs — including Japan, Vietnam and the European Union — and raised the AETR to 22.2 percent.
Just one week later, these tariffs were paused and replaced by a new structure: a 10 percent uniform tariff on imports from all countries, with the exception of China, which became subject to a sharply elevated 145 percent tariff. This move — aimed at addressing persistent trade imbalances and "unfair trade practices" — caused the overall AETR to actually increase to 27.5 percent due to China's significant weight in U.S. imports.
On May 12, the U.S. and the U.K. announced a trade deal that involves reductions on tariffs in the automotive and steel sectors. On the same day, the U.S. announced a truce with China, marking a significant shift in trade policy developments following successful negotiations in Geneva.1 Under the agreement, both countries committed to lowering recently imposed tariffs by 115 percent while retaining a 10 percent baseline tariff (effective May 14), as well as the 20 percent tariffs imposed earlier this year. China agreed to suspend its retaliatory measures, including the 34 percent tariff announced on April 4, while the U.S. rolled back additional tariffs imposed on April 8 and 9, preserving only those in place prior to April 2.2 The deal signals a temporary pause in escalation and sets the stage for future dialogue on market access, while maintaining a structured tariff floor.
On May 29, the U.S. Court of International Trade ruled that the International Emergency Economic Powers Act (IEEPA) cannot be used to impose broad import taxes, effectively challenging the legal basis of the Liberation Day tariffs. However, on May 30, a federal appeals court issued a stay of the lower court's ruling, allowing the current tariffs policy to remain in place. As of now, it remains uncertain whether the tariffs will ultimately take effect. (For the purposes of this article, we assume that they do.)
Where Things Stand: Tariff Measures Currently in Effect
As of this writing, the following tariff measures in effect are:
- 20 percent tariff on all imports from China, effective Feb. 4 and increased on March 4
- 25 percent tariff on all automobile imports — with an exemption for vehicles meeting U.S. content thresholds and autos and parts exempt from the USMCA — announced Feb. 12 and effective April 2
- 25 percent tariff on all aluminum and steel imports,3 announced Feb. 10 and effective March 12
- 10 percent tariff on Canadian potash and energy, announced Feb. 1 and effective April 2
- 25 percent tariff on all imports from Mexico and on Canadian imports not covered under the USMCA (except for energy and potash from Canada), announced Feb. 1 and effective March 4
- 10 percent in most countries (including China), effective April 9
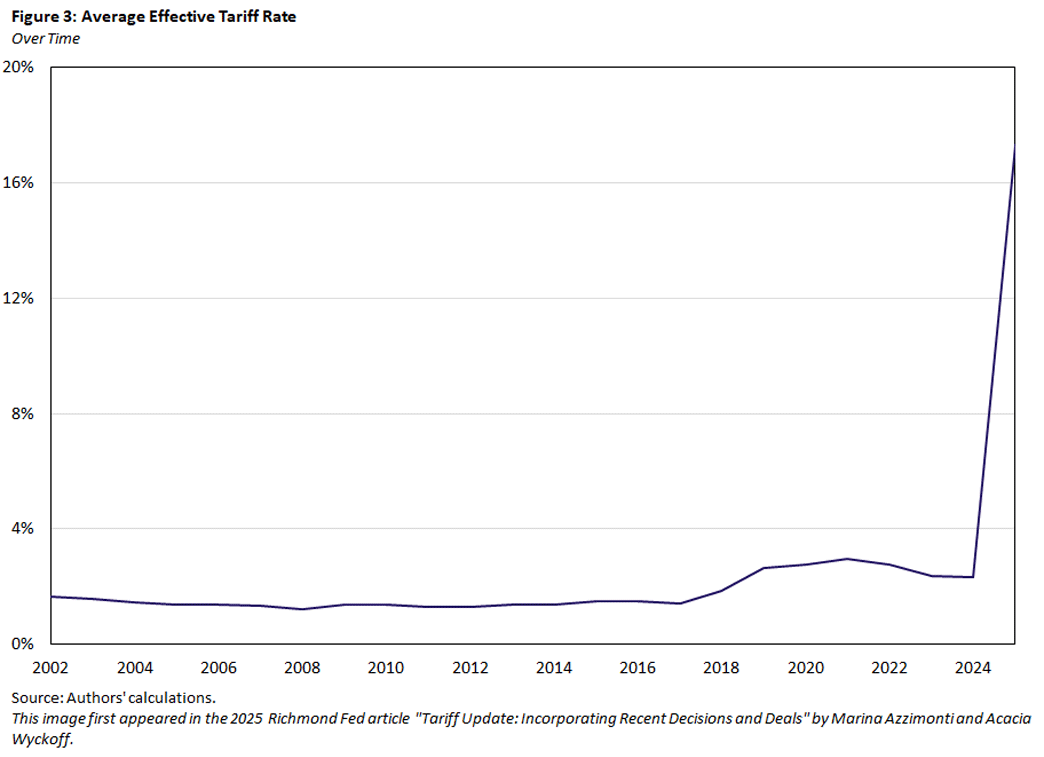
The AETR implied by the current measures stands at 17.3 percent, still a significant departure from the relatively stable 2 percent experienced from 2002 to 2024, as seen from Figure 3.
AETRs by Country and Sector
Country
Table 1 presents the AETRs for the U.S.'s largest trading partners, based on their import shares and the evolving tariff policy landscape in 2025.
| Origin Country | Import Share | Tariffs 2024 | January-March 2025 | April 2025 | May 2025 |
|---|---|---|---|---|---|
| EU | 18.5 | 1.2 | 4.4 | 10 | 10 |
| Mexico | 15.5 | 0.2 | 10.4 | 10.4 | 12.9 |
| China | 13.4 | 10.7 | 31.4 | 135.9 | 56.6 |
| Canada | 12.6 | 0.1 | 8.6 | 8.6 | 10.4 |
| Japan | 4.5 | 1.5 | 10.4 | 15.8 | 15.8 |
| Vietnam | 4.2 | 3.9 | 6.4 | 15.3 | 15.3 |
| South Korea | 4 | 0.2 | 10.8 | 15.4 | 15.4 |
| India | 2.7 | 2.4 | 4.1 | 11.2 | 11.2 |
| UK | 2.1 | 1 | 6.3 | 12.1 | 2.8 |
| Switzerland | 1.9 | 0.6 | 1 | 6.7 | 6.7 |
| Thailand | 1.9 | 1.6 | 3.9 | 12.6 | 12.6 |
| Malaysia | 1.6 | 0.6 | 3.5 | 10.2 | 10.2 |
| AETR | 100 | 2.3 | 9.9 | 27.5 | 17.3 |
| Source: Authors' calculations. | |||||
The baseline AETR per country in 2024 can be found in the "Tariffs 2024" column, whereas the additional increases from tariff measures implemented between January and March are in the "January-March 2025" column. The "April 2025" column captures the cumulative impact of policy announcements through April 9, including the broad-based 10 percent tariff and the 145 percent tariff on Chinese imports.
In 2024, AETRs were generally low due to existing trade agreements — including near zero for Canada and Mexico under USMCA — and preexisting Section 301 tariffs on China. After the April 9 policy shift, AETRs increased sharply across most partners, with China's rate reaching 135.9 percent (slightly below the headline rate due to product-level exemptions).
The final column reflects the updated AETRs following the U.S.-China and U.S.-U.K. trade agreements finalized in May. These deals substantially reduced tariff rates for both countries, though they remain well above 2024 levels. For example, China's AETR declines to 56.6 percent (nearly five times its pre-2025 level), while the U.K.'s AETR falls to 2.8 percent, more than doubling its 2024 rate.
Sector
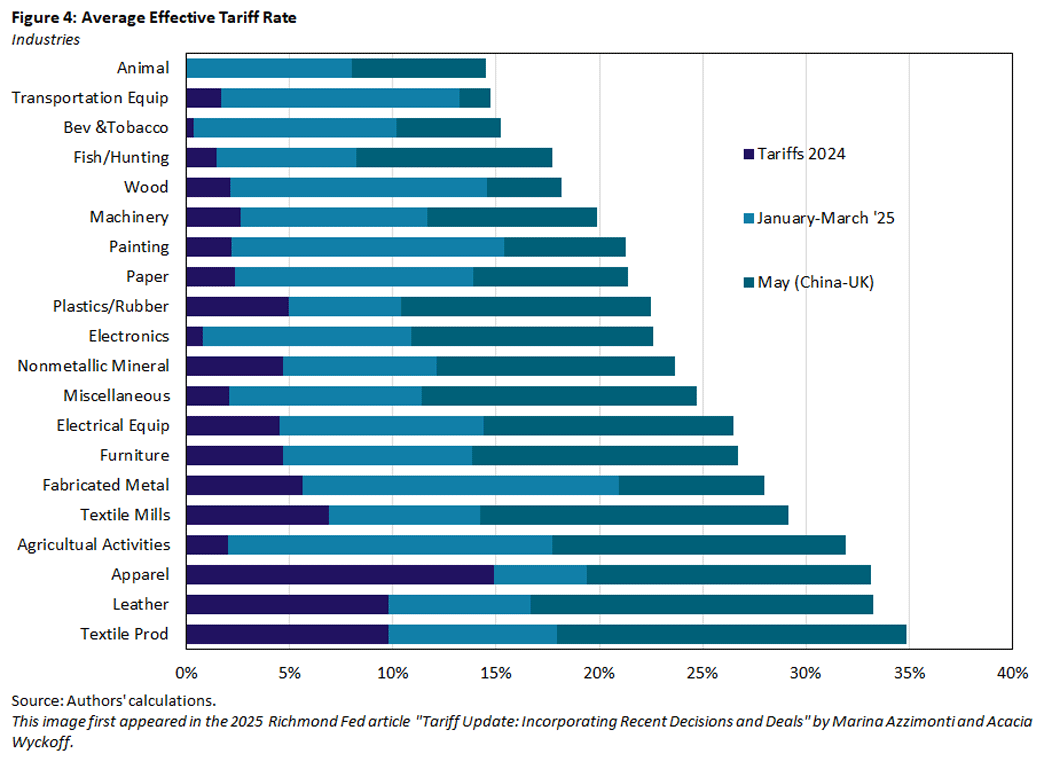
Figure 4 presents AETRs by sector and compares the 2024 baseline, the cumulative impact of tariff measures introduced between January and March 2025, and the rates after incorporating the May trade agreements with China and the U.K. Sectors are ordered by their final AETR, making clear that industries such as textiles, apparel, leather and agricultural support activities face the steepest increases, which reflects their higher import exposure to Chinese goods. In contrast, sectors like animal products, transportation equipment, and beverages and tobacco remain relatively less affected. Notably, the AETR for transportation equipment is lower than previously projected due to exemptions for U.S.-origin parts and vehicles qualifying under the USMCA as well as the exception on auto imports from the U.K., which mitigated some of the effect of earlier 25 percent tariff announcements on autos.
The Importance of Tariff Spillovers
Tariffs targeted at a particular industry can have wider effects across the economy due to input-output relationships among sectors (so-called "tariff spillovers"). In other words, a tax on one industry's products can indirectly raise costs for other industries that use those products as inputs.
To properly assess how tariffs affect production costs, it is important to look beyond a sector's own AETR and consider these inter-industry linkages. The following are some key points illustrating why focusing on sectoral AETRs alone can be misleading.
Small Import Share
A high tariff in one sector may have a minor aggregate impact if that sector constitutes only a small slice of the import pie of that industry. For example, textiles face relatively high import duties yet make up only about 0.7 percent of total U.S. imports. This limits their weight in the overall import basket and, hence, the effect on all industries that use it as an intermediate input. In such cases, even a steep tariff on textiles would barely move the needle on economy-wide import costs.
Input Sourcing Matters
A high sectoral AETR does not automatically translate into large cost pressures for all domestic producers. If firms in that sector rely mostly on domestic suppliers or source their inputs from other sectors with lower tariffs, they can avoid much of the direct impact of the tariff. In effect, companies may buffer themselves by using untaxed or lower-tax inputs, so the high tariff doesn't substantially raise their production costs.
Network Spillovers
Industries are interconnected, so tariffs can spill over via supply chains. If Sector A's outputs are used as inputs by Sector B, then a tariff on Sector A's goods effectively raises input costs for Sector B. Conversely, if a key input sector faces low or zero tariffs, it can help ease cost pressures downstream. These input-output linkages mean the burden of a tariff isn't confined to the sector that directly imports the taxed goods. It can ripple through to affect costs in other sectors as well.
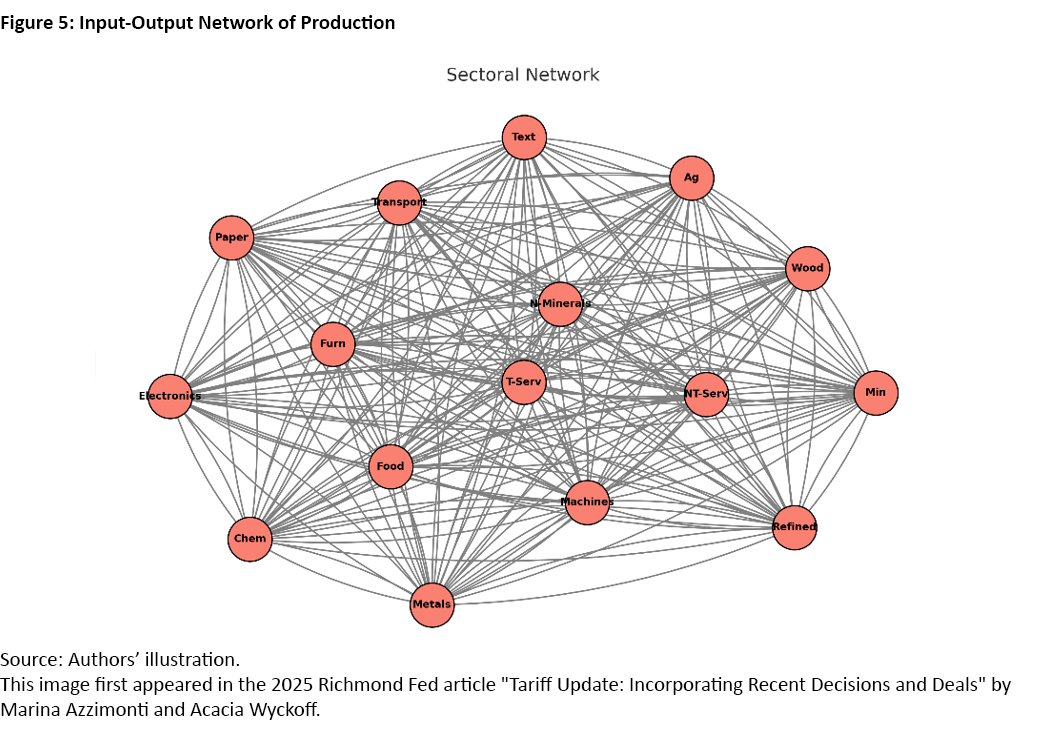
Figure 5 illustrates these interdependencies among sectors. Each node represents an industry — "Text" for textiles, "Chem" for chemicals, etc. — and each gray link indicates that one industry uses another's output as an intermediate input. A tariff-induced cost increase at one node can propagate to connected nodes, demonstrating how an import tax on one sector's product becomes an import tax on its downstream users through these linkages. Because of these connections, a simple sector-level AETR can understate true cost impacts.
The Impact Factor: Industry Analysis
Policymakers and analysts need to account for tariff spillovers — particularly from network spillovers — to fully understand how tariffs raise production costs across the economy. To that end, we provide a measure we've termed an "impact factor" using data from the BEA. These data detail how much a particular industry relies on inputs from every other industry, using the sectors listed in Figure 4. It also provides information on the value of imported inputs in each node in the production network, which allows us to compute the share of imports on a sector's output.
The impact factor for each industry accounts for the import intensity of each industry from each country under consideration, the share of domestic and imported inputs from other industries on its value added, and the tariffs applied on imported inputs from other industries. (See the appendix for the technical details of the impact factor's construction.)
Figure 6 displays the computed impact factor for each industry, offering a more comprehensive view of how tariff policy may influence sectoral production costs beyond direct import exposure.
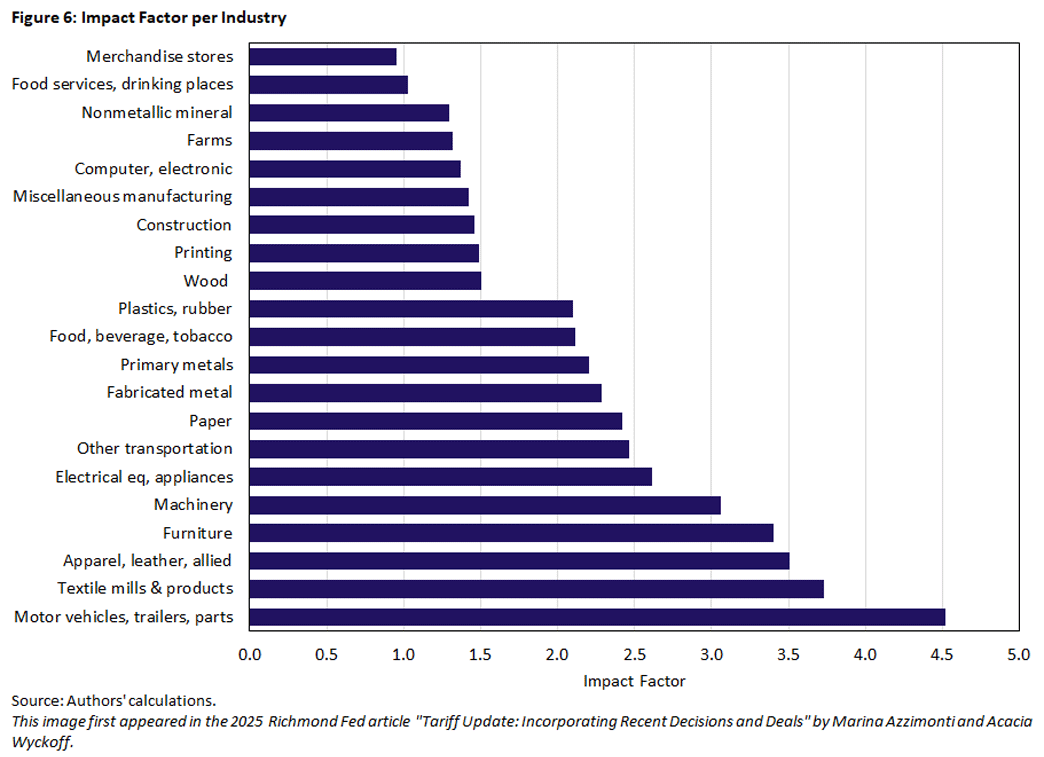
Unlike AETRs — which only reflect the cost of importing goods into a particular industry — the impact factor looks at how tariffs ripple through the supply chain. This means the factor captures not just direct imports, but also imported materials and components used in production (in reduced form).
The motor vehicles, trailers and parts sector exhibits the highest impact factor, followed closely by textile mills and products, apparel and leather goods, and furniture. These sectors are particularly reliant on imported intermediate goods now subject to higher tariffs. For instance, automobile manufacturers often depend on imported parts and electronic components, while textile and apparel producers rely heavily on foreign-made fabrics and accessories.
In contrast, sectors at the lower end of the chart — such as merchandise stores, food services and nonmetallic minerals — have relatively low impact factors. These industries either depend more on domestic inputs or have limited exposure to internationally sourced goods, making them less vulnerable to rising import costs from the new tariffs.
While Figure 4 reports the AETR faced by each industry — measuring the direct tariff burden on its own imports — Figure 6 presents a more comprehensive estimate of the likely cost pressures resulting from those tariffs. The impact factor accounts not only for the sector's own AETR but also for the tariffs applied to inputs used throughout its supply chain, weighted by their importance in production. As a result, it better captures how tariff-induced cost increases propagate through the economy. The comparison between the two figures reveals that a high AETR does not necessarily translate into high cost pressure.
For example, while the farming sector faces a relatively high AETR (around 30 percent), it relies heavily on domestic inputs and sectors with low tariffs, resulting in a modest estimated cost increase of less than 2 percent. In contrast, the motor vehicles sector — though not facing the highest AETR due to exemptions under the USMCA and the U.K. deal — exhibits the highest impact factor, suggesting its production costs could rise by over 4 percent. This reflects the sector's reliance on a wide array of imported intermediate goods from industries with elevated tariff exposure. By incorporating these network effects, the impact factor in Figure 6 provides a more accurate picture of which sectors are likely to experience the most significant production cost increases under the current tariff regime.
Ultimately, while AETRs are useful for understanding where tariffs are applied most directly, the impact factor offers a more complete view of where tariffs are likely to have the greatest economic effect, especially in an economy with strong sectoral links and global supply chains.
The Impact Factor: Regional Analysis
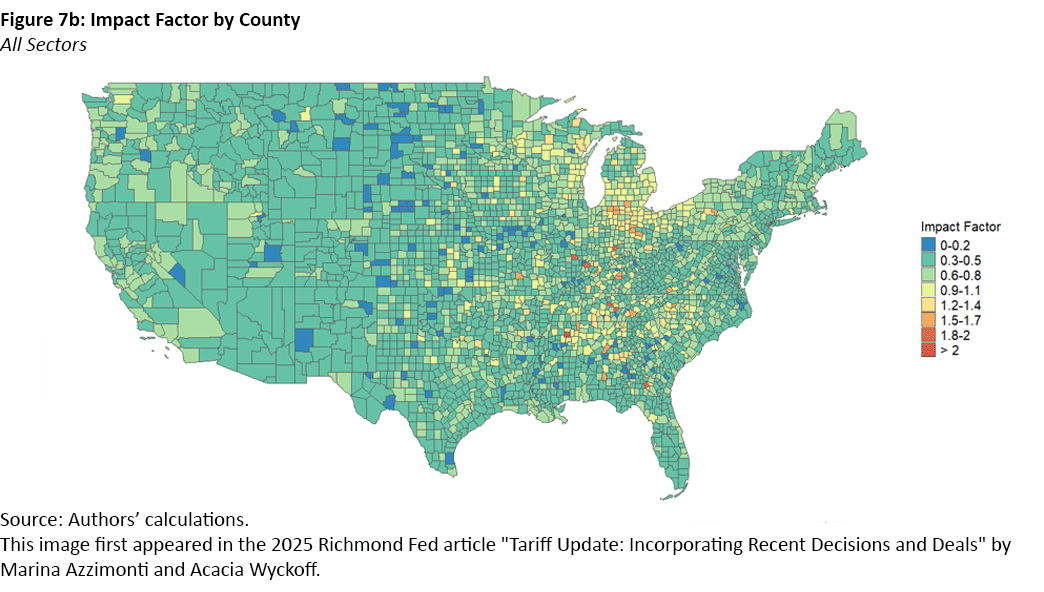
Figure 7 displays the impact factor by U.S. county, quantifying how exposed local economies are to rising production costs from tariffs on imported intermediate goods. Figure 7a shows the impact factor for each county based only on intermediate-good sectors that see direct imports, reflecting a similar methodology to previous AETR maps. Figure 7b shows the impact factor after incorporating all sectors.
With our new impact factor calculations, we can now think about the impacts of tariffs on sectors that can't be directly imported, such as restaurants or hospitals. From the two maps, it is clear that considering the effect of tariffs on all sectors increases the overall impact, but the heterogeneity across counties appears to still be mostly associated with intermediate-good production.
The impact factor — derived using industry-specific input-output relationships and import exposure — varies significantly across regions, reflecting differences in local industrial composition. Most counties across the western, southwestern and central U.S. — particularly in states like Texas, Arizona and Nevada — exhibit low impact factors, shaded in blue tones when only factoring in intermediate sectors (indicating values close to zero) and green tones once factoring in overall impact. These areas are likely dominated by sectors that either rely less on imported inputs or are more heavily rooted in domestic supply chains, such as agriculture, mining or localized services.
In contrast, counties in parts of the Midwest, Southeast and Mid-Atlantic regions — including stretches of Indiana, Kentucky, Tennessee, Ohio and North Carolina — show elevated impact factors, shaded in yellow and red. These areas are more exposed to tariff-driven cost increases, likely due to concentrations of manufacturing activity — particularly in textiles, apparel, chemicals, machinery and electronics — which depend more heavily on imported components.
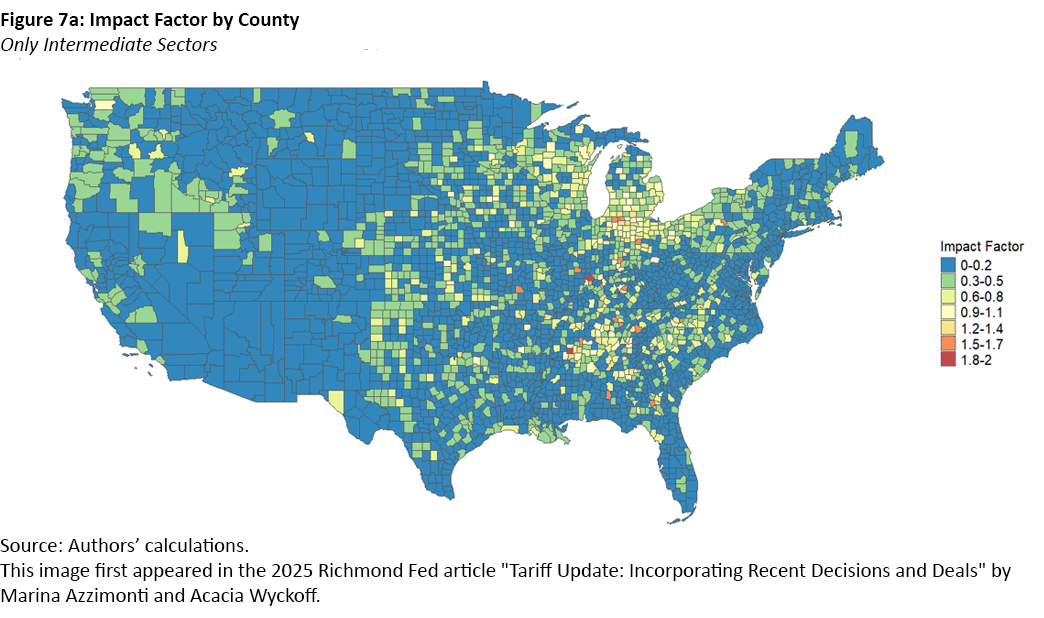
Notably, industrial regions around the Great Lakes and portions of the Upper South also show high exposure. These regional hotspots are critical to the U.S. manufacturing base and may face disproportionate cost pressures under the current tariff regime.
Overall, the map illustrates that the effects of tariffs are geographically uneven: Localized manufacturing-intensive regions are bearing a greater share of the indirect costs through supply chain channels, while many rural or agriculture-dominated areas remain relatively insulated. However, once factoring in the impacts to all sectors and not just those explicitly involved in production, virtually all counties across the U.S. will be affected by the new tariffs.
Marina Azzimonti is a senior economist and research advisor and Acacia Wyckoff is a research associate, both in the Research Department at the Federal Reserve Bank of Richmond.
1
From the trade deal announcement, it is not clear whether the tariffs on autos, aluminum and steel apply to Chinese imports. For this calculation, we are assuming that they are still in place.
2
This includes Section 301 and 232 duties.
3
An additional increase of 25 percent to aluminum and steel has been announced but not implemented as of this writing.
To cite this Economic Brief, please use the following format: Azzimonti, Marina; and Wyckoff, Acacia. (June 2025) "Tariff Update: Incorporating Recent Decisions and Deals." Federal Reserve Bank of Richmond Economic Brief, No. 25-23.
This article may be photocopied or reprinted in its entirety. Please credit the authors, source, and the Federal Reserve Bank of Richmond and include the italicized statement below.
Views expressed in this article are those of the authors and not necessarily those of the Federal Reserve Bank of Richmond or the Federal Reserve System.
Subscribe to Economic Brief
Receive a notification when Economic Brief is posted online.
Contact Us