Predicting PCE Using the Richmond Fed Price Measure
Economic Brief
December 2025, No. 25-44
Key Takeaways
- The Richmond Fed survey measure of price changes comes out a month earlier than the PCE measure of inflation. Because the Richmond Fed price measure is known earlier, we can use the contemporaneous measure to provide an estimate of inflation.
- An empirical model with contemporaneous and past inflation changes — as measured by the Richmond Fed's price survey — notably reduces the out-of-sample forecast error obtained from a benchmark random walk model of inflation.
- Using the Richmond Fed price survey data prior to the release of September PCE, we forecast September PCE inflation to move from 2.7 percent in August to 2.9 percent year over year at an annualized rate.
Indicators of current and future inflation are of keen interest to economists, policymakers and the general public. In this article, we explore the informational value of the Richmond Fed survey of businesses with respect to price changes. We find that a price measure constructed using these surveys can provide clear value to an inflation forecast.
Forecasting Inflation
A 2007 paper by James Stock and Mark Watson suggested that single equation inflation forecasting models can be grouped into four families:1
- Forecasts based solely on past inflation
- Forecasts based on activity measures (so called "Phillips curve forecasts")
- Forecasts based on the forecasts of others
- Forecasts based on other predictors
In a 2001 paper, Andrew Atkeson and Lee Ohanian argue that no standard Phillips curve forecast improves upon a four-quarter random walk benchmark in the period from 1984-1999.2 A pair of more recent papers by Stock and Watson confirm the result with one caveat:3 They argue that the performance of the random walk depends on both the sample period and the forecast horizon. Still, on average and over time, Phillips curve forecasts do not outperform univariate benchmarks.
We start our analysis by exploring the relationship between PCE inflation and a measure of price change developed through the Richmond Fed surveys of business activity. We then evaluate the statistical significance and predictive contribution of the Richmond Fed price measure to a standard inflation forecast. As a benchmark, we consider a random walk model of inflation modified to include two-lag-of past inflation changes.
Both an in-sample and an out-of-sample forecasting exercise indicate that the contribution of the Richmond Fed price measure is statistically and economically significant. It can also meaningfully reduce the forecast error from a model that relies on past PCE inflation alone. As with other estimations, time horizon matters: The reduction in the mean squared error (MSE) is particularly meaningful in less predictable times, such as during the pandemic and in the postpandemic inflationary period.
The Richmond Fed Price Measure
Every month, the Richmond Fed gathers information on business activity from approximately 250 firms that span industries and geographies in the Fifth Federal Reserve District.4 Although questions have changed somewhat since the survey's inception in the early 1990s, the Richmond Fed has consistently asked firms since 2011 for the 12-month growth in the average price they receive from (that is, charge to) customers.
As we noted in a previous article, while many Reserve Banks run surveys of businesses and ask categorical questions (increase/decrease/stay the same) about price changes, the Richmond Fed is unique among Reserve Banks in asking a monthly percentage change question on a 12-month change in both prices received from customers and prices paid for inputs to production/service provision. In contrast to PCE inflation (which focuses on consumer prices), the Richmond Fed price measure gauges prices charged directly to both consumers and other businesses. Nonetheless, there is a strong correlation between the survey measure and year-over-year PCE inflation. Figure 1 shows the 12-month change in the PCE price index since 2011 against an average of our Richmond Fed price measure weighted by PCE consumption shares.
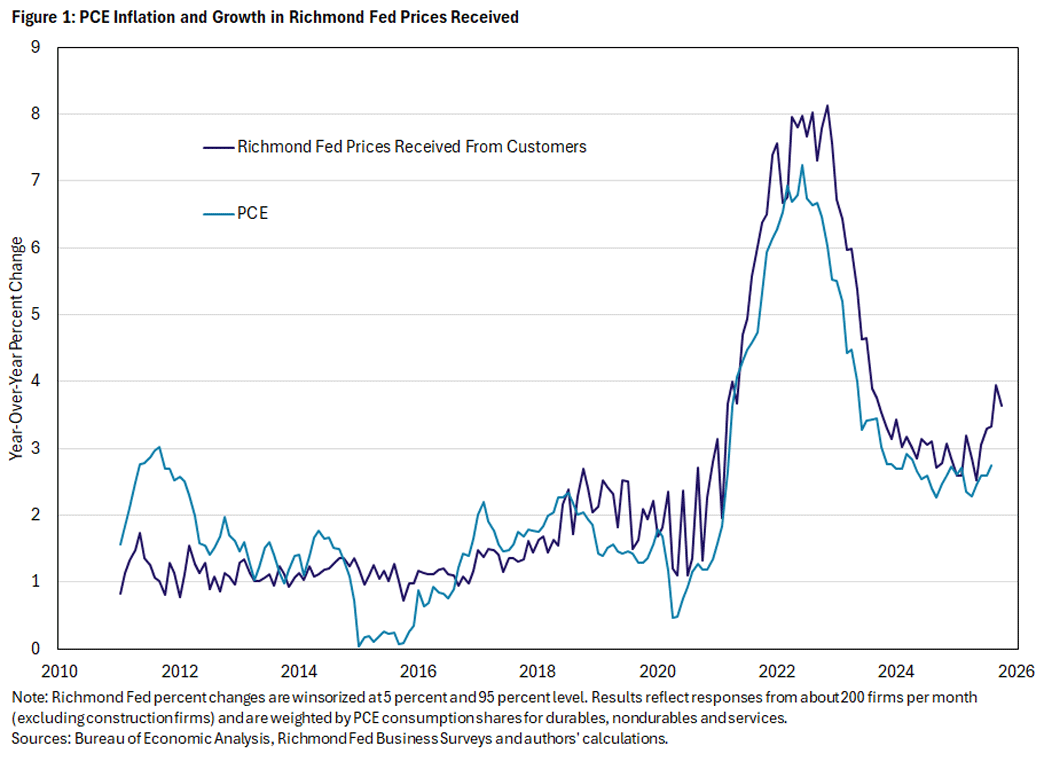
The Richmond Fed measure is also consistently released a full month prior to PCE. For example, the Bureau of Economic Analysis released the July PCE price index on August 29, while the Richmond Fed released its July price measure on July 22. We can take advantage of this timing mismatch to enhance the nowcasting accuracy of any model of inflation.
Monthly Change in the Richmond Fed Price Measure and the PCE
The first step is to better understand the relationship between month-to-month change in the year-over-year PCE price index and month-to-month change in the Richmond Fed price measure. Specifically, because businesses are only asked about year-over-year growth in prices, we consider inflation to be inflation over the last 12 months, and we consider the change in inflation to be the change in that year-over-year price growth from last month. Similarly, the Richmond Fed price measure is the weighted average of the year-over-year price growth reported by survey panelists. (A full description of the equations and variables we used in this article's analysis is available in our appendix.)
Perhaps not surprisingly because of the limited sample size of the Richmond Fed survey, since 2011, the change in 12-month price growth for the Richmond Fed measure is more volatile than the change in the PCE, as illustrated in Figure 2. Over this period, the monthly change in the Richmond Fed survey measure ranged from approximately -1.5 percentage points (pp) to 2pp. Meanwhile, the change in PCE inflation was more contained, ranging from approximately -0.8pp to 1pp.
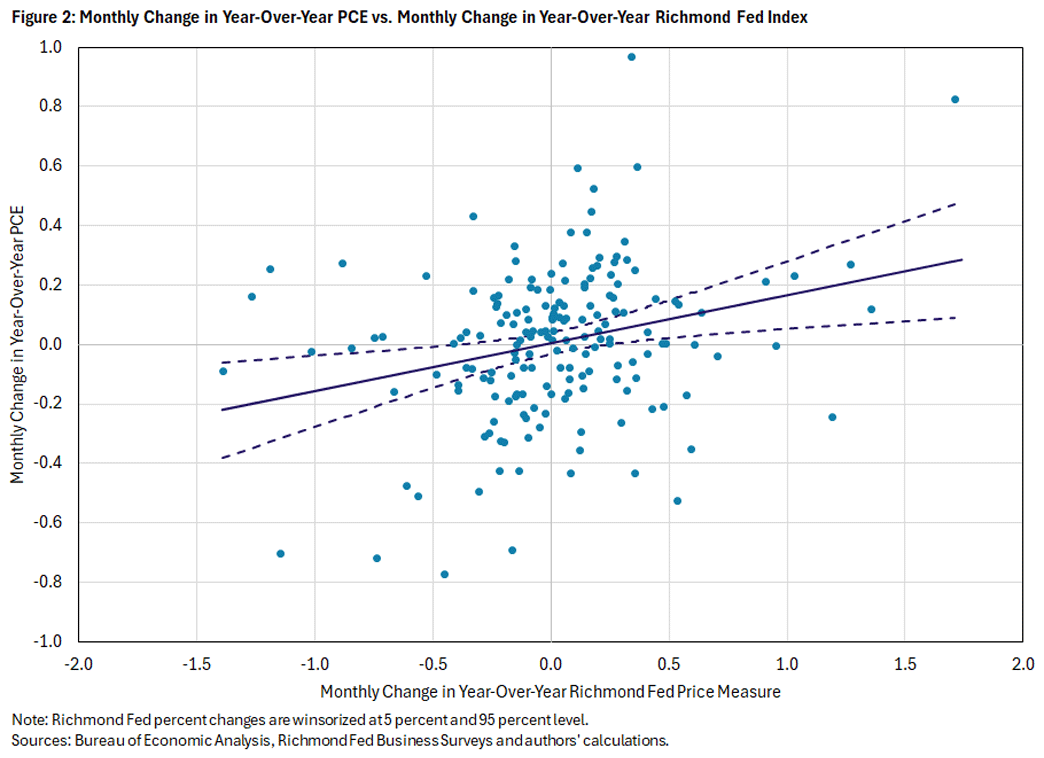
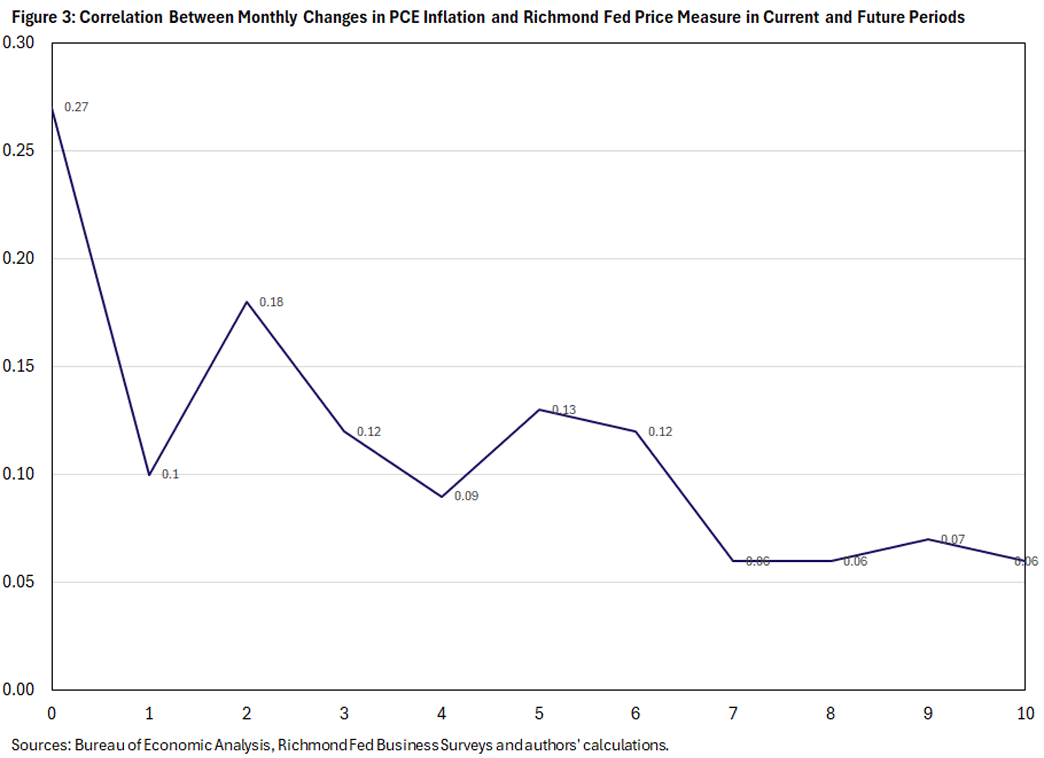
Figure 2 also illustrates a positive relationship between the change in PCE and the change in the Richmond Fed price measure. When the Richmond Fed price measure increases, PCE inflation is also likely to rise. Similarly, a decline in the Richmond Fed price measure is likely to precede a decline in year-over-year PCE. The correlation between the change in inflation and the change in the Richmond Fed price measure is highest in the same month. Figure 3 suggests that the Richmond Fed price measure is most likely to add value in nowcasting the same month of PCE release, possibly using up to two lags of the Richmond Fed price measure.
The question then becomes: Can the Richmond Fed price measure improve an inflation forecast that relies only on observed past inflation changes? To answer that question, as suggested by Figure 2, we add both contemporaneous and past inflation changes implied by the Richmond Fed surveys to a univariate benchmark model of the kind that previous papers find to outperform other types of inflation forecasts.
Forecasting Inflation With the Richmond Fed Price Measure
The first exercise is to evaluate the performance of the Richmond Fed price measure against a benchmark random walk model of inflation. We compare the random walk forecast to a forecast of inflation that incorporates the Richmond Fed price measure, which we call the "Richmond Fed forecast."
In the Richmond Fed forecast, we use the year-over-year change in the Richmond Fed price measure, the change in the year-over-year inflation rate from two months ago to the prior month, and the change in the year-over-year Richmond Fed price measure from the previous month to the current month.
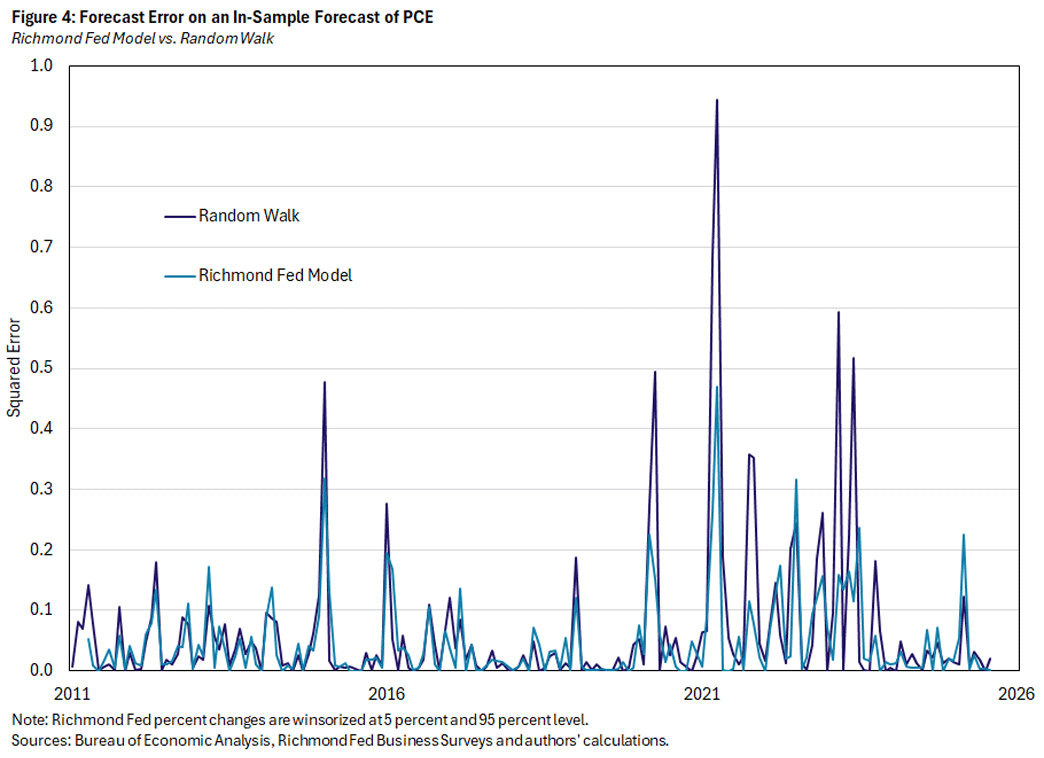
Figure 4 shows the forecast errors for an in-sample forecast using all available data from January 2011 through August 2025. The statistical significance of the Richmond Fed price measure (and lagged measure) is driven by its contribution to inflation prediction after 2020. This is clear from the regression tables below.
Although the Richmond Fed measure is significant at the 10 percent level when estimating the model only through February 2019, its real contribution comes after 2019: Including only the period prior to 2019 reduces the statistical significance of the Richmond Fed price measure. In the period 2011-2023, each coefficient on the Richmond Fed price measure (concurrent and lagged) is statistically significant.
| Coefficient | Standard Error | t | |
|---|---|---|---|
| Constant | -0.0027 | 0.0170 | -0.16 |
| Inflation Change in Survey at t | 0.1935 | 0.0517 | 3.74 |
| Inflation Change in Survey at t-1 | 0.1042 | 0.0528 | 1.97 |
| Inflation Change in Survey at t-2 | 0.1704 | 0.0521 | 3.27 |
| PCE Inflation Change at t-1 | 0.3466 | 0.0971 | 3.57 |
| PCE Inflation Change at t-2 | -0.1487 | 0.0702 | -2.12 |
| MSE | 0.0472 | ||
| Random Walk MSE | 0.0651 | ||
| t-statistics are computed using Newey-West (HAC) standard errors. | |||
| Coefficient | Standard Error | t | |
|---|---|---|---|
| Constant | -0.0087 | 0.0204 | -0.43 |
| Inflation Change in Survey at t | 0.1717 | 0.0976 | 1.76 |
| Inflation Change in Survey at t-1 | -0.0144 | 0.0935 | -0.15 |
| Inflation Change in Survey at t-2 | 0.0380 | 0.1139 | 0.33 |
| PCE Inflation Change at t-1 | 0.2814 | 0.1206 | 2.33 |
| PCE Inflation Change at t-2 | -0.0156 | 0.0928 | -0.17 |
| MSE | 0.0368 | ||
| Random Walk MSE | 0.0418 | ||
| t-statistics are computed using Newey-West (HAC) standard errors. | |||
| Coefficient | Standard Error | t | |
|---|---|---|---|
| Constant | -0.0034 | 0.0186 | -0.18 |
| Inflation Change in Survey at t | 0.2078 | 0.0530 | 3.92 |
| Inflation Change in Survey at t-1 | 0.1106 | 0.0547 | 2.02 |
| Inflation Change in Survey at t-2 | 0.1700 | 0.0549 | 3.10 |
| PCE Inflation Change at t-1 | 0.3627 | 0.1025 | 3.54 |
| PCE Inflation Change at t-2 | -0.1643 | 0.0731 | -2.25 |
| MSE | 0.0496 | ||
| Random Walk MSE | 0.0705 | ||
| t-statistics are computed using Newey-West (HAC) standard errors. | |||
Not only are the beta coefficients statistically significant over and above observed actual PCE inflation changes, their inclusion reduces the forecast error (or the MSE). As is clear from Table 2 and Figure 4, the Richmond Fed price measure improves the forecast particularly notably after 2020: Using the Richmond Fed measure in a model that extends from 2011 to 2023 reduces the MSE by 30 percent, compared to 27 percent in the full sample and only 12 percent in the model using data from January 2011 to February 2019.
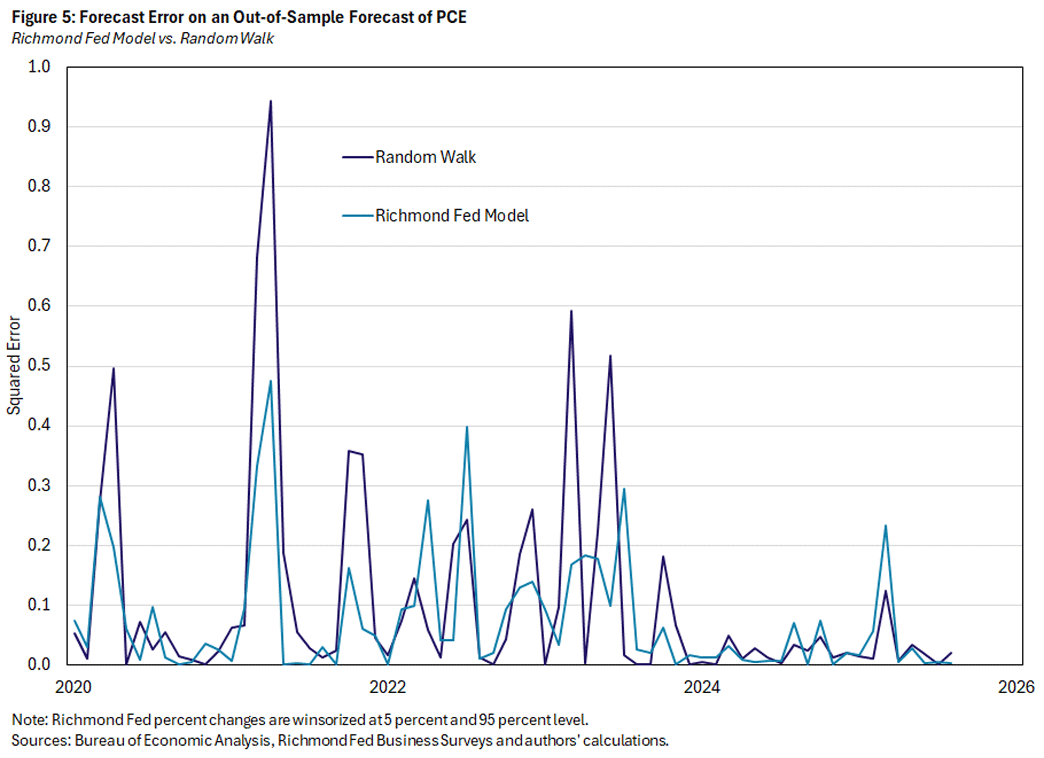
Predicting Inflation Out of Sample
The results above are based on all available data and, therefore, rely on information that would not have been available for forecasting in any period outside the most current month. To more fairly evaluate the forecast performance of a model that incorporates the Richmond Fed price measure, we run an out-of-sample forecast of PCE (using 2011-2015 as the base period) and compare predicted PCE inflation to actual PCE inflation. Since the forecast error looks different before and after the pandemic period, we look more closely at the results in February 2019, December 2023 and August 2025 (full sample). Figure 5 illustrates the improvement that the Richmond Fed measure gives over a random walk forecast of inflation even on an out-of-sample forecast.
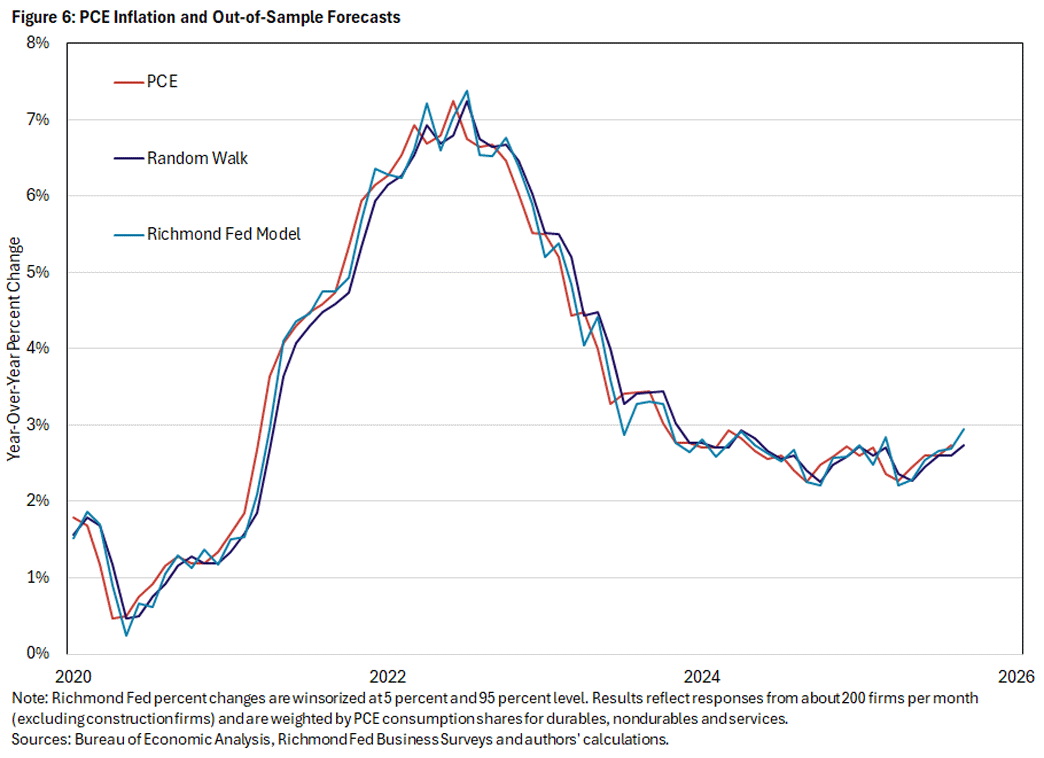
The improvement to the forecast by adding the Richmond Fed price measure is also clear in Figure 6, which shows the actual PCE, the out-of-sample forecast using a random walk and the out-of-sample forecast using the Richmond Fed model. The Richmond Fed model forecast is closer than the random walk forecast to actual PCE most notably since the pandemic period in 2020.
The Bottom Line
Since PCE data were only available through August when we ran the model at the end of November, we used the Richmond Fed model to predict headline PCE in September. The result is in Figure 7 and Table 2. We predicted September PCE to be 2.9 percent year over year, moving from 2.7 percent year over year in August. This move was directionally the same as the PCE, which reported 2.8 percent year-over-year change in its Dec. 5 release.
| Actual PCE | Nowcast of PCE | |
|---|---|---|
| July 2025 | 2.6 | 2.7 |
| August 2025 | 2.7 | 2.7 |
| September 2025 | 2.8 | 2.9 |
| *Using the forecast for September for one-month lagged inflation because no actual values are available. | ||
The Richmond Fed collects unique data on price realizations from firms. Because the Richmond Fed price measure gives us an estimate of inflation a month before inflation for that month is available, we can use the Richmond Fed measure in place of an instrument in an inflation forecast. We find the price measure derived from these data to be a productive way to improve any prediction of inflation.
Zach Edwards is a research analyst, Pierre-Daniel Sarte is a senior advisor, and Sonya Ravindranath Waddell is a vice president and economist, all in the Research Department at the Federal Reserve Bank of Richmond.
1
See the 2007 paper "Why Has U.S. Inflation Become Harder to Forecast?" by James Stock and Mark Watson.
2
See the 2001 paper "Are Phillips Curves Useful for Forecasting Inflation?" by Andrew Atkeson and Lee Ohanian.
3
See the previously cited paper "Why Has U.S. Inflation Become Harder to Forecast?" and the 2016 paper "Core Inflation and Trend Inflation," also by Stock and Watson.
4
The Fifth District includes most of West Virginia and all of Maryland, North Carolina, South Carolina, Virginia, and Washington, D.C.
To cite this Economic Brief, please use the following format: Edwards, Zach; Sarte, Pierre-Daniel; and Waddell, Sonya Ravindranath. (December 2025) "Predicting PCE Using the Richmond Fed Price Measure." Federal Reserve Bank of Richmond Economic Brief, No. 25-44.
This article may be photocopied or reprinted in its entirety. Please credit the authors, source, and the Federal Reserve Bank of Richmond and include the italicized statement below.
Views expressed in this article are those of the authors and not necessarily those of the Federal Reserve Bank of Richmond or the Federal Reserve System.
Subscribe to Economic Brief
Receive a notification when Economic Brief is posted online.
Contact Us