The Richmond Fed Price Measure: An Input Into Inflation Prediction
Macro Minute
November 4, 2025
Every month since 2011, the Richmond Fed has asked 200-250 regional businesses the same questions regarding their 12-month realizations and 12-month expectations for the prices they receive from their customers. These price changes are reported for manufacturers and non-manufacturers on the fourth Tuesday of every month, which is a full month prior to the release of the PCE price index.
While many Reserve Banks run surveys of businesses and ask categorical questions (increase/decrease/stay the same) about price changes, the Richmond Fed is unique among Reserve Banks in asking a monthly percentage change question on a 12-month change in both prices received from customers and prices paid for inputs to production/service provision. These data are used to construct the Richmond Fed price measure.
In contrast to PCE inflation (which focuses on consumer prices), the Richmond Fed price measure gauges prices charged directly to both consumers and other businesses. Nonetheless, there is a strong correlation between the survey measure and year-over-year PCE inflation. Figure 1 below shows the 12-month change in the PCE price index since 2011 against an average of our Richmond Fed price measure weighted by PCE consumption shares.
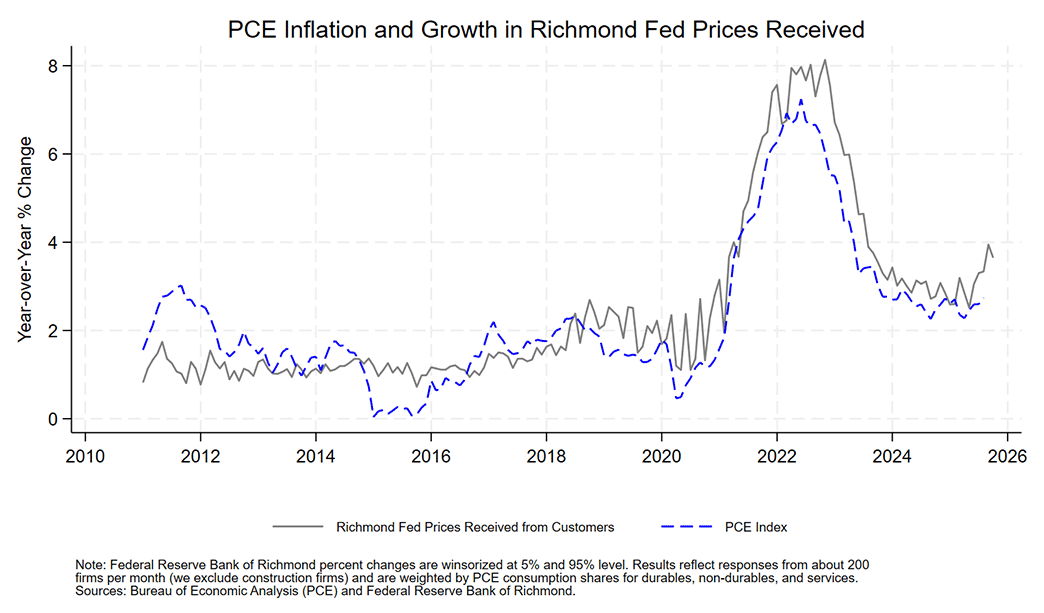
We can see two things from this chart. First, the Richmond Fed measure has historically tracked well with PCE inflation. Second, the Richmond Fed measure is more volatile in periods of extreme change (such as 2020) due to the small sample of businesses relative to the sample of businesses used in calculating PCE inflation. It is worth noting that the sectoral composition of the Fifth Federal Reserve District — which includes most of West Virginia and all of Maryland, North Carolina, South Carolina, Virginia, and Washington, D.C. — matches the United States quite well abstracting from the higher concentration of federal government.
The scatterplot in Figure 2 below and associated correlation coefficient of 0.92 suggest a very strong positive linear relationship between aggregate PCE inflation and our Richmond Fed measure of prices received.
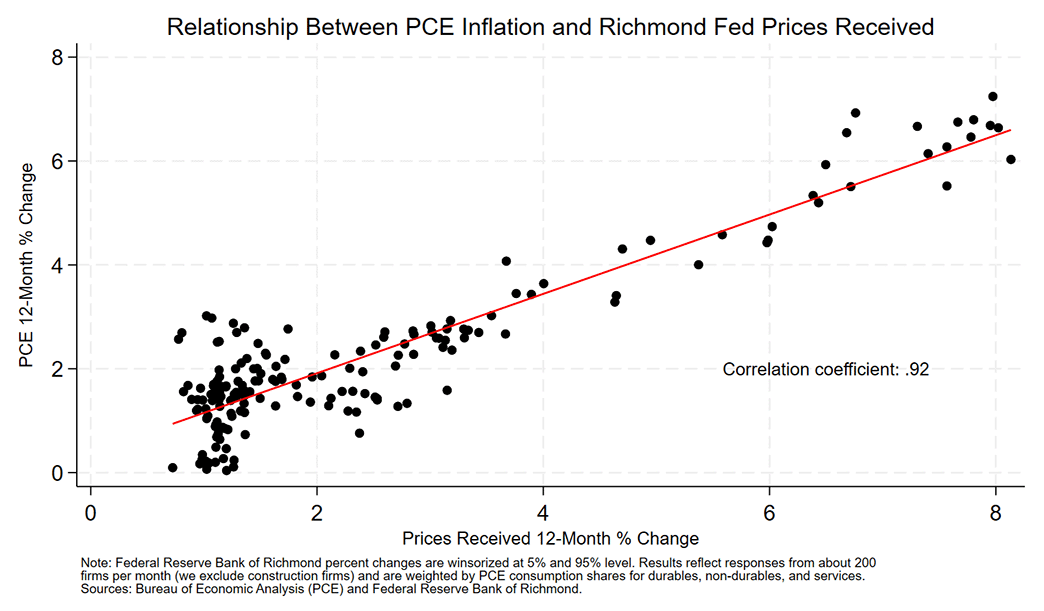
What does a positive correlation coefficient mean here? It means that when PCE inflation increases from its average, the Richmond Fed measure of prices received typically does as well. Similarly, when PCE inflation is lower than its overall average in any given month, the Richmond Fed measure typically is as well. This strong relationship enables us to use the Richmond Fed measure to add explanatory power to inflation forecasting models, which is useful since the Richmond Fed measure is consistently released a full month prior to PCE. For example, the Bureau of Economic Analysis released the July PCE price index on August 29, while the Richmond Fed released its July price measure on July 22.
Of course, alternative measures such as the Richmond Fed price index become even more important when the PCE index becomes unavailable. As of this writing, for example, the PCE price index is only available through August due to the government shutdown, while the Richmond Fed price measure is available through October.
Another way to think about the relationship between the Richmond Fed price measure and PCE inflation is to consider whether the two measures move in the same direction in any given month. We find that the monthly change in the Richmond Fed measure is on average more volatile: Since 2011, the mean (absolute value) of the monthly changes in the Richmond Fed price measure has been 0.3 compared to 0.19 for aggregate PCE. Nonetheless, the two measures move in the same direction well over half of the time in this 15-year period.
This varies over time. In periods of high inflation (such as 2021), the two measures move in the same direction a much higher share of the time, and the Richmond Fed measure is valuable in prediction. In 2020, with supply chain challenges and considerable business uncertainty, there was considerable heterogeneity in the costs and prices facing firms in different industries, and not all of those cost changes were passed through to consumers. In that year, the two measures moved in the same direction in only about half of the months. What is clear from Figure 1 is that although month-to-month movements may differ, it would be unprecedented to see a sustained decline in PCE inflation without seeing the same sustained decline in the Richmond Fed price measure.
The Richmond Fed measure of prices can provide explanatory power to a model of inflation. In September and October, the Richmond Fed price measure indicated an average year-over-year growth in prices received of 3.95 percent and 3.65 percent, respectively. Models that include those measures developed to date suggest that year-over-year changes in PCE inflation are not likely to take a step down in September or October. In a forthcoming Economic Brief, we will provide more details around how the Richmond Fed price measure can improve a standard inflation forecast.
Note: There will not be a Macro Minute post next Tuesday, Nov. 11, in observance of Veteran's Day. The series will resume the following Tuesday, Nov. 18.
Views expressed in this article are those of the author and not necessarily those of the Federal Reserve Bank of Richmond or the Federal Reserve System.
Contact Us