

Is There an Upward Trend in Productivity?
Key Takeaways
- Different productivity measures capture different structural forces, with utilization-adjusted TFP providing a clearer signal of underlying productivity.
- Trend productivity growth declined through the mid-2010s but has since increased across multiple measures.
- Recent data suggest continued growth in labor productivity, while TFP growth appears to be stabilizing.
Productivity is a key driver of macroeconomic growth. In fact, it is the only driver of per-capita growth in the long run.1 Understanding the sources and behavior of productivity growth is, therefore, an important area of economic research.
Economists have observed that the trend growth rate in productivity has declined over the last half-century, as has trend gross domestic product (GDP) growth. In other words, as the U.S. economy has become considerably larger and wealthier, productivity improvements have become more difficult to achieve.
The decline in trend productivity growth is associated with two periods: the 1970s and 1980s, and the 2000s and early 2010s. Ironically, the former is characterized by the widespread adoption of personal computing and the latter by the emerging ubiquity of the internet, both generally considered as productivity-enhancing technologies.
More recently, the behavior of productivity in the late 2010s has started to attract attention, as there seems to have been an uptick around the middle of the decade. Even more recently, the expanding use of artificial intelligence (AI) in the economy has generated speculation about its effect on productivity growth.
In this article, we estimate a statistical model of trend productivity growth and compare recent observed behavior to other research in the area. For instance, recent work by other Richmond Fed economists has studied these phenomena at the aggregate and sectoral levels with KLEMS data2 and found that productivity growth has indeed ticked up in recent years.3 We also examine alternative measures of aggregate productivity and compare their recent trends.
More specifically, we use the methodology developed by one of us (Thomas) and Christian Matthes for estimating the natural rate of interest4 and apply it to capturing trend productivity as measured three ways:
- Real output per hour
- Utilization-adjusted total factor productivity (TFP)
- Utilization-adjusted labor productivity
Estimation
We specify a time series model in the form of a vector autoregression (VAR), where we allow for stochastic volatility in the error terms and stochastic time variation in the lag coefficients of the model. Such a time-varying parameter VAR (or TVP-VAR) is a flexible model for capturing a wide range of nonlinear behavior such as structural breaks — for instance, a change in the trend growth rate of a variable — or excessive volatility in some variables, such as during financial crises or pandemics.
We compute trend productivity as the medium-term forecasts from the estimated TVP-VAR. This isolates the lower-frequency components of an economic variable while also allowing for some degree of variation. Effectively, this procedure captures the behavior of the series when temporary disturbances are extracted.
The TVP-VAR includes GDP, the interest rate and one of the three measures of productivity mentioned above, which we discuss in turn in the following. The data are at quarterly frequency and range from the first quarter of 1961 to the third quarter of 2025.
Real Output Per Hour (Labor Productivity)
The first productivity measure we consider — and perhaps the most familiar and widely used in economic discussions — is labor productivity. It is simply output divided by labor input, or more specifically in our case, business-sector output per hour worked. The time series for this measure over the last 20 years is shown in Figure 1. The raw productivity series shows two notable spikes, namely during the last two recessions: the financial crisis and the pandemic. Effectively, labor input falls by more than output, leading to an increase in measured productivity over the course of the downturns.
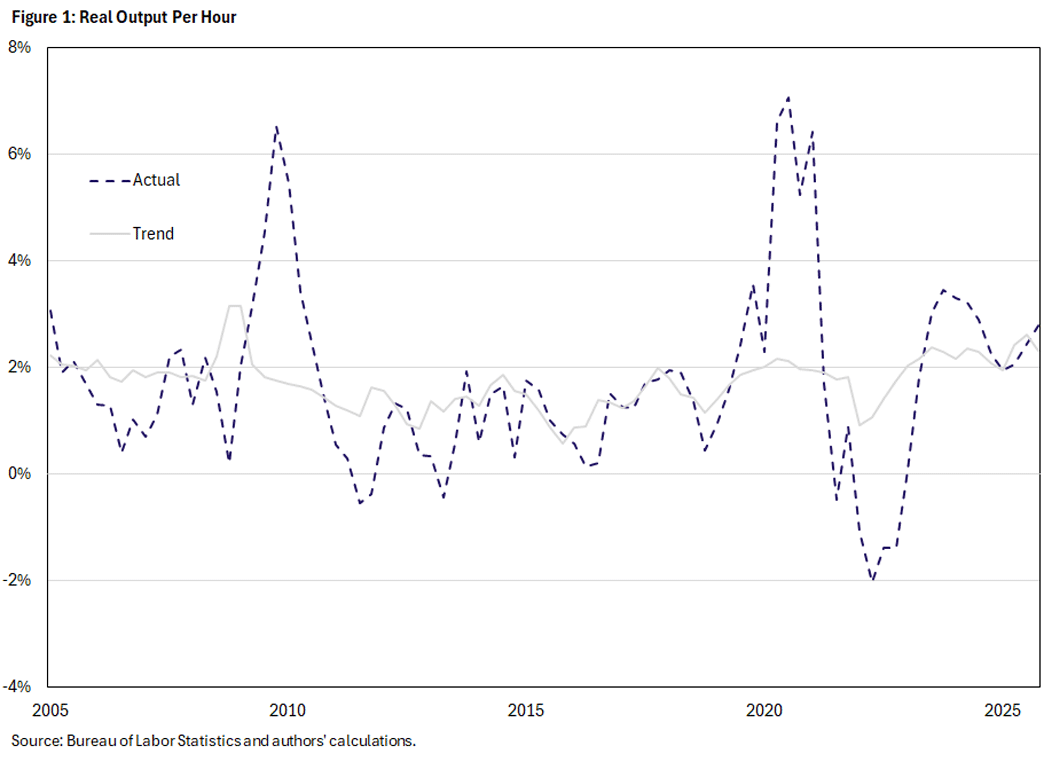
The estimated productivity trend is shown in the figure as the gray line. Over the full sample, trend output per hour averages 1.9 percent, lower than the raw series at 2.1 percent. They share similar medians — 1.9 percent and 2.0 percent, respectively — implying that the difference in the averages is largely due to upward spikes that are not incorporated into the long-run trajectory. This includes the episodes in 2010 and 2020 visible in Figure 1.
Turning to recent behavior, output per hour and its trend have identical averages since 2005 (both 1.7 percent), but the former has a lower median of 1.6 percent compared to 1.8 percent for the latter, consistent with the broader pattern. Also, the period from 2005 to 2015 shows falling trend productivity growth before reversing and showing positive growth from 2015 onward.
Our estimate of trend labor productivity thus supports the idea that there has been a pickup in productivity growth from the mid-2010s on, perhaps driven by implementation of technological advances or necessitated by the tightness of labor markets, which lead businesses to employ their current workers more efficiently.
However, the labor productivity measure does not separately identify contributions of capital deepening, labor composition or factor utilization. Instead, it reflects the combined influence of these structural sources and may therefore give a misleading picture of the underlying drivers.
Utilization-Adjusted Total Factor Productivity
We next consider TFP as constructed by economist John Fernald and maintained by the San Francisco Fed. In his seminal 2014 working paper "A Quarterly, Utilization-Adjusted Series on Total Factor Productivity," Fernald constructs a quarterly growth-accounting measure of TFP for the U.S. business sector that adjusts for variations in factor utilization — such as labor effort and the workweek of capital — and controls for heterogeneity in labor and capital inputs. Because firms tend to work their existing labor and capital harder in expansions while idling them in downturns, unadjusted TFP moves with the business cycle even when the underlying pace of technological change does not. Fernald's adjustment removes this variation in effort and utilization, producing a more informative high-frequency proxy for technological change.
TFP is the productivity measure preferred by economists since it presents a plausibly "exogenous" metric of productive efficiency and capacity. That is, it is stripped of all other influences that can be attributed to various factors of production. It thus presents a lower bound of the rate at which an economy can grow, holding everything else constant. As such, its average growth is lower than that of labor productivity.
The series and its associated estimated trend from our statistical model are shown in Figure 2.
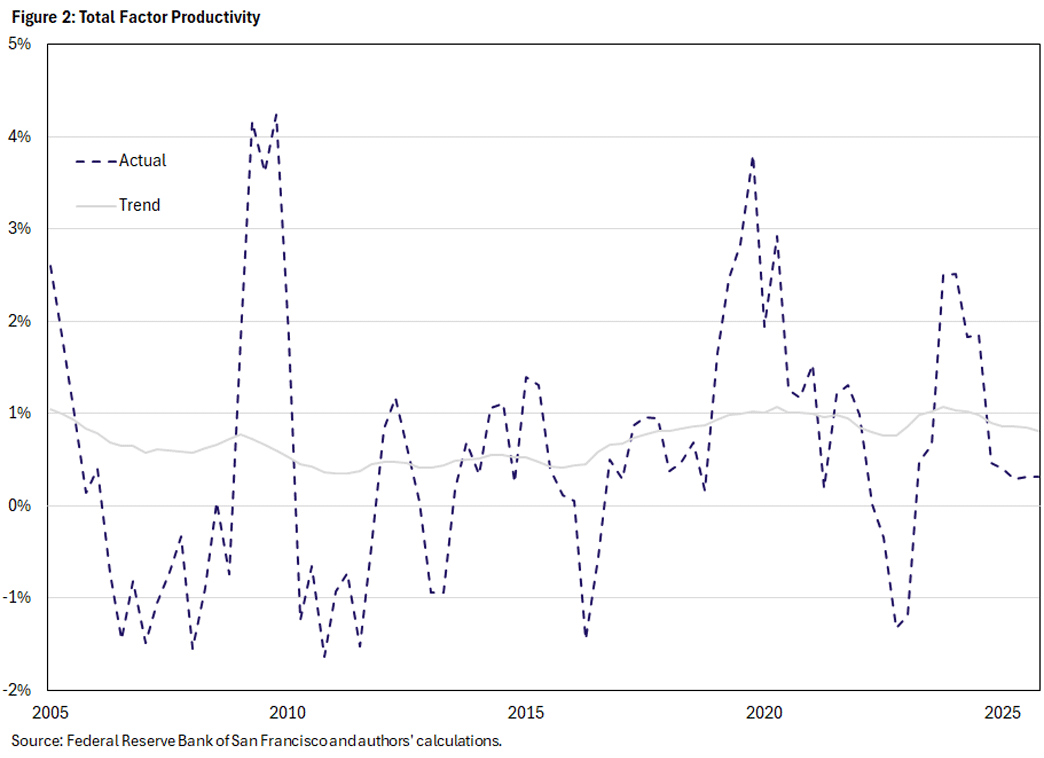
Over the full sample, Fernald's TFP exhibits similar averages and medians: Both measures for the raw series and trend are all about 1.0 percent. Since 2005, the TFP trend has stayed balanced with its average and median both at about 0.7 percent, but the raw series is lower and has an average of 0.6 percent and a median of 0.4 percent.
Looking at Figure 2, this behavior is evident in the periods of negative TFP growth. The resulting fluctuations produce a productivity trend that appears largely flat with a modest increase beginning around 2015. Unlike the clear upward drift in output per hour, the rising trend also begins to plateau around 2024.
Utilization-Adjusted Labor Productivity
One drawback of constructing TFP is that it requires specifying a production function. From this perspective, it is not a completely theory-free or agnostic measure of productivity in contrast with the simple calculation behind labor productivity discussed above. But it also is a preferred measure from an economic perspective since — by stripping out components that are not directly related to productivity such as a more intensive use of labor and capital — it provides a cleaner metric for exogenous productivity, the mysterious ingredient behind long-term growth.
More specifically, standard growth accounting implies a decomposition of labor productivity growth. In Fernald's accounting implementation, labor productivity growth is comprised of utilization-adjusted TFP growth, capital deepening and labor composition. Relative to the simple output-per-hour measure, this framework is useful because it distinguishes changes in underlying efficiency from changes in capital intensity and shifts in worker composition. We can thus also compute a slightly improved version of the standard labor productivity measure that adjusts for utilization. Figure 3 plots the utilization-adjusted labor-productivity series and its estimated trend.
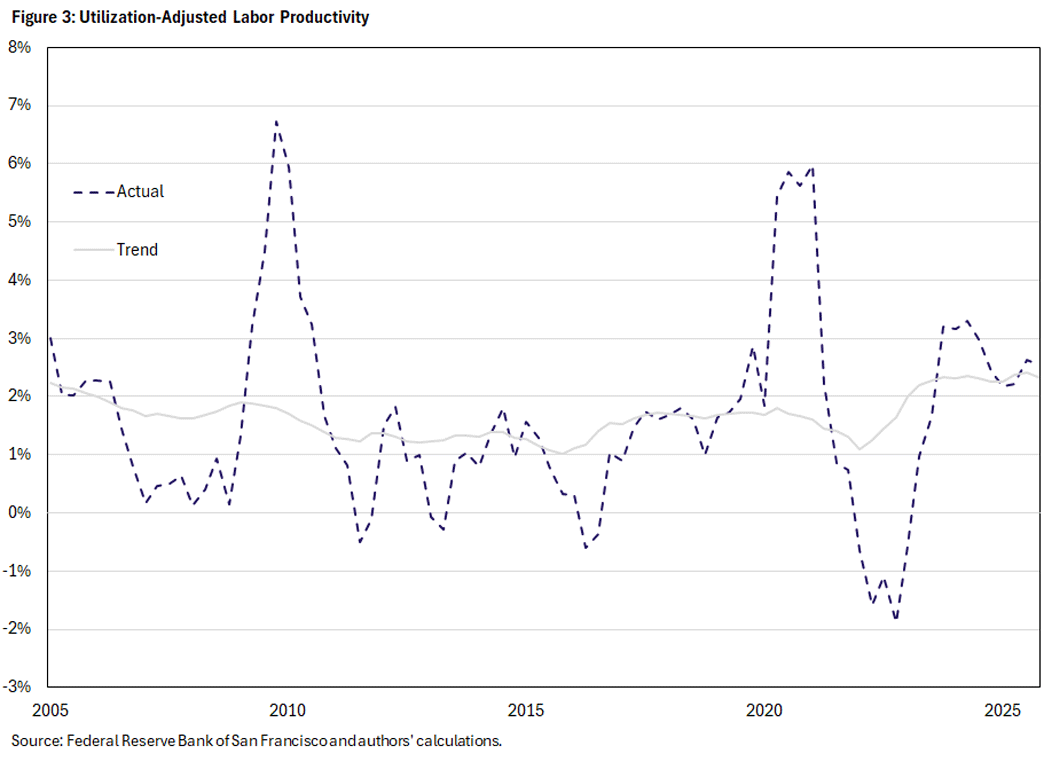
Like TFP, the adjusted labor productivity measure and its estimated trend have roughly the same centers over the full sample (about 2.0 percent) with post-2005 measures being slightly higher and less skewed for the corresponding trend: trend average and median at 1.7 percent, compared to an average of 1.6 percent and median of 1.5 percent for the raw series.
However, unlike TFP, there is a clear upward movement in recent trend growth. Consistent with the first measure of labor productivity, a discernable upward trend begins around 2015 after a period of decline but somewhat levels out after the pandemic.
KLEMS Total Factor Productivity
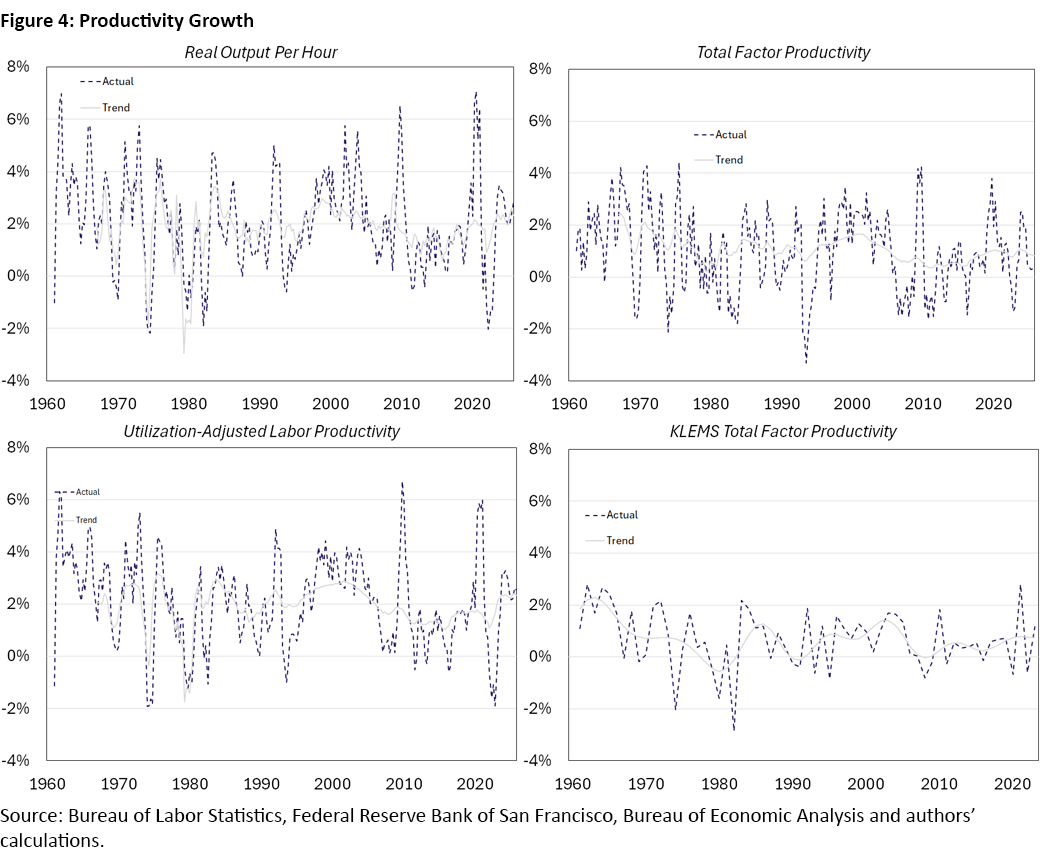
An alternative measure of TFP is based on annual industry-level KLEMS data. We now compare our previous estimates of trend productivity growth to trend KLEMS-constructed TFP growth, with the latter coming from recent work on sectoral and aggregate productivity growth by Richmond Fed economist Pierre-Daniel Sarte.5 Figure 4 displays all four productivity series with trend overlaid from 1961 to 2025, while summaries of all four trends are reported in Table 1.
| Full Sample | Q1:2005-Q3:2025 | |||||
|---|---|---|---|---|---|---|
| Average | Median | Standard Deviation | Average | Median | Standard Deviation | |
| Real Output per Hour | 1.86 | 1.92 | 0.95 | 1.72 | 1.77 | 0.48 |
| Fernald's TFP | 1.06 | 1.03 | 0.44 | 0.72 | 0.73 | 0.22 |
| Labor Productivity | 1.92 | 1.97 | 0.76 | 1.66 | 1.67 | 0.37 |
| KLEMS TFP* | 0.73 | 0.72 | 0.60 | 0.44 | 0.45 | 0.26 |
| *KLEMS data added for completeness. It covers 1947 to 2023 at an annual frequency. | ||||||
Even when working with sectoral data, the same accounting principles apply: By decomposing labor productivity, one can extract TFP, capital deepening and labor composition. And as aggregate productivity growth reflects productivity growth at the sectoral level, using industry-level data produces a more lucid picture of sectoral dynamics and the drivers of overall growth. Beyond measurement differences, the KLEMS trend estimate also comes from a different methodology, namely by extracting low-frequency components from Ulrich Müller and Mark Watson's 2008 article "Testing Models of Low-Frequency Variability."
Zooming Out: The Full Sample
Though our primary interest is in recent developments in productivity growth, identifying notable periods over the full sample serves as a useful validation for our trend estimates. Even before considering trends, there are clear similarities in behavior between the series. For one, the two measures of labor productivity (the top left and bottom left panels of Figure 4) clearly move together, though Fernald's utilization-adjusted labor productivity (the bottom left panel) shows less volatility, to some extent an artifact of stripping out factor use.
Consequently, trend utilization-adjusted labor productivity (the bottom right panel) is smoother than basic labor productivity (the top right panel), though they follow a similar pattern. Naturally, both measures of TFP growth appear similar. While the estimated TFP trends appear very different due to the different methodologies used, they generally agree on direction.
Through all four trends, we observe the three characteristic periods of productivity growth: the decline in the 1970s and 1980s, the steady rise in the 1990s and the noticeable decline in the 2000s.
Zooming In: Is There an Upward Trend in Trend Productivity?
Finally, we return to our main question: Has trend productivity been increasing? After several decades of declining trend productivity, there is growing evidence that this trend has reversed since the mid-2010s, ending the period of slow productivity growth that characterized the 2000s. To this end, we show our three trend productivity estimates in Figure 5 together with the KLEMS-constructed TFP trend.
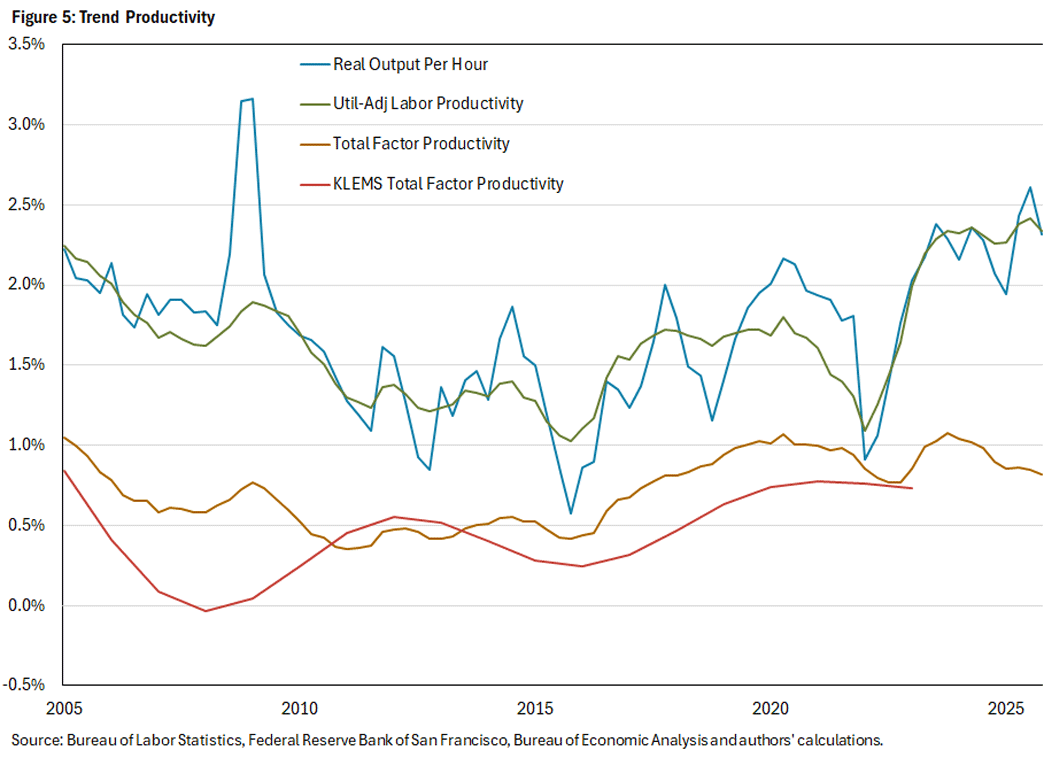
Across all four measures, we find an uptick in trend productivity growth, with each measure rising since 2015 after the slowdown of the 2000s. The most recent data are more mixed: The two TFP-based trends appear to level off in the 2020s, while the two labor-productivity trends continue to edge up through 2025. Whether this pickup persists — and how the growing adoption of AI in production ultimately registers in the data — remains an open question for future work.
Jacob Titcomb is a research associate, and Thomas Lubik is a senior advisor, both in the Research Department at the Federal Reserve Bank of Richmond.
In his 1988 paper "On the Mechanics of Economic Development," Nobel prize-winning economist Robert Lucas famously noted that, once one starts thinking about economic growth, "it is hard to think about anything else."
KLEMS stands for capital (K), labor (L), energy (E), materials (M) and services (S), which are inputs into the production process. These are industry-level data which can be aggregated into economy-wide productivity measures.
See Pierre-Daniel Sarte's 2024 article on the end of the second productivity puzzle and his 2025 article on sectoral productivity growth.
This methodology was originally developed for estimating the natural real rate of interest (commonly referred to as r*) and was recently updated. This methodology has also been applied to estimating r* in various countries and to estimating the natural level of inventory holdings.
See the previously cited articles "Sectoral Determinants of Aggregate Productivity Growth" and "The Productivity Puzzle: AI, Technology Adoption and the Workforce."
To cite this Economic Brief, please use the following format: Lubik, Thomas A.; and Titcomb, Jacob. (November 2026) "Is There an Upward Trend in Productivity?" Federal Reserve Bank of Richmond Economic Brief, No. 26-36.
This article may be photocopied or reprinted in its entirety. Please credit the authors, source, and the Federal Reserve Bank of Richmond and include the italicized statement below.
Views expressed in this article are those of the authors and not necessarily those of the Federal Reserve Bank of Richmond or the Federal Reserve System.


Receive a notification when Economic Brief is posted online.