What Is the Natural Level of Inventories?
Macro Minute
June 24, 2025
Inventories — the stock of goods ready for sale held by businesses — are a key component of aggregate investment in national income and product accounting. They often take center stage when new GDP data are released.
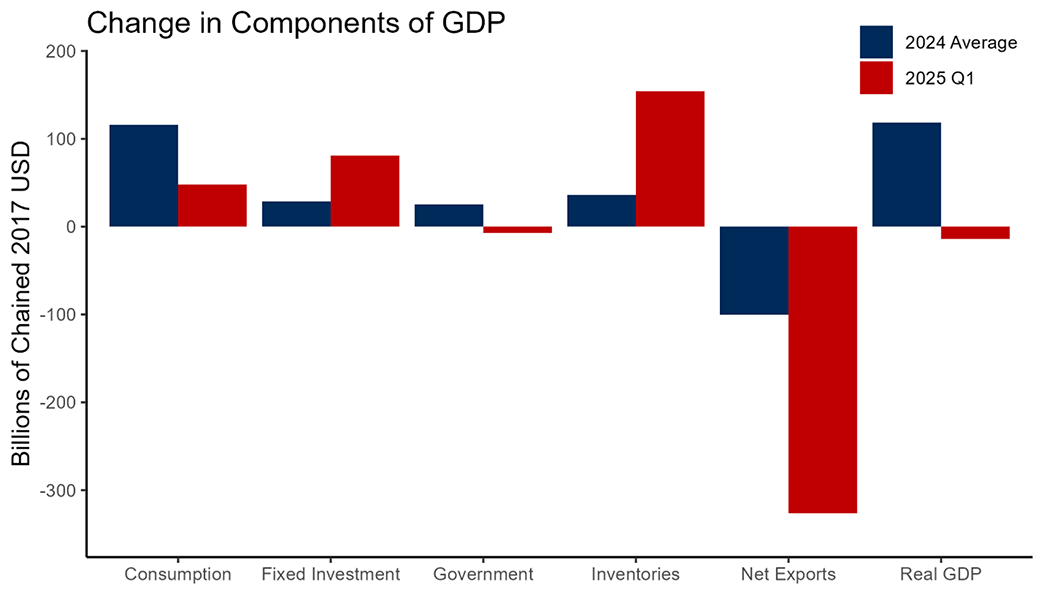
A prime example is the first quarter 2025 estimate of GDP from the Bureau of Economic Analysis. It showed a huge surge in imports, which coincided with a significant increase in inventory investment. Many news outlets reported that firms stocked up on inventories in anticipation of tariffs. Figure 1 below shows this unusual pattern relative to the average change in GDP components in 2024. The large decline in net exports is larger than the combined increase in fixed investment and inventories.
Inventory investment is a fickle component of GDP, since it reflects both current and expected conditions and interacts with both the supply and demand sides of the economy. In a sense, it is the ultimate residual in national income, as it also reflects unsold products. There are myriad reasons why firms may deplete inventories, including:
- Lower-than-expected production, whereby demand is satisfied from previously produced stock
- Higher-than-expected demand, when current production cannot be ramped up
- Expectation of lower demand in the future
- Anticipation of more efficient future technology
Disentangling these channels can be quite challenging for researchers, as it requires detailed information about current supply and demand conditions at the industry (or even establishment) level in addition to expectations about future conditions. Consequently, without such detailed observations, the information content of quarter-to-quarter movements in inventory investment is often low.
In this post, we attempt to provide some insight based on the natural (or normal) level of inventories. Specifically, we focus on the inventory-to-sales ratio. The ratio can be interpreted as the number of months of inventory on hand relative to that month's sales. We measure the end-of-month level of inventories to net sales of that month. We compute inventory-sales ratios (IS) for total business inventories and its subcomponents manufacturing, wholesalers and retail.
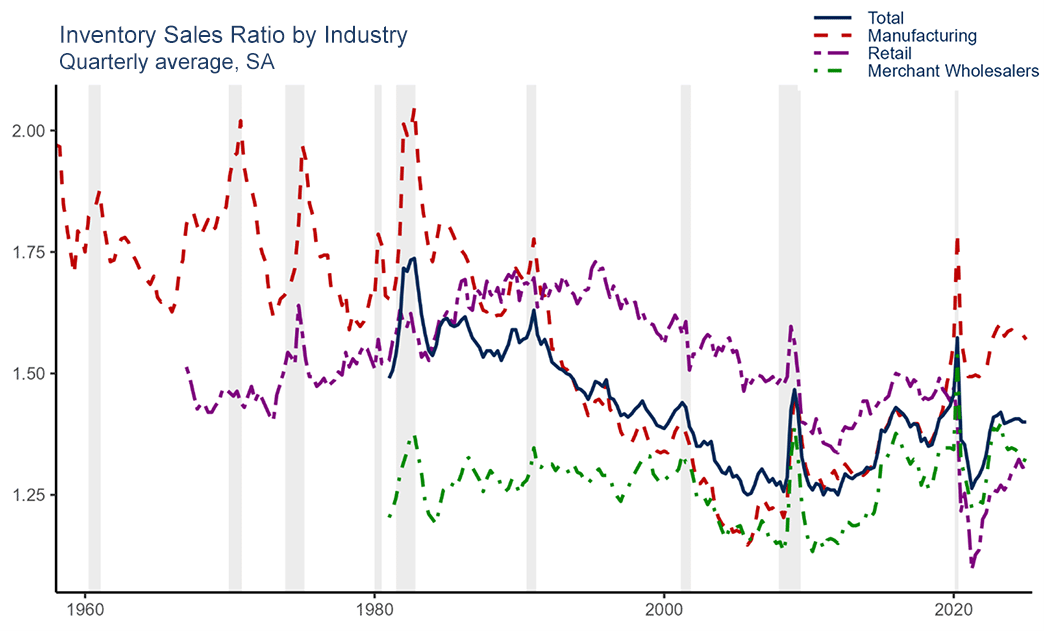
Figure 2 below shows that the IS largely decreased across manufacturing and retail firms from 1980 to 2010, then stabilized between 1.25 and 1.5 following the Great Recession. For merchant wholesalers, the IS has remained between 1.1 and 1.4 for the length of the series (excluding during the pandemic). Notably, all the series tend to increase sharply during recessions (denoted by the gray bars) largely on account of falling sales.
Given the patterns in the data, we tease out the natural level of inventories (IS*), which is the level of the respective IS that the economy would gravitate toward in the absence of shocks over the medium term. Using a statistical model similar to the one used to compute the natural real rate of interest, we calculate IS* for three broad sector groupings and the overall aggregate, as shown in Figure 2: the manufacturing, retail, and merchant wholesalers sectors, as well as total business. Figure 3 below shows the raw data, the estimated natural level, and the uncertainty region around the estimates.
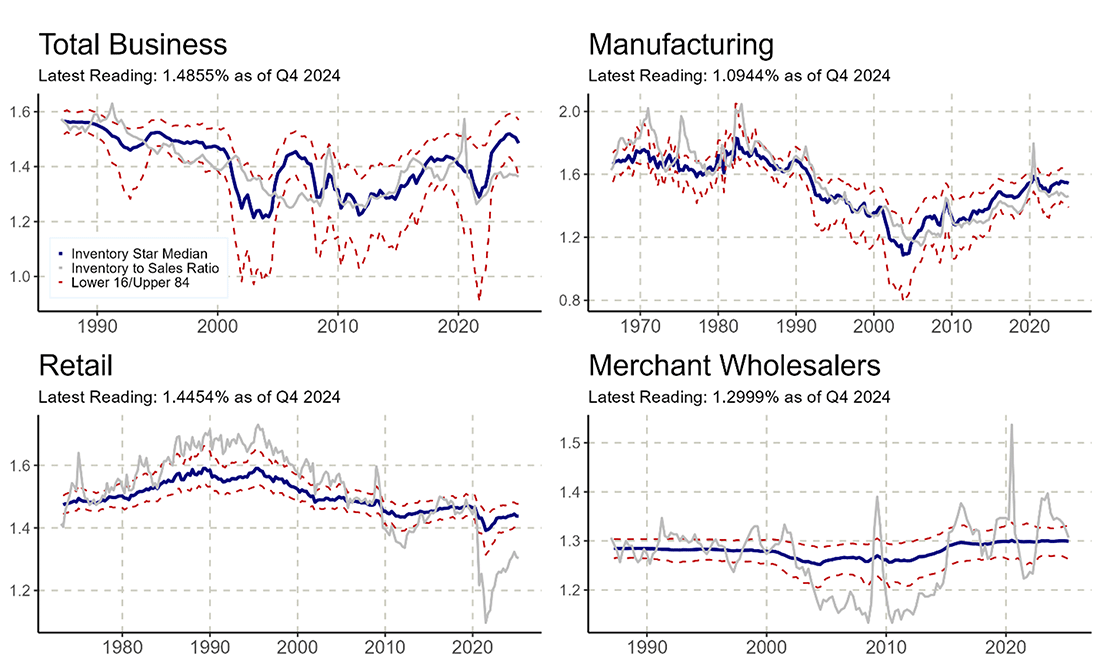
The top left panel shows IS* for total business. The series generally follows the ups and downs of the actual IS, with a marked decline in the 2000s and 2010s relative to the earlier decades and more recently. Currently, IS* stands at 1.6, considerably higher than actual IS at 1.4. This suggests that the rebuilding of inventories after the pandemic still has a ways to go, based on the historic patterns in the data.
Digging into the subcategories, the remaining panels show how IS* varies across the stages of the production process. IS* at manufacturing firms is the most volatile series, tending to follow the observed ratio closely over time. IS* at retail sales firms are somewhat smoother. Noticeably, IS* estimates in both sectors are above their current level, thus offering support to the idea of an ongoing inventory rebuilding process.
In contrast, we estimate for wholesalers — which are intermediaries between manufacturers and retailers — a fairly smooth IS*, hovering at or around 1.3 for nearly the entire sample, despite a visually volatile raw series.
One possible interpretation is that manufacturing firms may be much more vulnerable to supply shocks, such as trade frictions and (especially) new technologies. Retail firms, however, may be more insulated to this supply-side uncertainty and more responsive to consumer demand. In general, consumption growth is smoother than the other components to GDP, so IS* for retailers arguably varies less over time.
An alternative source of differences in the estimates of natural inventory levels are lower-frequency changes. For example, IS* declined as the revolution in inventory management and just-in-time production spread across the U.S. in the 1980s, which arguably affected production more than retail at the margins.
In this characterization of the production network, wholesalers act as a buffer for the other two parties. IS* spiked during the Great Recession and the pandemic (see the bottom right panel of Figure 3) as wholesalers were left holding intermediate goods that manufacturers had sold but retailers were unwilling to buy. The model, however, interprets these large jumps as atypical, rather than a fundamental change in the equilibrium behavior of these firms.
Estimating the natural level of inventories thus gives additional insight into the future direction of inventory investment, but it does not resolve the fundamental issue of what drives this component of business investment at any point in time. However, our results do support the notion that inventory rebuilding after the pandemic has legs.
At the same time, despite the surge in first quarter 2025 data, inventories do not seem particularly elevated today. This could indicate that there was considerable measurement error in the data. In addition (and perhaps surprisingly), there seem to be no major structural differences as indicated by the natural level estimates between pre- and post-COVID inventory management. Inventories continue to be somewhat of a mystery.
Views expressed in this article are those of the author and not necessarily those of the Federal Reserve Bank of Richmond or the Federal Reserve System.
Contact Us