The Jobs Numbers Don't Add Up?
Macro Minute
August 10, 2021
Last Friday, we received the employment situation report for July from the Bureau of Labor Statistics (BLS). By some measures, the labor market appears to be booming. Nonfarm payrolls grew by 943,000, following a gain of 938,000 in June. The number of employed people rose by 1 million in July, after falling 18,000 in June. July's unemployment rate dropped to 5.4 percent from 5.9 percent the prior month. Progress on labor force participation has been more tepid, however. Labor force participation rose to 61.7 percent, compared to 61.6 percent in June. Participation rates have been roughly flat since June of last year.
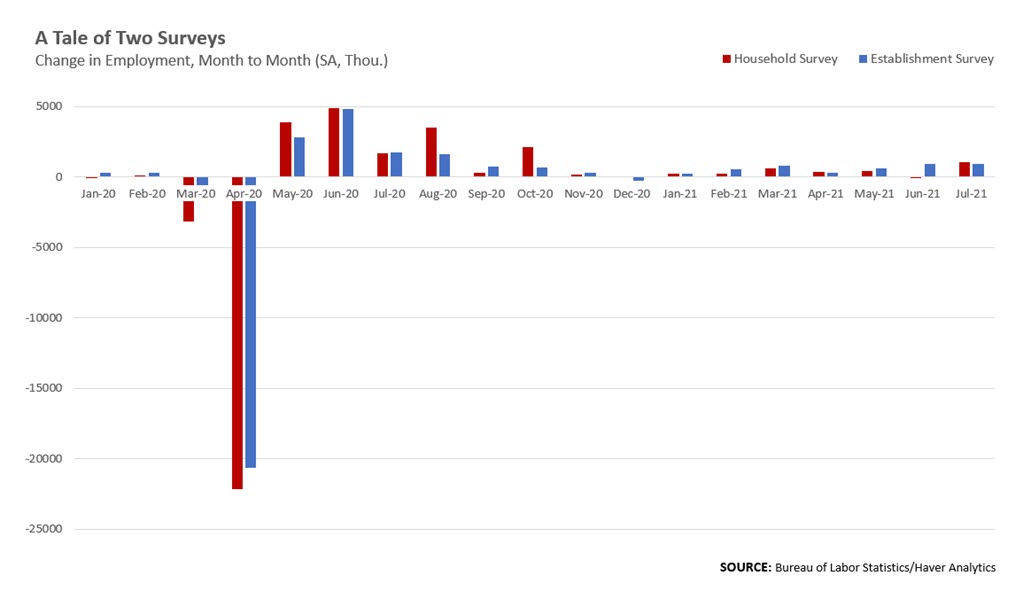
The employment situation report that's released at the beginning of every month is based on two different surveys: the Current Population Survey, which is also called the "household survey," and the Current Employment Statistics survey, also called the "payroll" or "establishment survey." It's possible for the two surveys to provide different pictures of the state of the labor market in a given month, as the household survey counts the number of employed people, while the payroll survey counts the number of jobs. The household survey samples about 60,000 households every month, asking questions about their labor force participation, employment status and demographic details. The payroll survey covers about 144,000 businesses and government agencies, gathering data on employment, hours and wages and salaries.
"With workers re-evaluating their participation decisions and switching jobs for better pay, more holistic measures give a better sense of labor market health than the unemployment rate or participation rate alone."
We saw a divergence in June's employment report, where payroll employment grew by 0.7 percent over the prior month but household employment actually declined slightly. The discrepancy partly reflects higher volatility in the household survey — according to the BLS, the household survey employment count is subject to much greater sampling error than the payroll survey because of a smaller sample size. But it could also reflect a decline in workers on unpaid leave. These workers are counted as employed in the household survey but not in the payroll survey, which only counts jobs that actually paid out a paycheck. So when these workers move from unpaid leave back to paid work, household employment stays the same and payroll employment increases. In June, the seasonally adjusted number of workers on unpaid leave declined by 351,000 from May.
Payroll employment could also have been lifted by workers moving from self-employment into payroll jobs: The number of self-employed workers in nonagricultural industries fell by 119,000 in June, following a 303,000 increase in May. This might be a good sign as payroll jobs generally have more benefits and higher compensation than self-employment. In a separate "adjusted" employment series that tries to account for these differences in counting, the BLS reported that household employment grew by 604,000 in June, closer to the 850,000 nonfarm payroll gain.
In July, we saw the two employment numbers match up a little better. And over longer stretches of time, the two measures of employment track each other reasonably well. Still, the fact that these two main employment surveys can present differing views of the health of the labor market in any given month adds to the challenges of determining how far the economy is from maximum employment.
With workers re-evaluating their participation decisions and switching jobs for better pay, more holistic measures give a better sense of labor market health than the unemployment rate or participation rate alone. One candidate is the Non-Employment Index produced by the Richmond Fed. As of June, it is 0.9 percentage points from its pre-pandemic level and has been improving by an average of 20 basis points per month in 2021. If that continues, we would return to the pre-pandemic benchmark by the end of the year.
Views expressed in this article are those of the author and not necessarily those of the Federal Reserve Bank of Richmond or the Federal Reserve System.
Contact Us