For Want of a Nail
Macro Minute
November 16, 2021
The world continues to wait for supply bottlenecks to fade. For signs of progress, it's useful to look at inventory-to-sales (I/S) ratios. These have been on a downward trajectory for much of the COVID-19 pandemic, as sellers have been forced to run down inventories, while deliveries and production have been hamstrung by supply side constraints. (The notable exception is at the very beginning of the pandemic, when lockdowns caused sales to plummet and drove I/S ratios to spike to abnormally high levels.)
"One surprise from the data is that the I/S ratio for manufacturers [has] barely changed from [where it was] before the pandemic and [is] higher than its 2019 average ..."
According to the latest data, the total business I/S ratio was 1.26 in September, compared to 1.42 before the pandemic. For retailers, the I/S ratio was 1.10 versus 1.43 pre-pandemic. For merchant wholesalers, the ratio was 1.23 versus 1.32 pre-pandemic. (See Figure 1 below.)
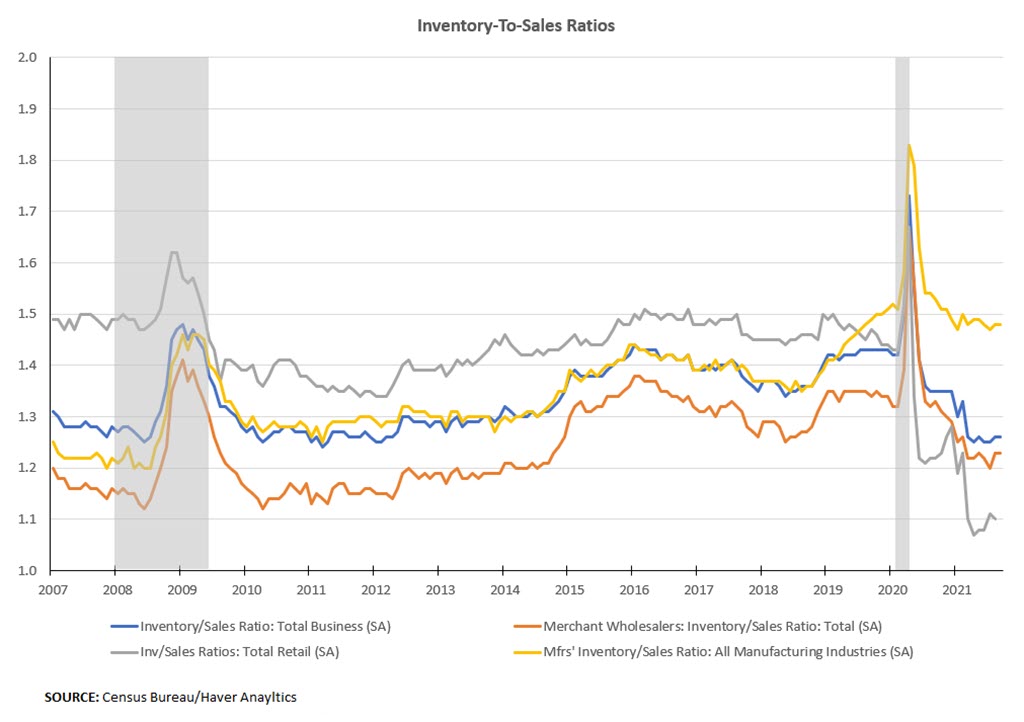
One surprise from the data is that the I/S ratio for manufacturers was 1.48 in September, barely changed from 1.51 just before the pandemic and higher than its 2019 average of 1.46. This measure does not show the same decline as the wholesale and retail I/S ratios because the I/S ratio for manufacturers takes stock of goods at all stages of production, from materials and supplies (e.g., steel and glass panels, or semiconductors), to work in process (e.g., partially built pickup trucks missing a certain microchip), to finished goods (e.g., fully built pickups). In contrast, inventories for wholesalers and retailers generally consist of finished goods ready for sale.
Amid today's conditions, where we've seen shortages of a single component result in weeks-long factory shutdowns, the better indicator of supply constraints in the manufacturing sector may not be the total manufacturing I/S ratio. Rather, it may be the manufacturing I/S ratio for finished goods. Figure 2 shows the total manufacturing I/S ratio (indexed to 2019) compared with the indexed ratios (with total sales on the denominator) for finished goods, work in process, and materials and supplies inventories.
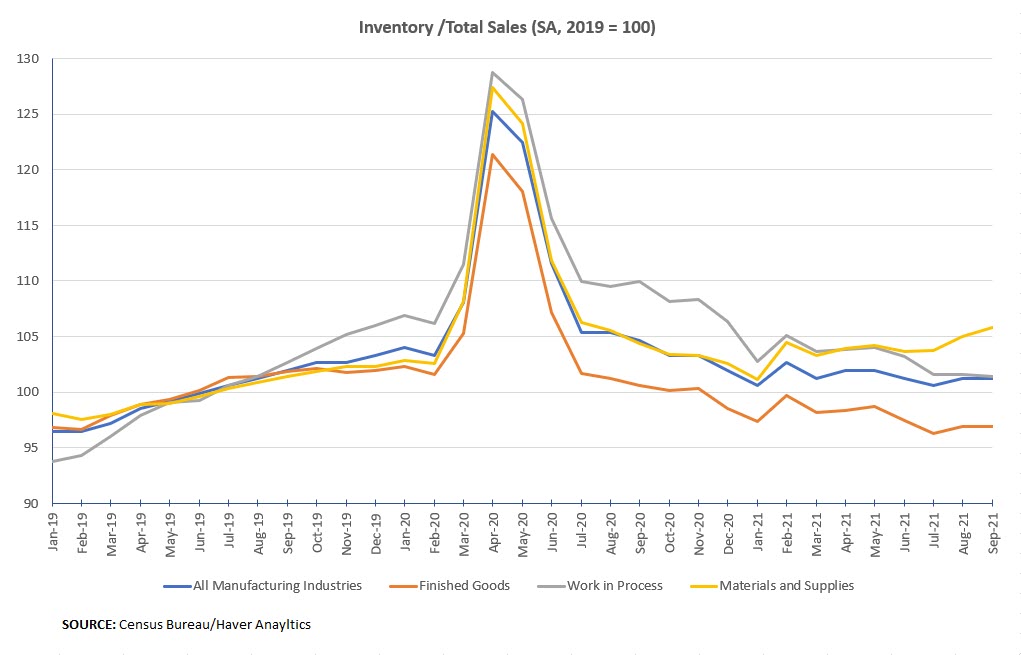
Looking across stages of production reveals how the manufacturing I/S ratio has been supported by growing inventories of materials and supplies, which have offset declines in work in process and finished goods inventories, relative to total sales. The manufacturing I/S ratio for finished goods declined to 0.52 in September, flat from August, and below the 0.55 ratio observed just before the pandemic. Manufacturers' finished goods inventories are still tight, with nary a sign of relief in the short term.
Please Note: Macro Minute will be taking a break next week. Happy Thanksgiving!
Views expressed in this article are those of the author and not necessarily those of the Federal Reserve Bank of Richmond or the Federal Reserve System.
Contact Us