Spending Spree? No Guarantee
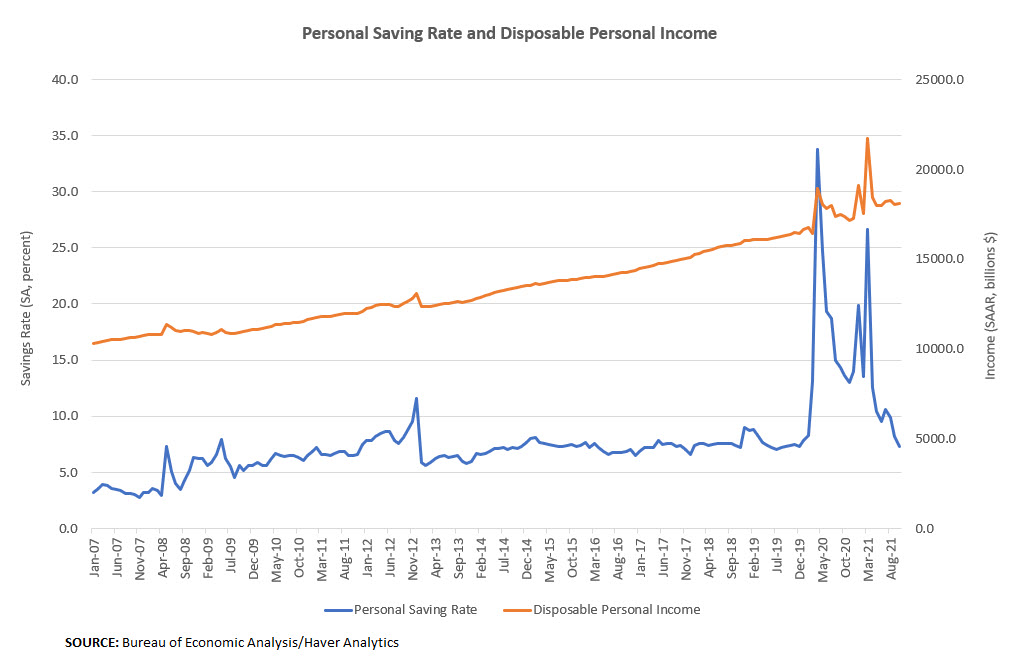
For the past year and a half, Americans have been living relatively frugally, spending less of their disposable personal income and driving the personal saving rate to historical highs. The spikes in the saving rate imply that much of the fiscal support directed toward households during the pandemic has been saved.
"Will the nation's overstuffed piggybank finance a spending boom eventually?"
Figure 1 below shows how the personal saving rate reached 33.8 percent in April 2020, the highest level in monthly data that stretch back to January 1959.
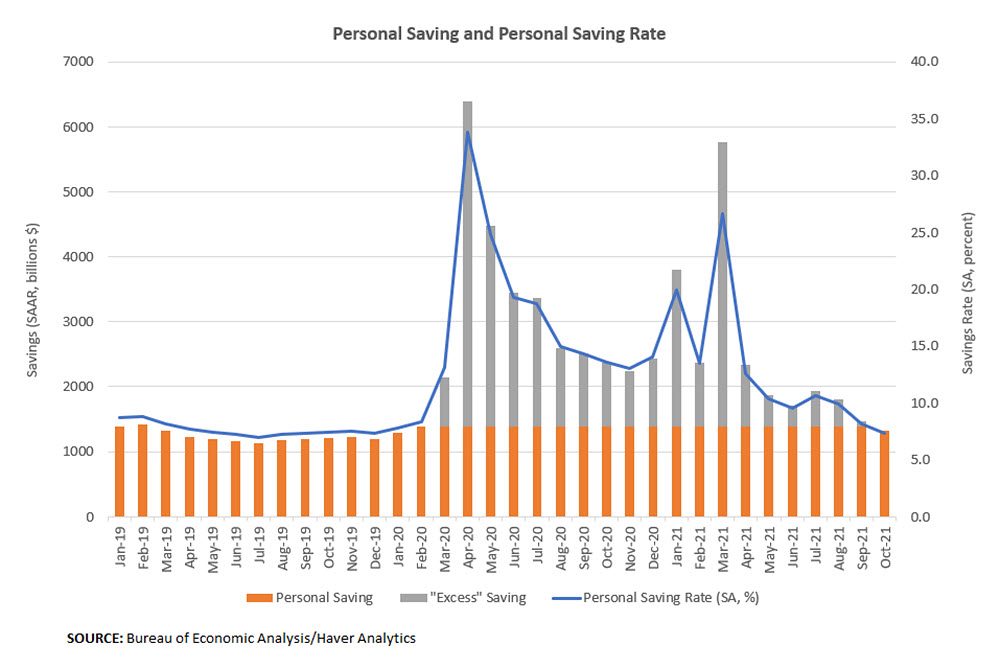
However, according to the most recent monthly report from the Bureau of Economic Analysis on personal income and outlays, the personal saving rate fell to 7.3 percent in October 2021 versus 8.2 percent the prior month, finally returning to a more typical, pre-pandemic level after 18 months of elevated readings. The level of saving also returned to pre-pandemic norms. Households saved an annualized $1.3 trillion in October, similar to the January-February 2020 average.
Figure 2 shows "excess saving," here defined as the level of savings over that recorded in February 2020. The normalization of saving in September brings the total stock of excess savings to $2.3 trillion. Will the nation's overstuffed piggybank finance a spending boom eventually? With today's news about high inflation and strong sales expectations going into the holiday season, it might seem like we're already seeing excess savings being unleashed into the economy.
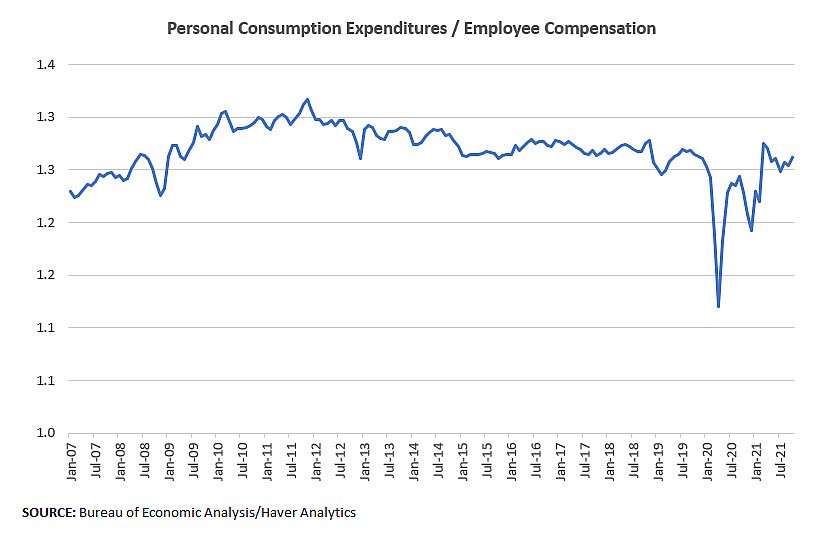
But surprisingly, personal consumption expenditures relative to employees' compensation — i.e., income that comes from wages, salaries and employer contributions to benefits — has remained basically flat compared to pre-pandemic levels. As of October, the ratio of personal consumption expenditures to compensation of employees was 1.26, roughly equal to its five-year pre-pandemic average of 1.28. Figure 3 shows that spending relative to compensation dropped during the pandemic as lockdowns limited households' ability to spend. But as these lockdowns were lifted, we didn't see a burst of pent-up demand drive spending higher relative to compensation.
This stable ratio highlights that the role of pandemic savings on spending remains an open question. On one hand, perhaps compensation income is all that matters for spending, and fears that inflation will be exacerbated by pent-up demand and savings are overblown. On the other hand, the pandemic continues to cast a shadow on consumption, as evidenced by some activities, such as travel, still below pre-pandemic levels. If the pent-up demand story proves to be true, one signal to look for in the data would be an increase in the spending-to-compensation ratio over and above its pre-pandemic range.
Views expressed in this article are those of the author and not necessarily those of the Federal Reserve Bank of Richmond or the Federal Reserve System.


