Small Business Job Openings
Macro Minute
April 11, 2023
Smaller businesses' demand for workers has made up a considerable part of the surge in job openings observed over the past two years. But some data suggest that surge is beginning to wane.
Officially, the U.S. Small Business Administration classifies businesses as "small" depending on which industry they operate in, coupled with criteria regarding revenue or headcount. For simplicity, in this post we'll consider businesses to be "small" if they employ fewer than 250 people, which is similar to the definition of "small and medium-sized enterprise" used by the Organization for Economic Cooperation and Development.
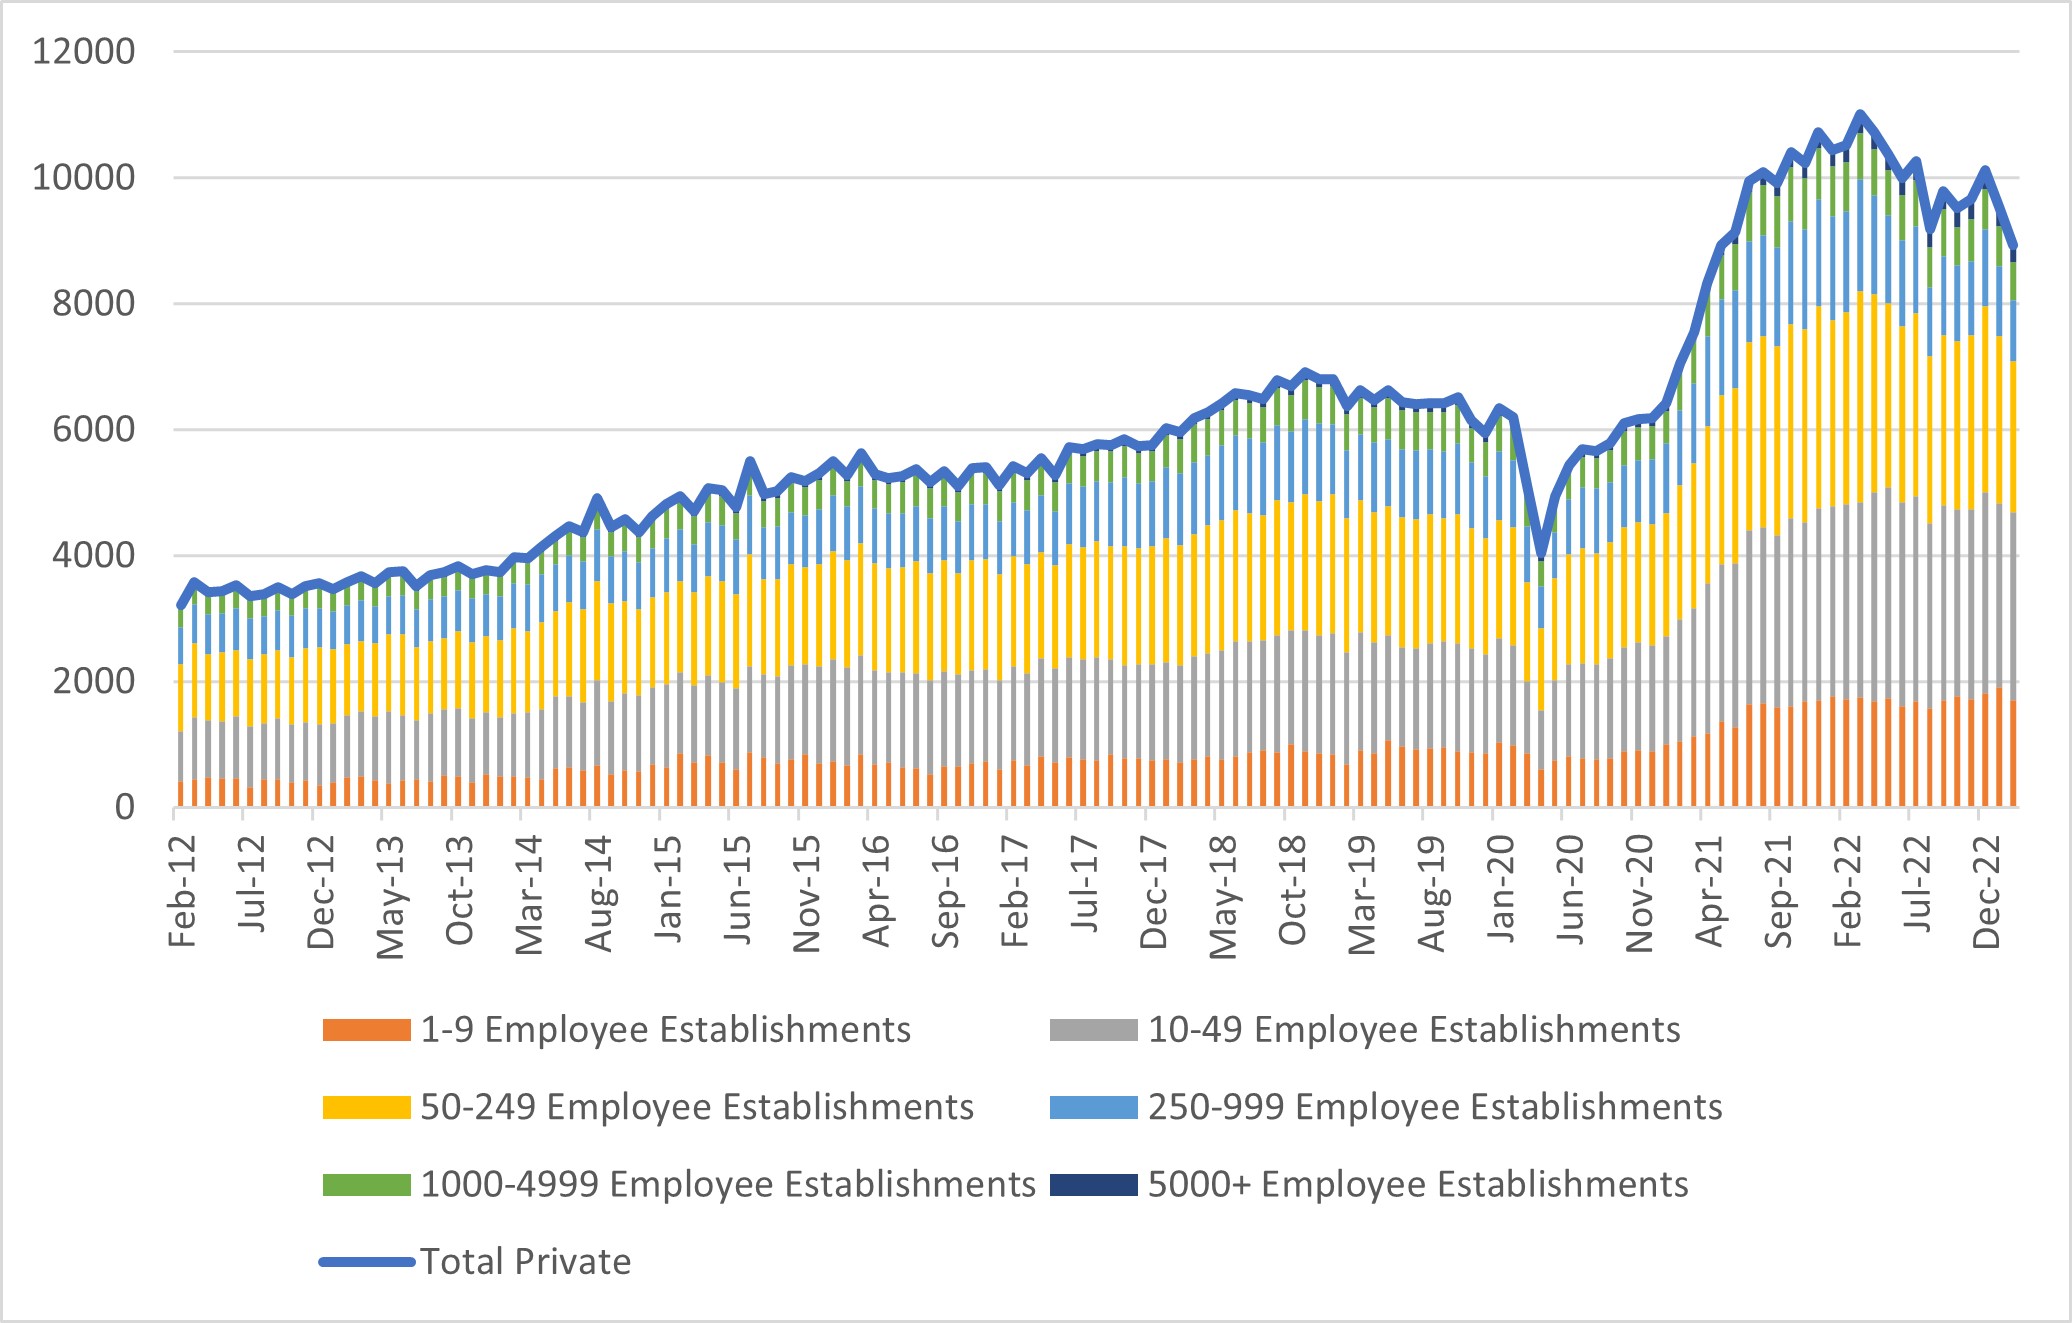
Job openings by small businesses rose 59 percent from February 2020 to February 2023. In contrast, job openings by large businesses rose 6 percent over the same period. Small businesses have also seen a sharper increase in their job openings rate over the pandemic: from 4.5 percent in February 2020 to 6.4 percent in February 2023. This 1.9 percentage point increase contrasts with the 1.4 percentage point increase (4.8 percent to 6.2 percent) that large businesses experienced over the same period. Furthermore, small businesses now make up 79 percent of total private sector job openings, up from 72 percent in February 2020. (See Figure 1 below.)
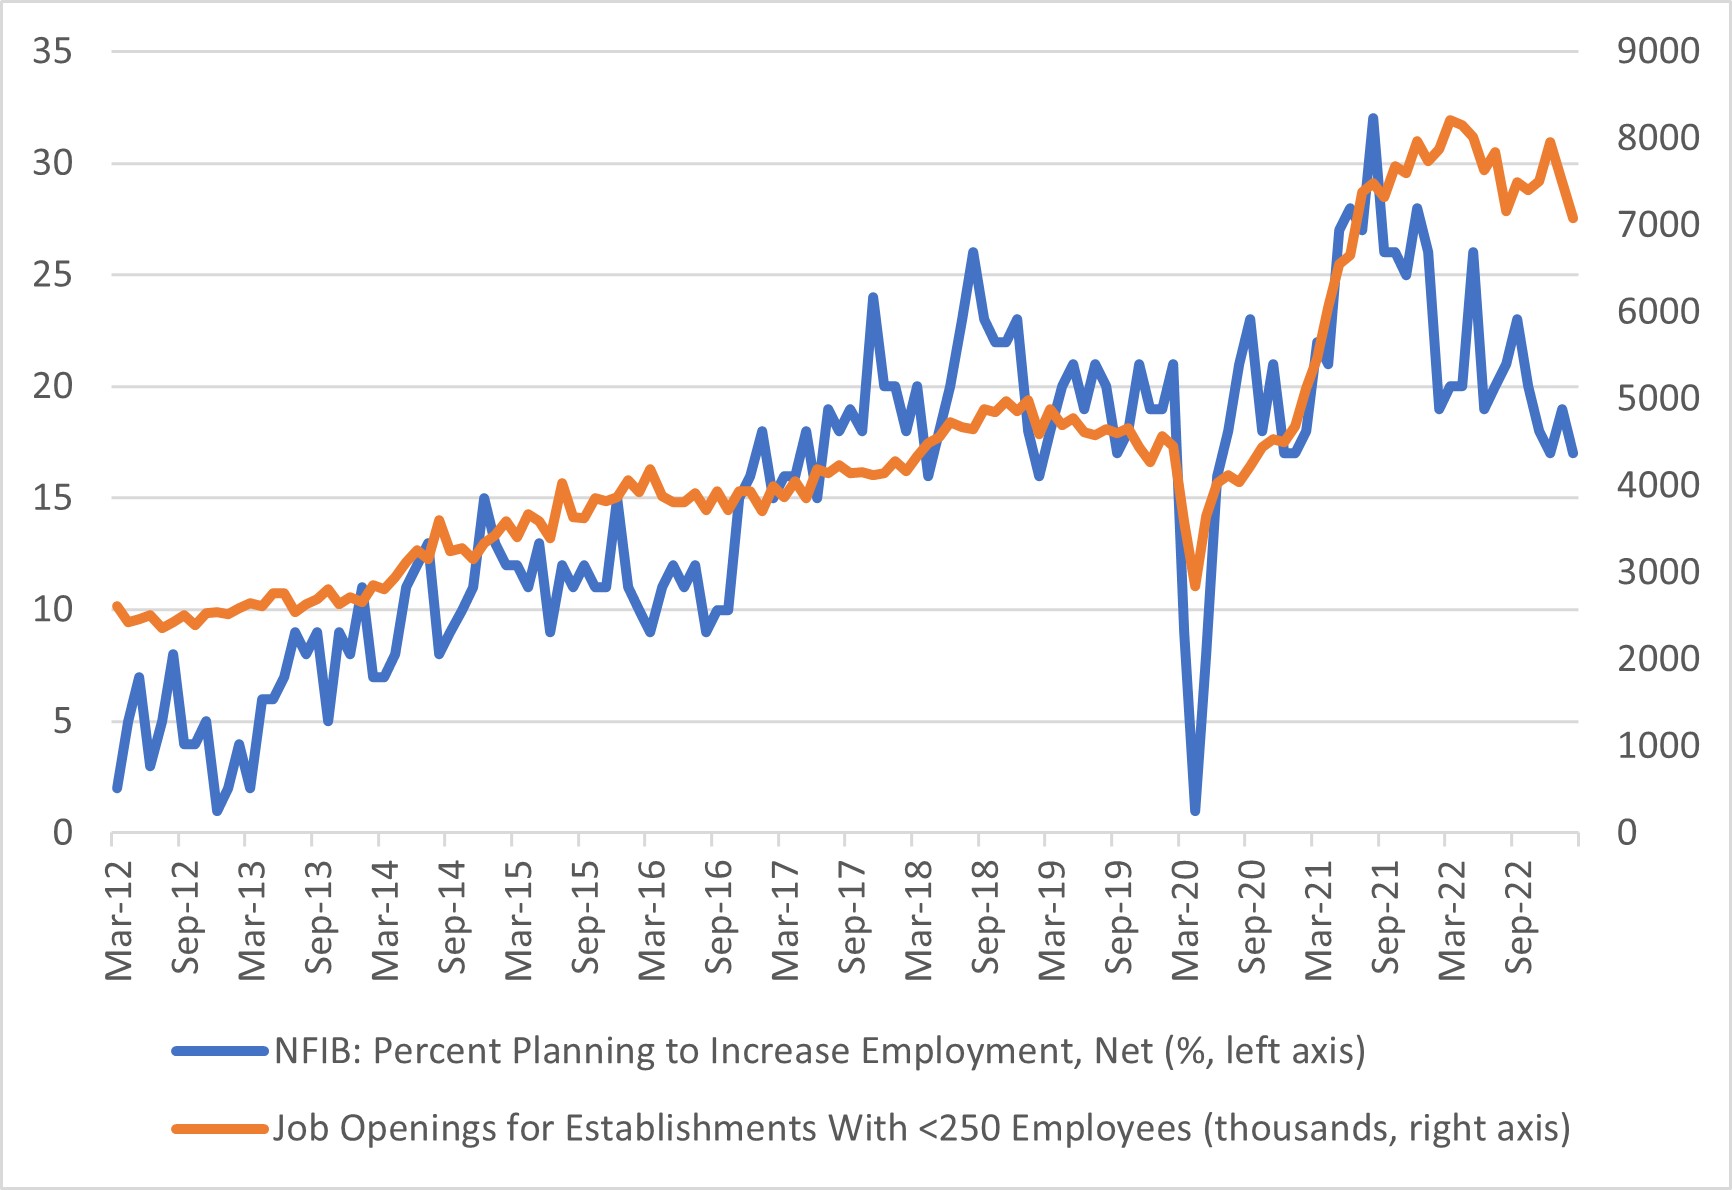
But small-business job openings may soon start to decline. According to the National Federation of Independent Business (NFIB) Small Business Economic Trends survey (PDF) from February, the net percentage of small businesses planning to increase employment has fallen to 17 percent in February 2023 from a record high of 32 percent in August 2021. Because the official Bureau of Labor Statistics job openings measure is meant to capture positions for which employers are actively recruiting, the decline in the number of businesses planning to increase employment should result in further declines in job openings among smaller establishments. This might help restore the relationship between small businesses' hiring plans and job openings, two series that have generally moved together until the spring of 2021. (See Figure 2 below.)
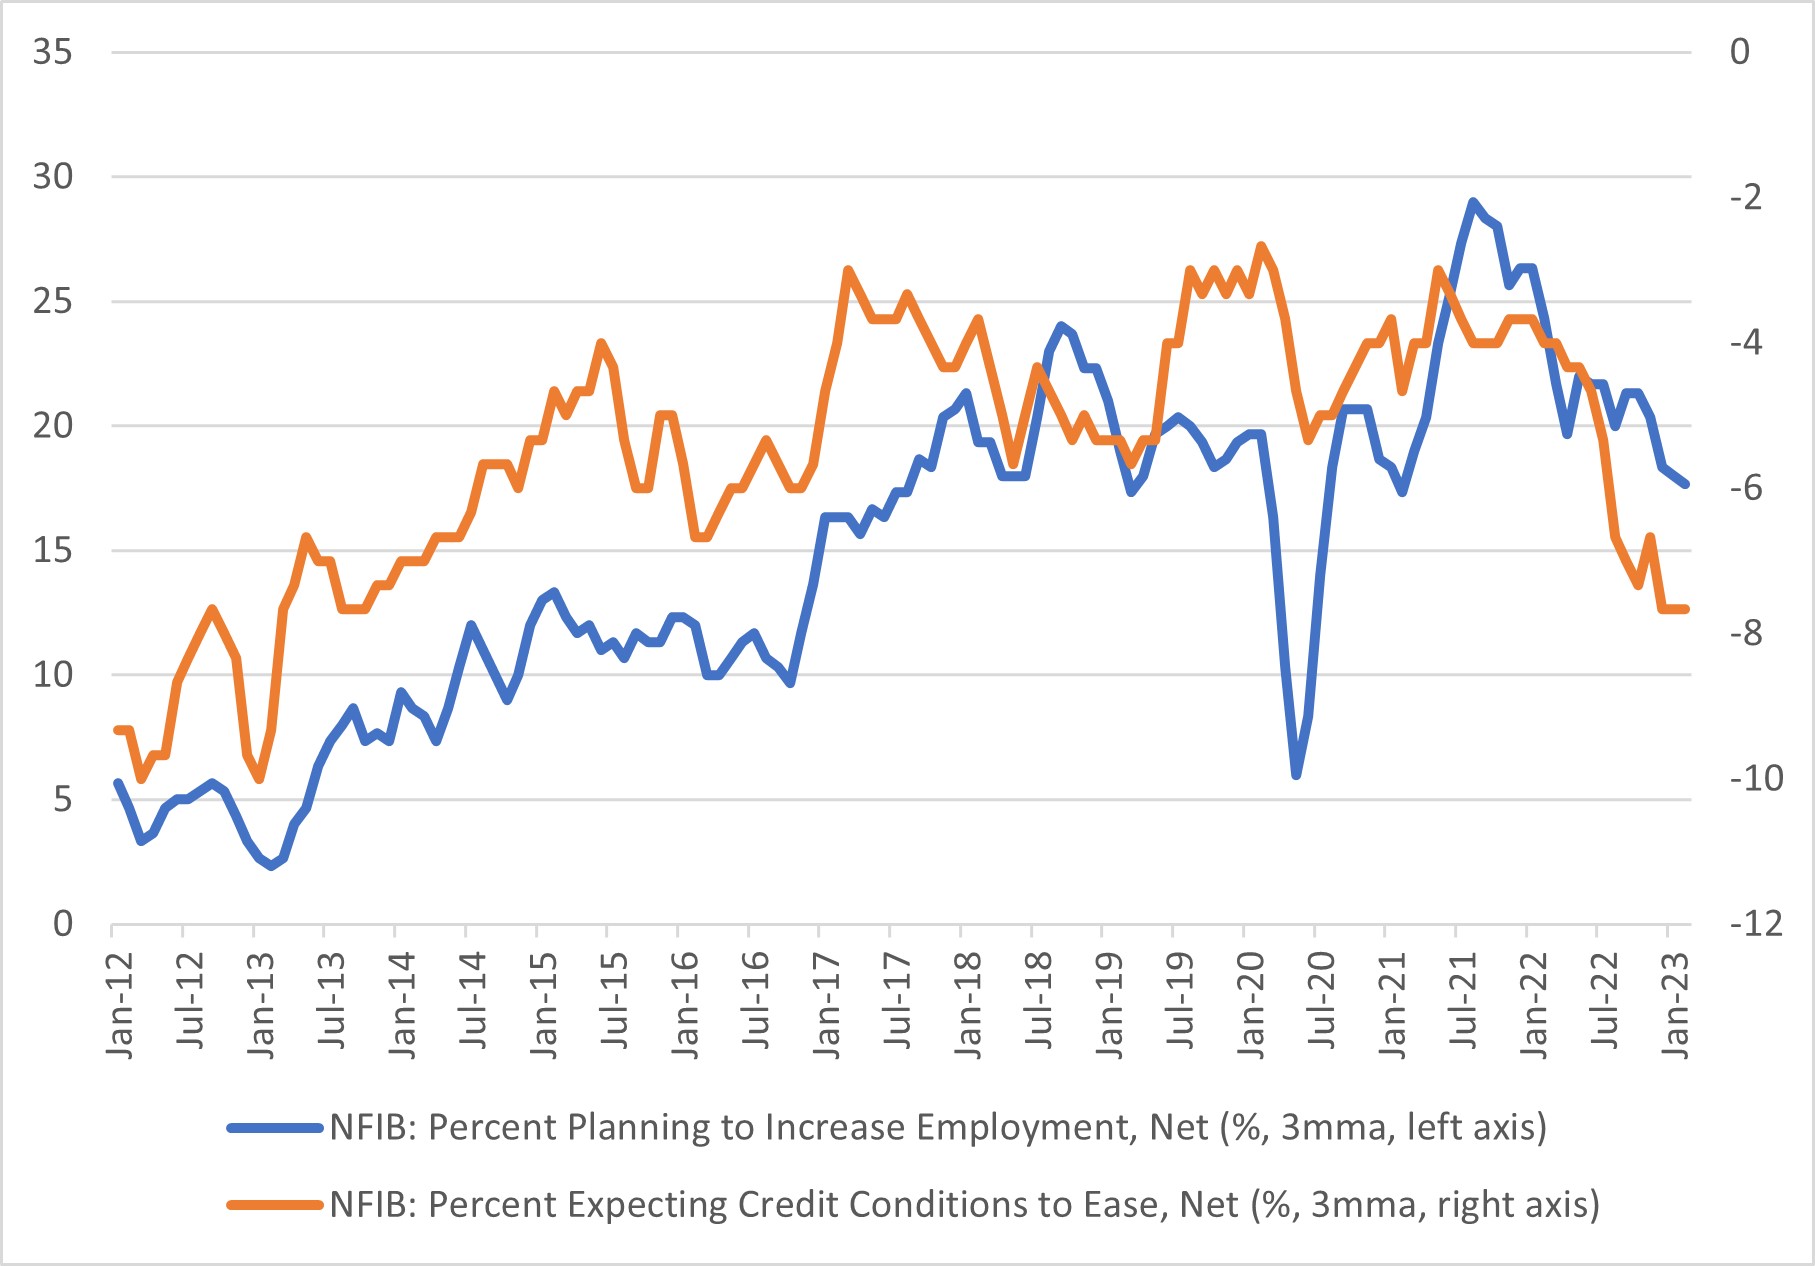
Tightening credit may be one factor cooling firms' demand for workers. In February, the share of firms expecting credit conditions to tighten was 6 percent higher than the share expecting credit conditions to ease. (See Figure 3 below.) The decline in the NFIB expected credit conditions index began in 2022 with the Fed's initial rate hikes. However, recent stress among small and regional banks may accelerate credit tightening and further weigh on small businesses' demand for workers.
Views expressed in this article are those of the author and not necessarily those of the Federal Reserve Bank of Richmond or the Federal Reserve System.
Contact Us