How Broad Are Elevated Price Increases?
Macro Minute
May 14, 2024
The latest inflation readings have been disappointing. In March, the personal consumption expenditures (PCE) price index rose at a 3.9 percent annualized pace, taking year-over-year inflation to 2.7 percent compared to 2.5 percent in February. Core PCE prices (which exclude food and energy) also rose at a 3.9 percent annualized pace, keeping year-over-year core inflation at 2.8 percent in March.
Is elevated price growth being experienced across many categories, or is inflation mostly driven by a few categories where pricing pressures remain stubborn? To answer this question, I divide the full PCE basket into 180 categories of goods and services. In each spending category, I look at the change in prices over the past three, six and 12 months. To see whether elevated price growth is broad relative to pre-pandemic norms, I add up the spending shares of categories experiencing price growth over 3 percent annualized and compare these shares to what we observed before the pandemic.
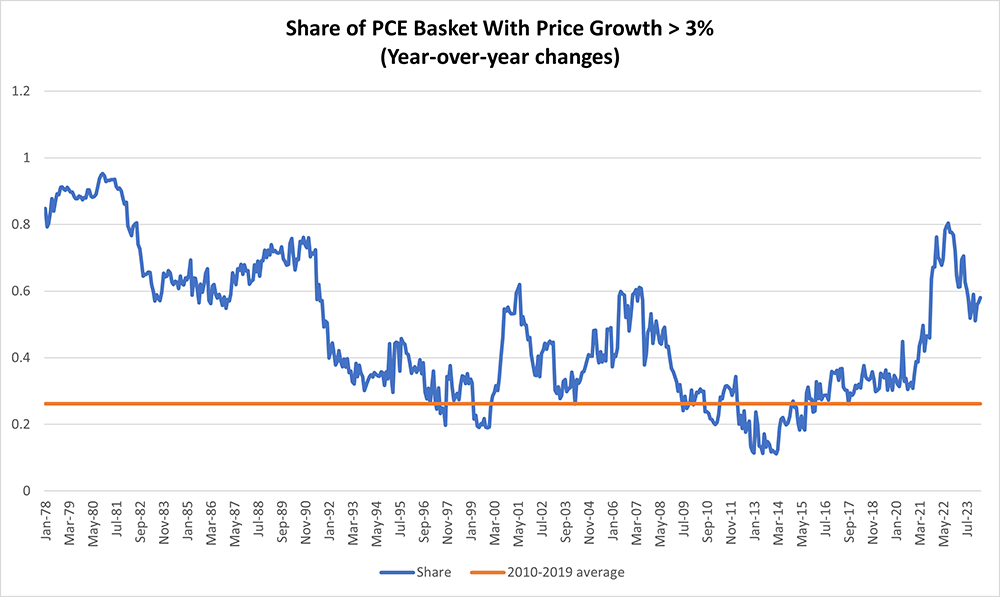
Figure 1 below shows the share of PCE expenditures with year-over-year price increases greater than 3 percent. After the pandemic, this share reached a peak of 80.5 percent in August 2022, which was the highest since July 1982 and well above the 26.2 percent average observed in the decade before the pandemic. While the share has declined since that peak, it was 58.1 percent in March 2024, still more than double the 2010 through 2019 average.
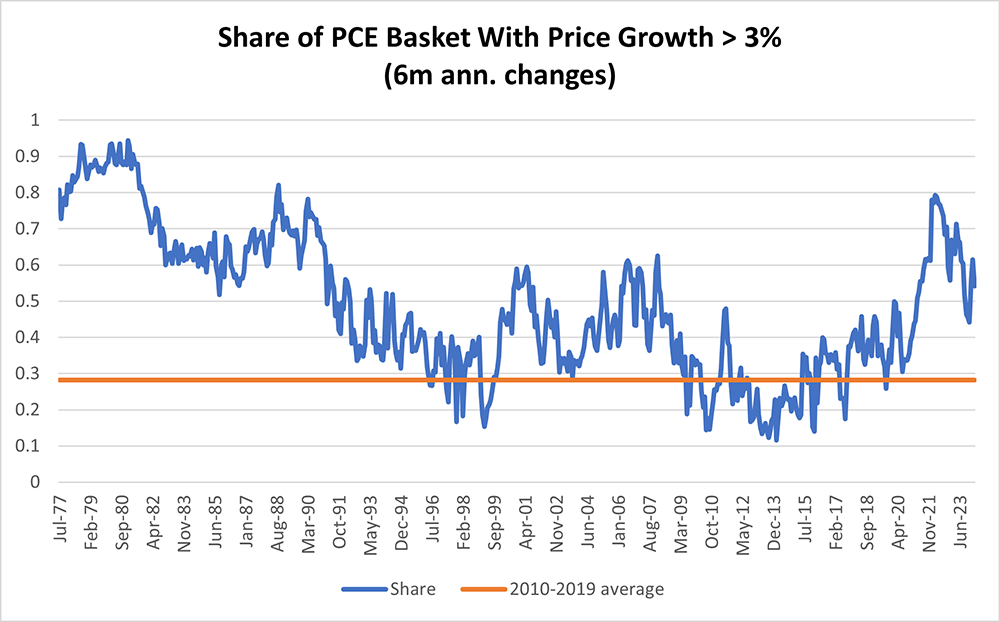
Does price growth appear to be ebbing if we focus on more recent price changes? In Figure 2 below, I show the share of expenditures where six-month price increases are greater than 3 percent annualized. Similar to the previous figure, Figure 2 shows that this share remains above levels observed before the pandemic. In March, that share was 54.2 percent, compared to an average of 28.2 percent in the 10 years before the pandemic.
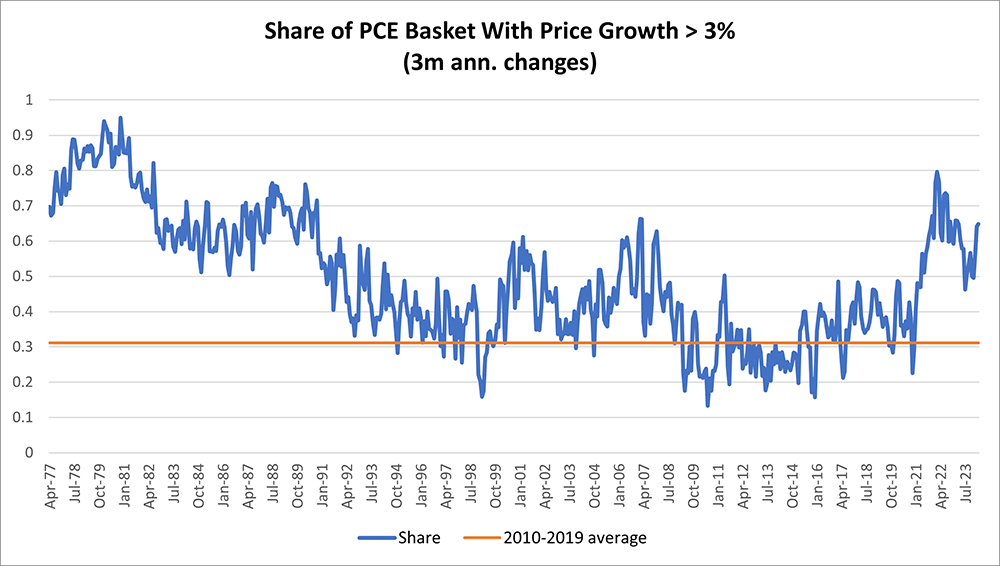
Looking at an even narrower three-month comparison yields a similar result. As shown in Figure 3 below, the share of PCE expenditures with three-month annualized price growth greater than 3 percent as of March was 64.9 percent, more than double the average share of 31.2 percent observed from 2010 through 2019.
These calculations suggest that pricing pressure remains broad in terms of household consumption expenditure shares. While it is possible for overall inflation to return to normal despite a large share of goods and services seeing high price increases — which happens if the remaining goods and services are experiencing unusually low price increases — that doesn't appear to be happening right now. It may be the case that, for inflation to return to normal, the share of spending with elevated price growth will have to return to levels we observed when inflation was closer to the Fed's 2 percent inflation goal.
Views expressed in this article are those of the author and not necessarily those of the Federal Reserve Bank of Richmond or the Federal Reserve System.
Contact Us