Labor Market Concerns? Neither Here nor There
Macro Minute
September 24, 2024
Initial jobless claims are one of the most highly watched indicators for the labor market. Given the length of the current expansion and the Fed's monetary policy actions — as the effective federal funds rate remained at 5.33 percent since August 2023 until September 2024 — worries of a recession have heated up throughout much of 2023 and 2024.
Softening in the labor market over the summer has renewed these fears as monthly job growth has slowed, especially after recent revisions made by the Bureau of Labor Statistics. Most information about the labor market is released with a lag, especially separations. (For instance, Job Openings and Labor Turnover Survey, or JOLTS, is at least one month behind.) Jobless claims provide the most up-to-date snapshot about recent trends in separations and have trended upwards over the last seven months, amplifying recessionary concerns. This post will compare the increase in claims to similar periods since the 1960s to contextualize where we are now and what we might expect moving forward.
Initial Jobless Claims Series
Figures for initial jobless claims are released weekly by the Department of Labor, after adjusting for predictable seasonal events like holidays and school schedules. They are administrative data that measure the number of applications for unemployment insurance after a layoff from an employer (and do not include employees who were fired). After one week of unemployment, claimants reapply for unemployment insurance and are counted as "continuing claims," instead of initial claims. This post will focus on initial claims, since they provide insight about the state of the labor market and the number of layoffs across the country.
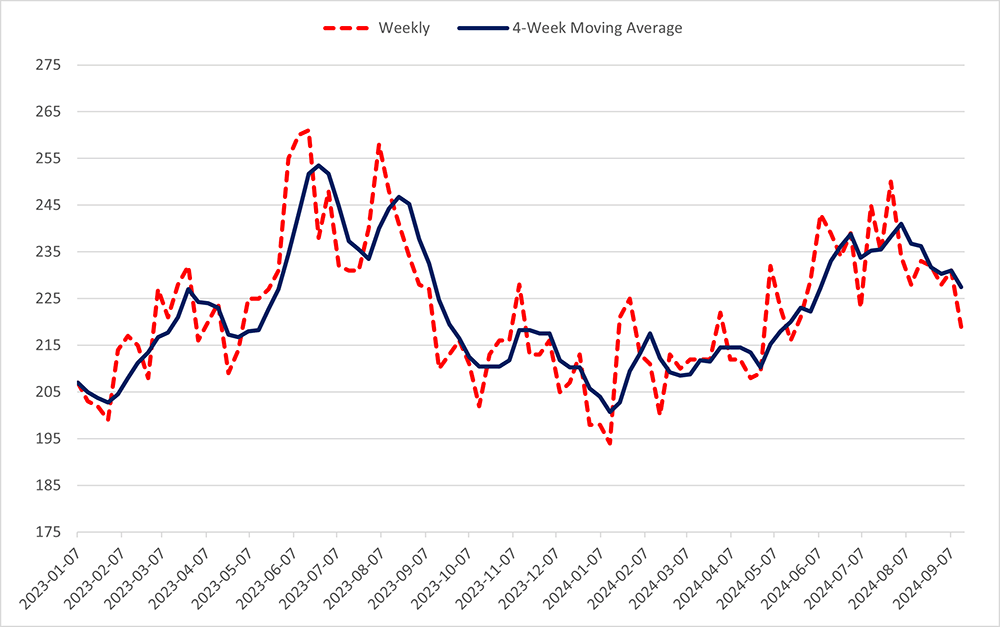
Figure 1 below shows the weekly series of initial claims and their four-week moving average. The four-week moving average has steadily trended upwards through the first seven months of 2024: It was at a trough of an average of 194,000 claims per week during the four weeks ending on Jan. 13 and climbed to a peak of 241,000 claims per week during the four weeks ending on Aug. 3.
Does this trend indicate a weakening of the labor market and a sign of a potential recession? As seen in Figure 1, there is a similar trend in the first half of 2023. (Note that this is after seasonal adjustment, and this trend does not occur every year.)
Claims Rate Series
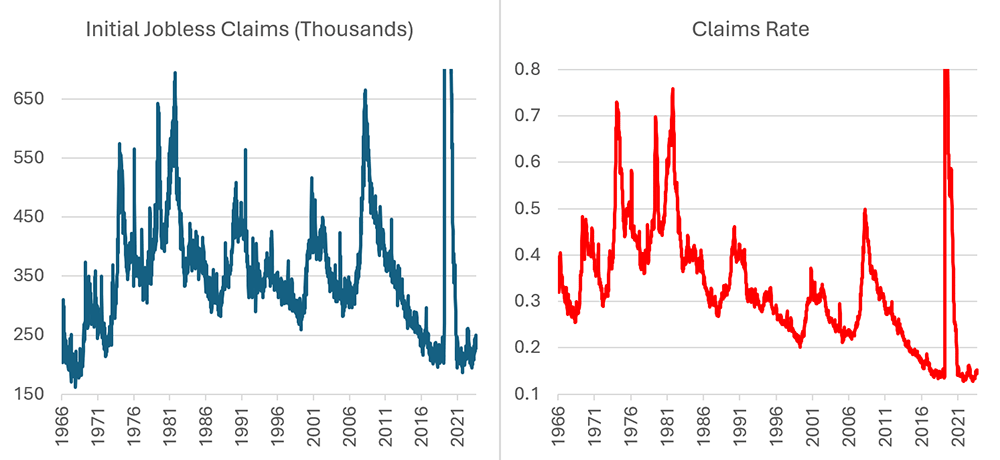
To compare the 2024 trend to other recent periods, it can be useful to normalize jobless claims to account for the size of the employed population. I calculated the "claims rate" as the ratio of claims to the employed population. As seen in Figure 2 below, while initial jobless claims are at levels similar to those seen in the 1960s and early 1970s, the claims rate is historically low following the immediate aftermath of the pandemic, as the employed population has more than doubled since that time.
2024 Trends Throughout History
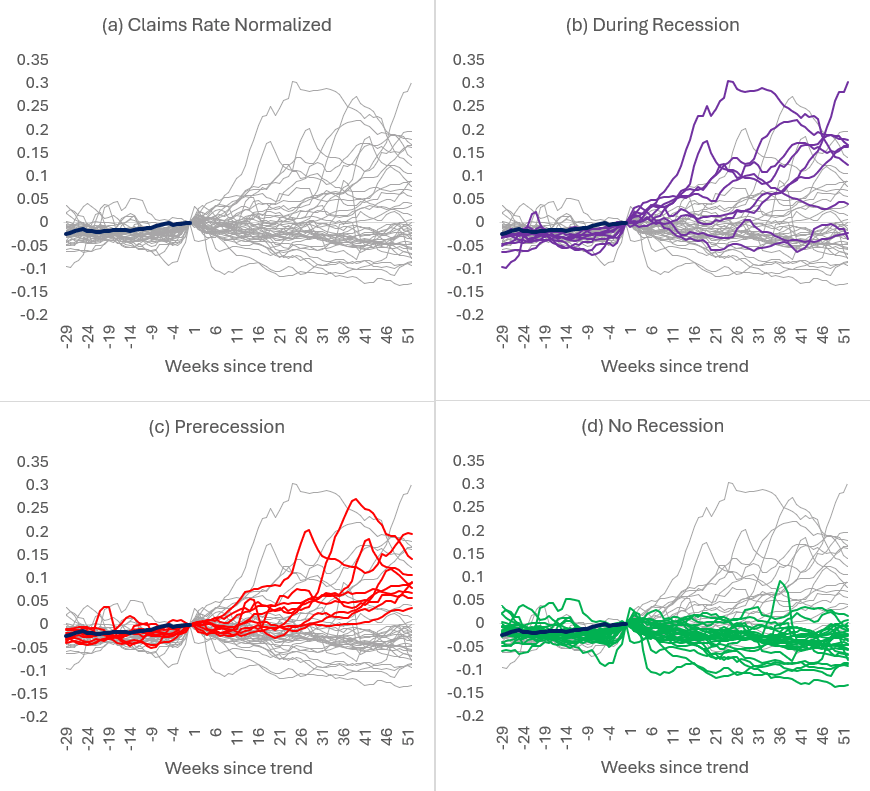
I conduct a qualitative exercise to assess the potential recession risk signaled by the uptick in claims in 2024. I identify 44 incidences in which claims rose in a similar time frame by as much as we have currently experienced in 2024. The first panel of Figure 3 below shows these 44 occurrences, normalizing the level of claims at the end of each episode to zero. The remaining panels decompose these past trends into three categories based on their context:
- During a recession as defined by the NBER (panel b)
- Prerecession, i.e., a recession occurs within one year (panel c)
- No recession occurs in the next year (panel d)
In nine of the 44 occurrences, the economy was already in a recessionary period. While today's data do not seem to indicate that a recession is underway, these series show that there is a wide range of potential paths over the next year and a lot of noise in this series in general.
In nine other times, the claims rate continued to rise, and the economy experienced a recession. In these cases, claims were a leading indicator for a recession.
However, a recession did not follow the 26 remaining instances in which initial jobless claims increased as much as in the first eight months of 2024. This shows that it can be difficult to predict a recession based on an increase in the claims rate, as there are plenty of false positives.
What Does This Teach Us About Today?
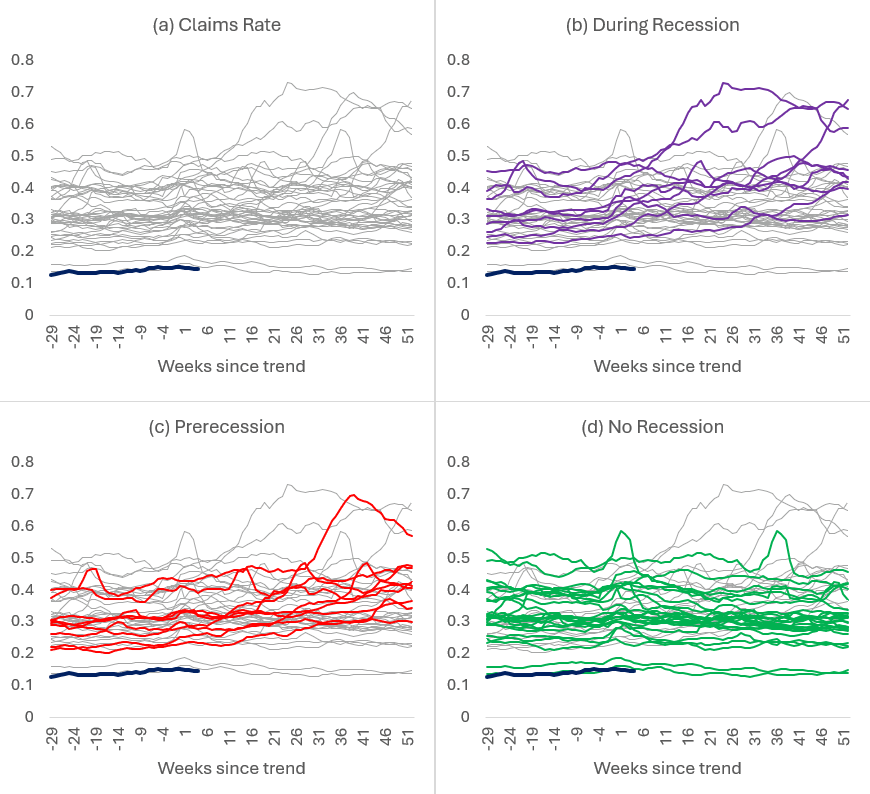
While the trend in the claims rate may be inconclusive, the level of the claims rate appears to be inconsistent with historical recessions. Figure 4 below displays the actual claims rate during the 44 incidents identified above, showing that the claims rate remains historically low, particularly compared to previous recessions.
As seen in the third panel of Figure 4, the lowest claims rate after a similar trend but prerecession is 0.23 percent (which occurred in May 2000). This would be the equivalent of 365,000 weekly claims based on the employed population in 2024, over 100,000 more than the peak this year. Thus, the recent uptick in the claims rate may be more of a normalization following an unusually strong labor market, rather than a cause for concern.
Views expressed in this article are those of the author and not necessarily those of the Federal Reserve Bank of Richmond or the Federal Reserve System.
Contact Us