Consumer Spending: By the People, for the People
Macro Minute
September 23, 2025
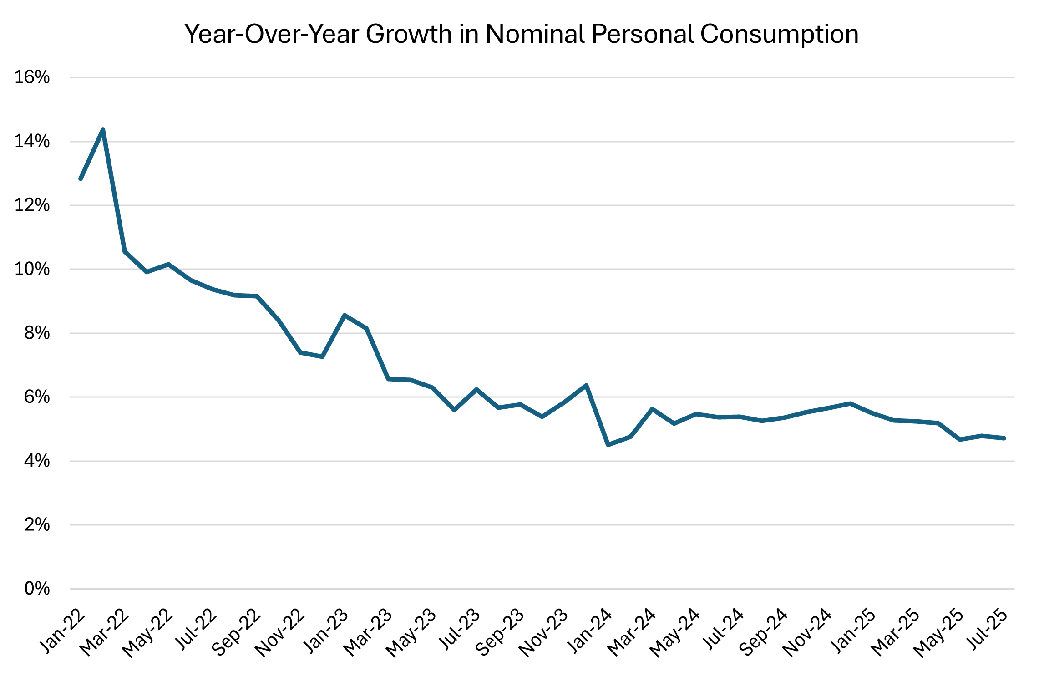
One possible indication that consumer demand is slowing is that the year-over-year growth rate of nominal personal consumption expenditures (PCE) has declined significantly compared to the immediate postpandemic period. Falling demand is associated with declines in both prices and quantities, and both forces would depress the growth rates of nominal consumption. In July, nominal PCE grew 4.7 percent year over year, compared to 5.4 percent in July 2024, 6.2 percent in July 2023, and 9.4 percent in July 2022 (as seen in Figure 1 below). These readings are notably higher than the average year-over-year growth rate of 4.0 percent in the five years before the pandemic.
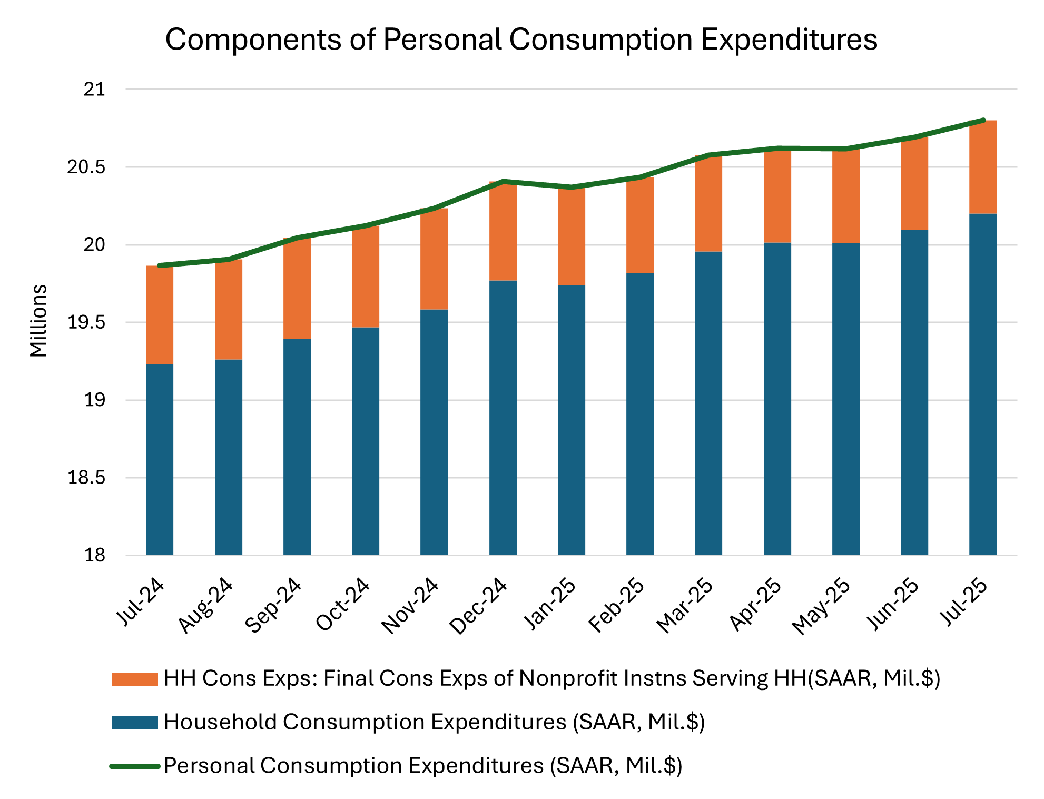
A deeper dive into the PCE report uncovers an important detail behind this decline. As shown in Figure 2 below, PCE can be divided into two categories: household consumption expenditures and final consumption expenditures of nonprofit institutions serving households. For example, the value of education services that a university provides a student consists of the portion paid by the household (e.g., tuition) and the portion funded by other sources (e.g., the university's endowment). In other words, PCE includes both households' expenses and expenses paid directly by third parties.
The growth rates of these two PCE components are diverging. As shown in Figure 3 below, the year-over-year growth rate of household consumption expenditures was 5.1 percent in July 2025, the same as its July 2024 reading. In contrast, the year-over-year growth rate of nonprofit consumption was -5.6 percent in July, compared to its year-ago increase of 14.6 percent. Thus, it appears that the slowing in the year-over-year growth rate of overall PCE was entirely due to a decline in growth of nonprofit spending on behalf of households.
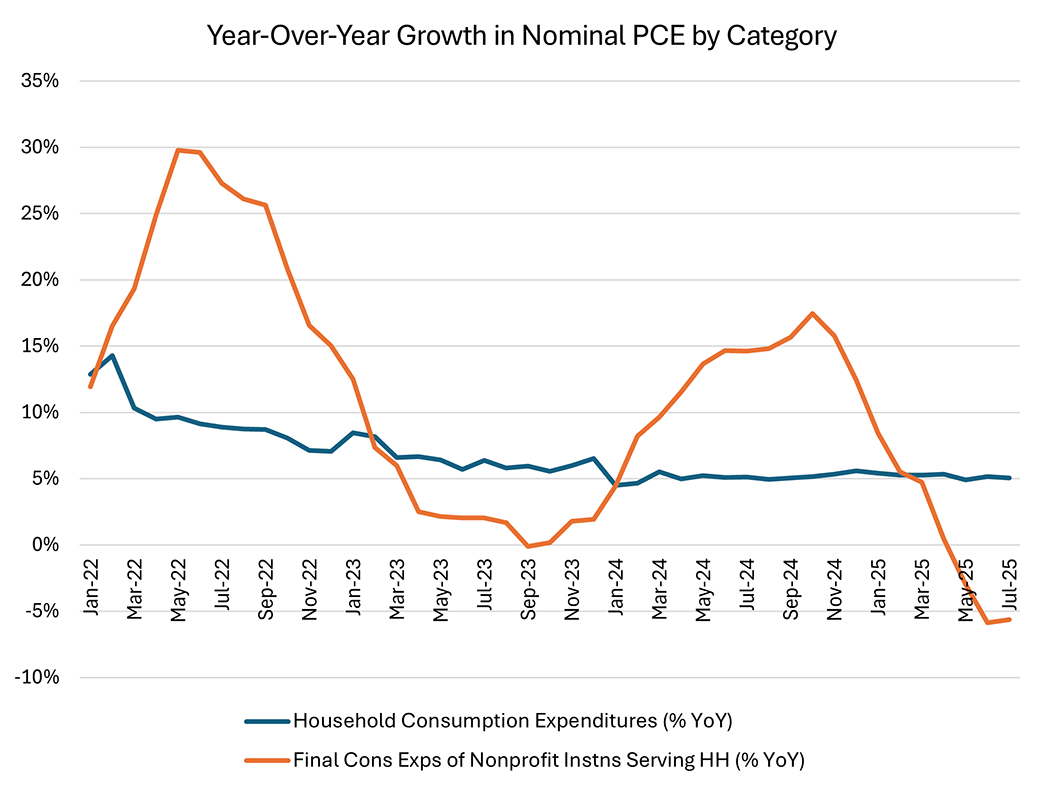
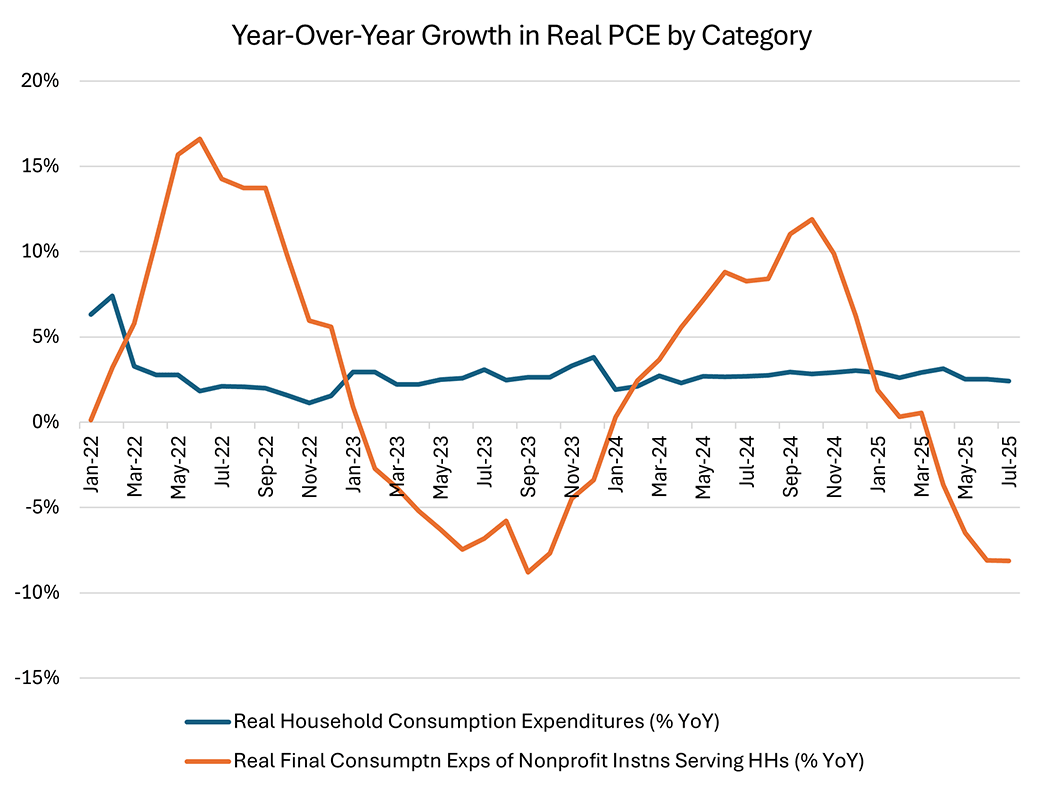
Figure 4 below shows that the overall message of Figure 3 holds when looking at real spending growth as well. Year-over-year growth of real household spending was 2.4 percent in July, slower than its year-ago reading of 2.7 percent but within the range observed in 2024. In contrast, real nonprofit spending fell 8.1 percent year over year in July, compared to positive readings in each month of 2024.
This breakdown reveals two things. First, consumers may be holding up better than the top-line PCE spending figures suggest. Second, the slowdown in headline PCE spending seems to be driven by a slowdown in nonprofit spending, which may indicate stress in the nonprofit sector of the economy.
Views expressed in this article are those of the author and not necessarily those of the Federal Reserve Bank of Richmond or the Federal Reserve System.
Contact Us