The Importance of Import Prices
Macro Minute
August 5, 2025
According to the most recent data from the Bureau of Labor Statistics (BLS), core import prices — specifically, the prices of imports excluding food and fuels — rose 0.2 percent in June over the previous month and are 1.0 percent higher than they were the same time in 2024. Figure 1 below plots year-over-year core import price inflation, showing that current rates of import price growth are far lower than during the pandemic period.
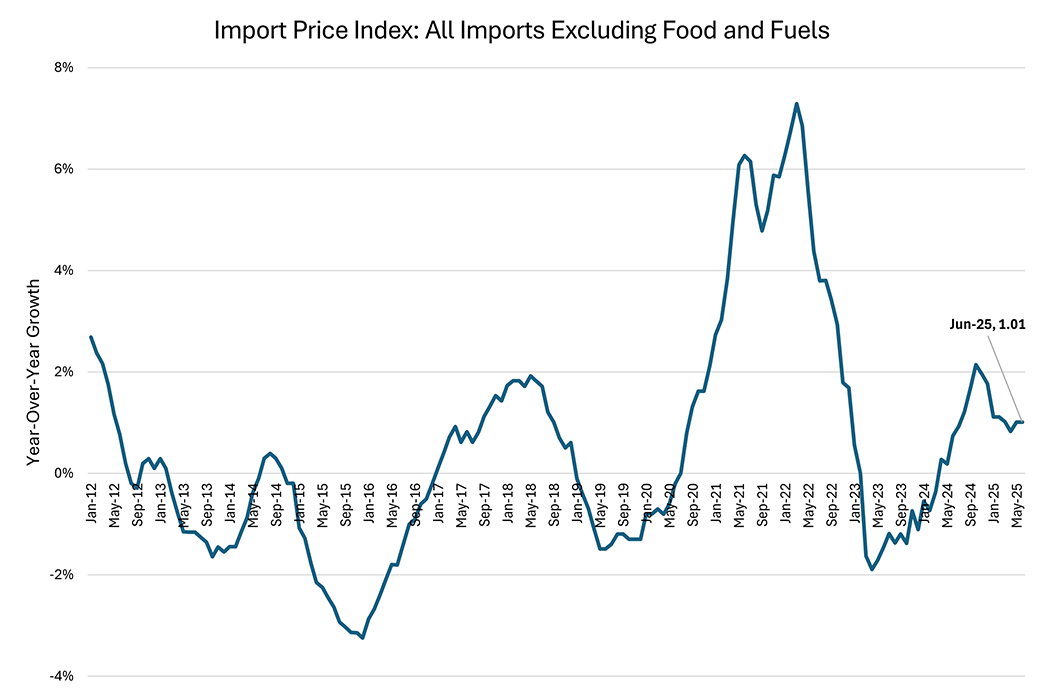
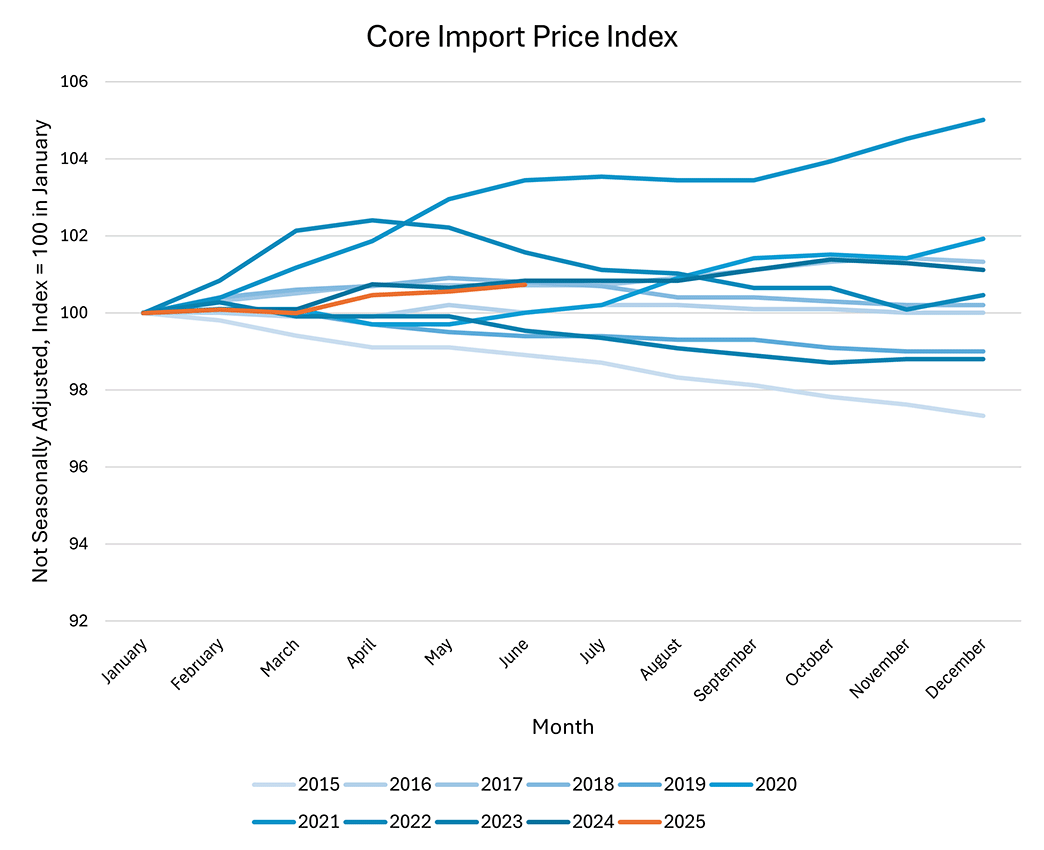
Figure 2 below shows the level of the core import price index (with each year normalized to equal 100 in January) over the past decade. While core import prices have risen so far this year, the monthly evolution of the price level appears to be well within the range of movements observed over the past 10 years, despite the dramatic changes in trade policy that have occurred in 2025.
Despite limited signs of price pressure for core imports, an important consideration for users of the BLS import price indexes is that they do not reflect the "out-of-pocket" prices faced by importers because they exclude tariffs. According to the BLS, "One of the primary purposes of the indexes is to deflate the foreign trade component of the national accounts which specifically exclude taxes when measuring GDP accounts." As a result, the BLS's import price indexes mainly reflect the prices of imported commodities before the recent tariffs.
Nevertheless, these price indexes can still provide context on the extent to which foreign exporters are absorbing the costs of tariffs. Foreign exporters might lower their prices when importing countries raise tariffs in order to maintain market share. If this happens, consumers in the importing country could face price increases on imported goods smaller than the amount by which tariffs are raised.
Figure 3 below shows six-month annualized growth rates for the import price indexes of selected commodity categories. Each category's growth rate is normalized by subtracting its respective 2022-2024 annualized growth rate to control for pricing trends that were in place prior to 2025's changes in tariff policies.
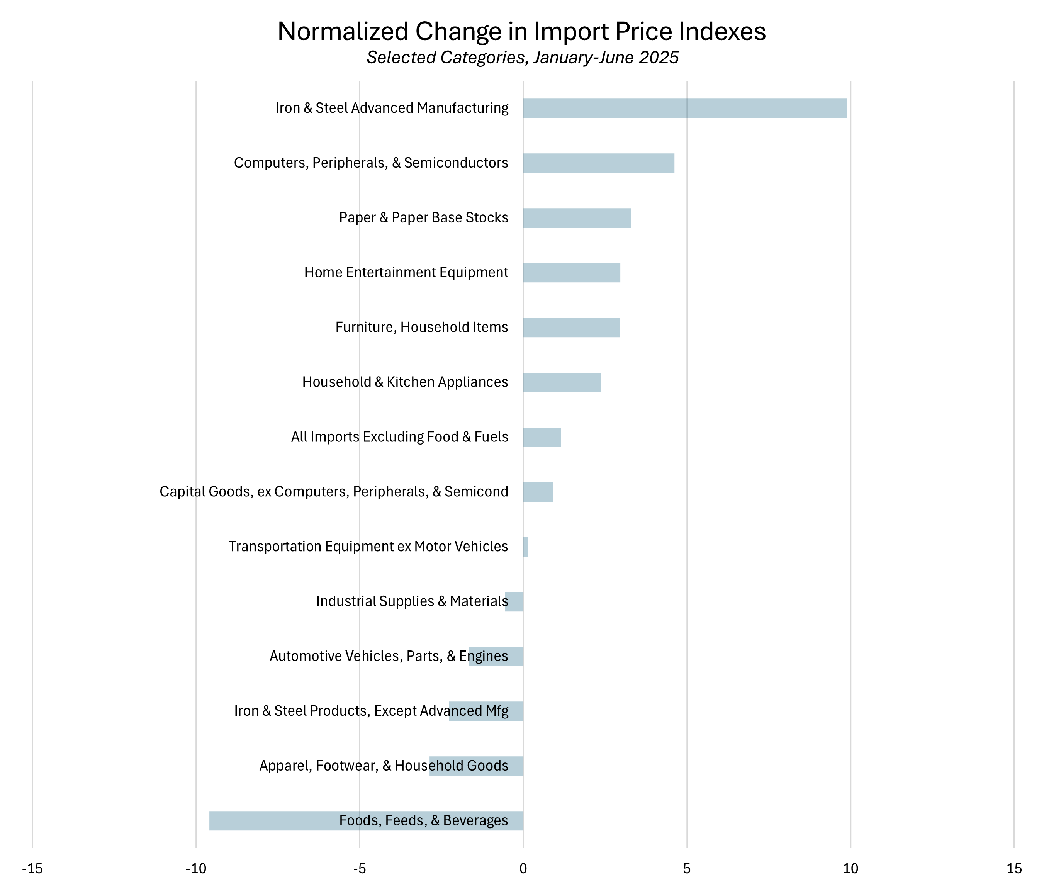
The figure shows that some commodity categories have seen price declines relative to 2022-2024 trends over the past six months, which may support the idea that some foreign exporters lowered their prices in response to higher U.S. tariffs. These categories include apparel; foods, animal feeds and beverages; and nonadvanced iron and steel products.
In contrast, import price growth has increased relative to 2022-2024 trends in advanced manufacturing; household appliances and entertainment equipment; and computers, peripherals and semiconductors. This suggests that exporters of more specialized and advanced products may have more pricing power and are less prone to reducing prices due to tariffs than exporters of less specialized products.
While the import price indexes can provide some useful context on who bears the cost of tariffs, a deeper understanding of tariff incidence would need to take into account issues such as differences in tariff policies across exporting countries, differences in product categories, and multilateral trade agreements such as the U.S.-Mexico-Canada Agreement. For more insight, my colleague Marina Azzimonti has written a series of articles covering various aspects of trade policy changes.
Views expressed in this article are those of the author and not necessarily those of the Federal Reserve Bank of Richmond or the Federal Reserve System.
Contact Us