Sifting Through Revisions, Labor Market Seems Strong
Macro Minute
February 25, 2025
January's employment situation report can be difficult to parse, because the Bureau of Labor Statistics revises data and updates underlying assumptions in the two main surveys from which the major labor market indicators are derived. What is the nature of these revisions, and do they change our understanding of the current state of the labor market?
The establishment survey — the source of data on nonfarm payroll employment, hours worked and average hourly earnings — was benchmarked in January to employment counts derived from state unemployment insurance records. These data are published in the BLS's Quarterly Census of Employment and Wages (QCEW) and encompass the full population of jobs covered by unemployment insurance. So, this yearly exercise helps close the gap between the QCEW and employment estimates from monthly business surveys, which might miss important changes due to the entry and exit of firms as well as sampling error. This year, the BLS also updated its seasonal adjustment factors, which affected historical data from January 2020 onward.
Overall, the revisions did not lead to a major change in our view of the labor market. The total payroll employment level was revised downward by 598,000 for March 2024. As shown in Table 1, these revisions led to downward adjustments in 2024's month-over-month payroll growth: On average, we added 166,000 jobs per month over the course of 2024, rather than 186,000. However, November and December were revised upward by a combined 100,000 from their previous estimates, indicating the labor market finished the year on a strong note.
| 2024 | As revised | As previously published | Difference |
|---|---|---|---|
| January | 119 | 256 | -137 |
| February | 222 | 236 | -14 |
| March | 246 | 310 | -64 |
| April | 118 | 108 | 10 |
| May | 193 | 216 | -23 |
| June | 87 | 118 | -31 |
| July | 88 | 144 | -56 |
| August | 71 | 78 | -7 |
| September | 240 | 255 | -15 |
| October | 44 | 43 | 1 |
| November | 261 | 212 | 49 |
| December | 307 | 256 | 51 |
| Average | 166.33 | 186.00 | |
| Source: Bureau of Labor Statistics, Employment Situation Summary - 2025 M01 Results | |||
January saw more normal job growth compared to the strength of the newly revised end-of-year numbers. After adding 261,000 jobs in November and 307,000 jobs in December, January payrolls expanded by 143,000 jobs, with gains in health care (44,000), retail trade (34,000), government (32,000) and social assistance (22,000).
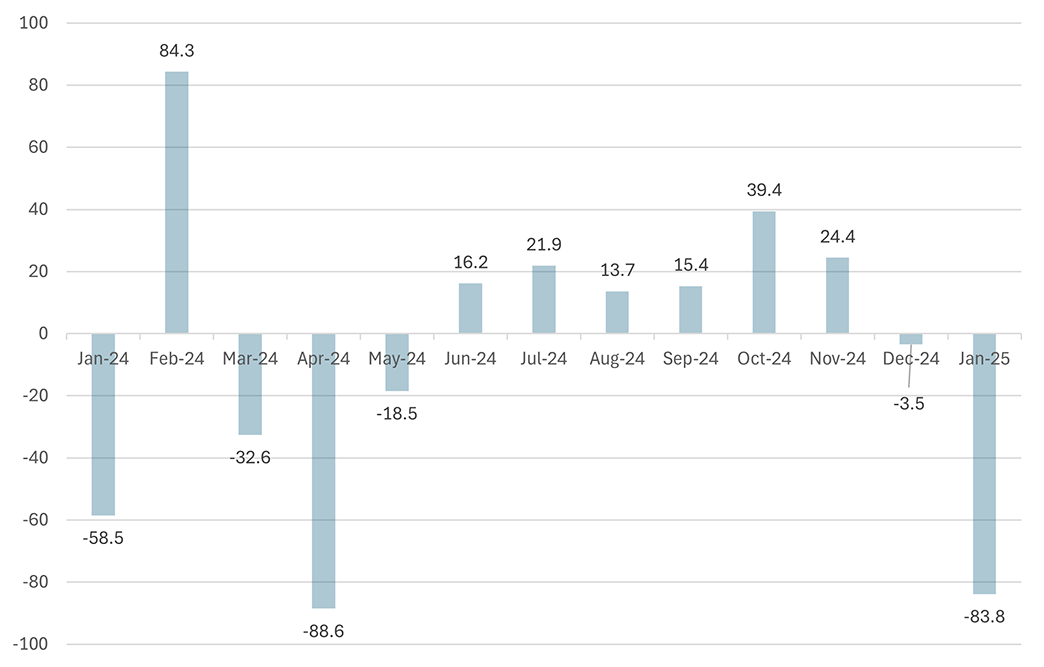
Adverse weather conditions may have curtailed hiring in January: As shown in Figure 1, a model by the San Francisco Fed estimates weather depressed payroll growth by about 84,000 jobs. The three-month moving average of payroll gains — which can smooth through temporary monthly fluctuations — rose from 182,000 in November to 204,000 in December to 237,000 in January. This is well above the estimated pace needed to maintain a constant employment-population ratio.
Meanwhile, in the household survey (the source of the unemployment rate and labor force participation rate [LFPR]), the BLS incorporated new population estimates from the Census Bureau, which more accurately count net international migration. Because the BLS does not revise historical household survey data, the new population controls only affect data from January 2025 onward. The new estimates increased the estimated size of the civilian population by 2.9 million, with relatively larger increases for Asian and Hispanic populations. The total labor force rose by 2.1 million, with employment rising 2.0 million and unemployment increasing by 105,000 over previous estimates. Table 2 shows that, although the impact on levels was large, the revisions had only a small effect on ratios such as the unemployment rate and LFPR, amounting to a 0.1-percentage-point increase in the unemployment rate, LFPR and the employment-population ratio in December 2024.
| Dec-Jan change, as published | 2025 population control effect | Dec-Jan change, after removing the population control effect | |
|---|---|---|---|
| Civilian noninstitutional population | 3,047 | 2,871 | 176 |
| Civilian labor force | 2,197 | 2,106 | 91 |
| Participation rate | 0.1 | 0.1 | 0 |
| Employed | 2,234 | 2,000 | 234 |
| Employment-population ratio | 0.1 | 0.1 | 0 |
| Unemployed | -37 | 105 | -142 |
| Unemployment rate | -0.1 | 0.1 | -0.2 |
| Not in labor force | 850 | 765 | 85 |
| Source: Bureau of Labor Statistics, Employment Situation Summary - 2025 M01 Results | |||
Controlling for these population adjustments, there was no change in the LFPR (62.6 percent) or the employment-population ratio (60.1 percent) from December to January, and household employment rose by 234,000 in January. The unemployment rate dropped 0.2 percentage points after controlling for the population adjustments, falling to 4.0 percent. These figures continue to indicate labor market conditions remaining stable and in healthy territory at the start of 2025.
Views expressed in this article are those of the author and not necessarily those of the Federal Reserve Bank of Richmond or the Federal Reserve System.
Contact Us