Something Fishy With Job Openings?
Macro Minute
November 18, 2025
Is something fishy going on with job openings? With 7.2 million job openings as of August 2025, vacancies seem high, especially relative to the five-year pre-pandemic average of 6.4 million. Vacancies also seem high relative to unemployed workers. With 7.4 million unemployed workers as of August, the ratio of job openings to unemployed workers (V/U ratio) is 0.98, compared to an average of 0.93 in the five years before the pandemic. The V/U ratio surged during the post-pandemic labor market and remains elevated relative to other indicators of labor market tightness. In this post, we'll further explore the V/U ratio and what it suggests about the labor market.
Figure 1 below shows a survey-based measure of labor market tightness — perceptions of whether jobs are plentiful from the Conference Board's Consumer Confidence Survey — plotted against the V/U ratio, with both variables indexed to 100 in 2019. Prior to the pandemic, both measures moved closely together, but following the pandemic, the V/U ratio increased much more sharply relative to the Conference Board measure and has remained higher since then.

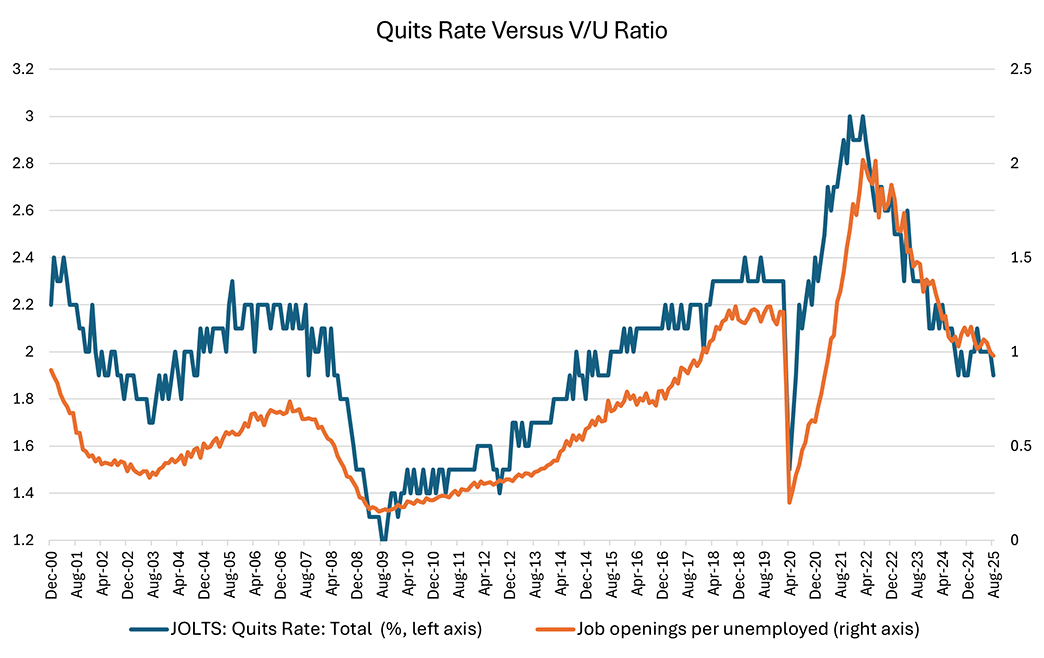
Alongside "soft data" measures like the Conference Board's labor market perceptions index, the V/U ratio also remains elevated relative to "hard data" measures of labor market tightness. One such measure is the quits rate, which is plotted in against the V/U ratio. The quits rate tends to rise during tight labor market conditions, as workers feel more empowered to leave their jobs and seek other career opportunities. In general, the quits rate has moved closely with the V/U ratio: The correlation between the two series since December 2000 (when the data start) is 0.85.
However, in the most recent (August 2025) observation, the quits rate was 1.9 percent, similar to levels observed in 2015. While this might lead one to guess that the V/U ratio also returned to 2015 levels, the observed V/U ratio of 0.98 in fact more closely resembles 2018 levels, when the quits rate was 0.25 percentage points higher. As with the Conference Board's index, this disparity suggests that the current ratio of vacancies to unemployment is elevated compared to historical patterns.
We can exploit the relationship between the quits rate and the V/U ratio to assess the extent to which job vacancies remain elevated compared to historical norms. To do this, we run a regression of the V/U ratio on the quits rate using 2000-2019 pre-pandemic data and use the estimated relationship to predict V/U ratios after 2020. Figure 3 below plots an example of our exercise. The purple dashed line represents the predicted V/U ratio based on 2000-2019 data.
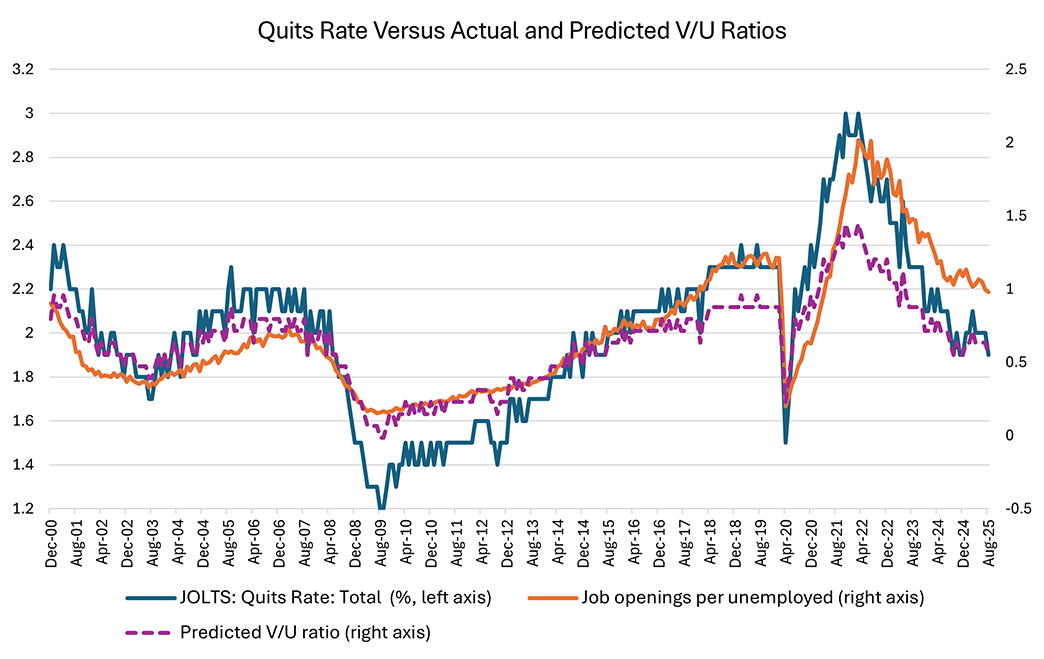
The latest observations of the predicted V/U ratios fall below the observed V/U ratios, suggesting the ratio of vacancies to unemployed still remains elevated when compared to levels that would be inferred from the pre-pandemic relationship between V/U and the quits rate. Interestingly, the regression model suggests that the V/U ratio was elevated in the three years prior to the pandemic, suggesting that elevated vacancies may predate pandemic-era labor tightness.
V/U ratios and quits rates are also available at the industry level, allowing us to gauge which industries' job postings appear more elevated relative to levels that would be predicted with the quits rate based on pre-pandemic data. For example, Figure 4 below plots the quits rate in the manufacturing industry against its predicted and observed V/U ratios. In manufacturing, the gap between the actual and predicted V/U ratios is smaller than the gap for the overall economy.

Our full industry results are shown in Table 1 below. We find that the predicted V/U ratio for August 2025 is higher than the observed ratio across the majority of industries. This suggests that vacancies in many industries no longer appear to be elevated relative to levels that would be predicted based on the pre-pandemic relationship between V/U ratios and quits rates. However, there are exceptions: In the financial activities industry, the observed V/U ratio is more than half a percentage point higher than the predicted ratio. Observed V/U ratios are also higher than predicted in the leisure and hospitality industry and the trade, transportation and utilities industry.
| Industry | Estimated August 2025 V/U Ratio | Lower 80% Confidence Interval | Upper 80% Confidence Interval | Actual V/U Ratio (August 2025) | V/U Difference (Actual - Predicted) |
|---|---|---|---|---|---|
| Mining and Logging | 2.41 | -2.85 | 7.67 | 1.00 | -1.41 |
| Government | 1.77 | 0.52 | 3.03 | 1.42 | -0.35 |
| Professional and Business Services | 1.73 | 0.40 | 3.06 | 1.40 | -0.34 |
| Other Services | 1.17 | 0.04 | 2.30 | 0.94 | -0.23 |
| Information | 1.55 | -0.38 | 3.47 | 1.39 | -0.16 |
| Construction | 0.58 | 0.14 | 1.02 | 0.43 | -0.15 |
| Private Educational and Health Services | 2.02 | 0.66 | 3.38 | 1.89 | -0.13 |
| Manufacturing | 0.76 | 0.01 | 1.50 | 0.73 | -0.02 |
| Trade, Transportation, and Utilities | 0.69 | 0.12 | 1.25 | 0.86 | 0.18 |
| Leisure and Hospitality | 0.78 | -0.29 | 1.84 | 1.20 | 0.42 |
| Financial Activities | 1.54 | 0.14 | 2.93 | 2.26 | 0.73 |
| Total | 0.61 | 0.15 | 1.07 | 1.00 | 0.39 |
| Source: Bureau of Labor Statistics via Haver Analytics | |||||
However, these gaps are not statistically significant. Table 1 shows the upper and lower limits of the 80 percent confidence interval associated with each prediction. The actual V/U ratios fall within the 80 percent confidence interval for all industries. This indicates that, despite some industries' job vacancies appearing high compared to what we would predict based on their pre-pandemic relationship with quits rates, there is still not enough evidence from a statistical standpoint to conclude that the latest data represent a significant break from historical patterns. Though there may be a whiff of fishiness around the job openings series, it's difficult to say that we should completely disregard signals of labor market tightness based on these data.
Note: Macro Minute will take a break the week of Thanksgiving, which will be followed by the Federal Open Market Committee blackout. Our final post of 2025 will be published on Dec. 16.
Views expressed in this article are those of the author and not necessarily those of the Federal Reserve Bank of Richmond or the Federal Reserve System.
Contact Us