Forecasting the COVID-19 Epidemic for the U.S.
Special Report
May 8, 2020
Updated Estimates and Forecasts
June 10, 2020: We have updated estimates and forecasts of infection and mortality rates in the United States and in the constituent states of the Fifth District. The current update is based on data up to June 6 and now also includes mortality projections for the latter. We reestimate the model with the recent data so that the projections reflect both the influence of revised model estimates and more data. A full set of graphs for U.S. and Fifth District forecasts is available online.
For the entire United States, we now project median fatalities of 184,000 with a 95 percent range of 175,000 to 193,000 by early September. The corresponding number of total infections is 3.1 million. Even three months out, we expect the United States to have 10,000 new cases and almost 600 deaths daily. Our forecast intervals have shifted slightly upwards, possibly on account of relaxed social distancing measures in many parts of the United States since early May. Otherwise, the model performs exceedingly well in that projections for daily infections and fatalities become more precise and data realizations continue to lie within error bands.
Over the same horizon, we project 3,400 cumulative fatalities in Virginia, 2,800 in North Carolina, 5,500 in Maryland, and 1,200 in South Carolina, with the District of Columbia and West Virginia below the 1,000 mark, although the per capita rates in the former are exceedingly high. Although forecast intervals have tightened, the data flow for North and South Carolina has started to fall outside of the error bands from the previous forecast, which led to a considerable revision in the estimates. The pattern of new infections and deaths for these two states suggests the effect of early relaxation of lockdown measures, although the per capita rates are still comparatively low. We are developing a richer model for all states that allows forecasts to adjust to variables including the amount of social distancing. Preliminary results and further discussion are here.
Introduction
A key weapon in fighting the COVID-19 epidemic is understanding how the contagion has spread through the U.S. population and how its spread is likely to evolve in the future. Based on such knowledge, public health measures can be devised, whether they are social distancing recommendations or more stringent lockdown procedures. Understanding of the disease's path can be gained using theoretical or statistical modelling techniques that allow researchers to forecast its future course, which can then be used as a basis for decisions about further public health measures.
The coronavirus behind the COVID-19 pandemic is a novel contagion that is highly infectious, has a long incubation period, and can transmit asymptomatically, that is, without an infected person showing any signs of infection or disease. At the same time, this also means that data on infections and even deaths caused by the disease are difficult to collect, resulting in time lags between infections, possible fatalities, and data availability. In addition, the coronavirus is novel enough that previous experiences, such as the SARS pandemic of 2003, may not be immediately applicable.
A particularly vexing feature of many attempts to project the course of the pandemic in the U.S. and across the world is that projections have changed frequently, often in significant ways. This is true of forecasting models that rely on strong theoretical relationships, such as the Imperial College model that informed the U.K. government's early response to the crisis, but also of the statistical model developed by the Institute for Health Metrics and Evaluation at the University of Washington that was referenced in the U.S. government's response.
This aspect of forecasting the course of the pandemic is problematic insofar as frequent revisions may cast doubt on the validity of the model. Macroeconomic forecasters are familiar with this challenge since the economy is buffeted by shocks, the data are subject to measurement errors, and the underlying behavior of the variables may change over the forecast horizon because of policy interventions. All of these aspects are present in the current situation when attempting to forecast the path of the pandemic.
However, there is the danger that policymakers and the public lose trust in the researchers' and forecasters' ability to capture and describe the disease. In such a forecasting environment, the source of uncertainty needs to be carefully communicated and taken into account during the decision-making process. Moreover, forecasters should adapt to the changing nature of the data and where forecasts went wrong.
In this article, we describe a statistical model that we use to estimate and forecast the path of infections and deaths caused by COVID-19 in the U.S. We focus on documenting the uncertainty surrounding the estimates and projections, as our approach is not immune to the issues raised above. However, we argue that understanding the source of uncertainty is an important step in making public health decisions.
The Epidemic Forecasting Model and Data
We have developed a statistical model for estimating and forecasting the number of infections and deaths over the course of the pandemic. (Documentation of the model and the sources can be found online.) Our model is almost entirely data-driven, in that it tries to match the underlying time series properties of the data at hand in a flexible manner while at the same time relying on guidance from epidemiological insights about how an epidemic runs its course.
The time path of the number of infections during an epidemic follows a typical pattern. When a pathogen enters a population that is susceptible to infection, the number of infected cases is initially low. However, the growth rate of new infections is high and tends to rise sharply at an exponential rate because each infected person creates a chain of new infections. At some point, however, the pathogen runs out of susceptible hosts, either because they are already infected, are immune, or they are simply not physically present due to health policies such as social distancing. At this inflection point, the growth rate of infections falls until it eventually declines to zero.
In our empirical model, we attempt to replicate these broad patterns of an epidemic. We do so by specifying a flexible functional form that describes the path of infections over time as depending on the current and lagged levels of the number of infections. The model is loosely parameterized, whereby the parameters are estimated to provide best fit of the model specification to the available data. In contrast to theoretical epidemiological models, our specification has more leeway to go where the data tell it to and is not constrained by precise theoretical relationships that may be specified incorrectly.
Identification of the model parameters is based on the growth rate and changes in the growth rate of infections. Early in an epidemic, the data typically show exponential growth, rapid and increasing, whereas after some time, as the stock of susceptible hosts starts getting smaller, the rise in the growth rate decelerates until it reaches a peak. Afterward, the growth rate of new infections declines. These three distinct phases of an epidemic can be associated with distinct parameters in our model, which are thus identified from the data flow.
This is also where a problematic aspect of any epidemiological model lies. At first, data are sparse, but the underlying course of the infection is such that it should be easy to forecast. Put differently, the epidemic develops a very strong trend with exponential growth. Simply extrapolating from this growth trend would produce good forecasts for a while — until the spread starts slowing down and gravitates toward an inflection point. While epidemiological models based on the course of previous epidemics confirm that there will be an inflection point, estimates from the sparse initial data are highly uncertain. Moreover, theoretical and statistical epidemiological models are sensitive to small variations in parameters. It is in this sense that model estimates and forecasts should be interpreted with much caution at the beginning of the pandemic, and uncertainty at this stage should explicitly be taken into account when making public health policy decisions.
In addition to modeling infections, we also consider the mortality rate. Fundamentally, the number of deaths is a function of the number of infections. Not all infections are fatal, and an observed death is the outcome of a process that can vary over time. We thus assume that the number of deaths on any given day is proportional to the average number of observed infections over a time period. This captures the idea that there is a minimum number of days that pass after an initial infection can result in a fatality.
A key aspect of our modeling approach is that we explicitly capture the uncertainty of the model estimates and, perhaps more importantly, the uncertainty inherent in the forecast. The precision of a forecast, or how tightly possible alternative forecast paths are concentrated around the most plausible path, is generally affected by two factors: first, the uncertainty of the model estimates in terms of overall fit and parameter estimates since no statistical model fits precisely; and second, by the extent to which the model may be subject to further disturbances or imprecision in data collection in the future. We take both aspects into account to give a sense of how uncertain forecasts in a pandemic truly are, especially when the data flow is sparse at the beginning.
We fit our models to observed data on daily new cases of infections and deaths. The estimated models are then used to forecast the future paths of the respective variables, whereby we take into account all potential sources of uncertainty. We collect data from a variety of publicly available sources. The estimates are performed on these data up to and including May 3, 2020.
Estimates and Forecasts of the Number of Infections
Figure 1 shows the cumulative number of cases, i.e., infections, in the U.S. and the daily count of new cases as a percentage of the population. The grey line in the graph represents the actual number of measured new infections, while the orange lines are drawn from the estimated model. We show the best-fitting line and a 95 percent confidence region around these estimates. In other words, the estimates represent our assessment of the trend in number of infections as seen through the lens of the empirical model. They differ from the actual numbers because the latter are subject to various errors, such as simple data entry mistakes, different reporting guidelines and dates across the 50 states, and other idiosyncratic variations in how the disease progresses.
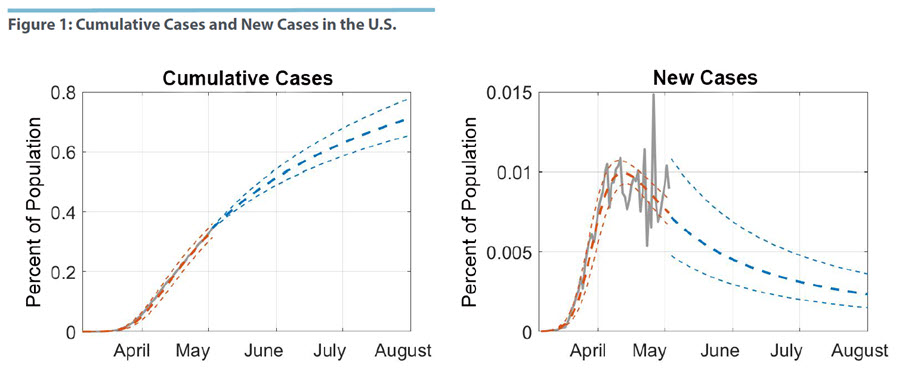
We estimate that the peak in the number of new infections was reached by mid-April, around April 12. After this date, the number of new infections has been falling slowly but steadily. In terms of the cumulative case numbers, this suggests that the U.S. is already past the inflection point and that measures to suppress the spread of the pandemic have been working to some degree. However, since mid-April the incoming data on new cases have become increasingly volatile. This appears largely driven by the fact that infections have spread beyond a few clusters with very high case numbers, specifically New York City, to a wider swath of states. At the same time, the volatility does not seem to affect the median estimated path as it shows a general downward trend from the estimated peak.1
Given our last data point on May 3, we project the time path of new infections and cumulative cases forward until the start of August. We show the median forecast in Figure 1. The uncertainty region prior to May 3 captures the estimation uncertainty of the fitted model, while the uncertainty region after May 3 includes uncertainty from disturbances in the data. We note that uncertainty about new case numbers widens immediately, which reflects both the uncertainty about the dynamics of the pandemic and the uncertainty inherent in the data process. More specifically, wide uncertainty bands and volatile data suggest that one should consider the broader trend rather than extrapolate too much from a few recent data points. Our forecasted range of new infections includes the estimated peak, which indicates that the U.S. is not out of the woods yet and that it may, in fact, have reached a plateau.
As the pandemic runs its course, the degree of uncertainty declines, however, and the incidence of new cases becomes more precisely estimated as the infection rate moves toward zero. The cumulative case numbers in Figure 1 are projected to grow over the next several months, albeit at a declining rate. By the start of August, we project 0.71 percent of the U.S. population will be infected, with a range of 0.66 percent to 0.78 percent.
In Figure 2, we take a closer look at how the passage of time and the availability of more data have affected our projections. We estimate our model for data that were available, respectively, 14 and 28 days ago, before the current estimation date of May 3. The projections as of April 5 are shown in green, those as of April 19 in red, and the current estimate is in blue. We only show the respective 95 percent confidence regions.
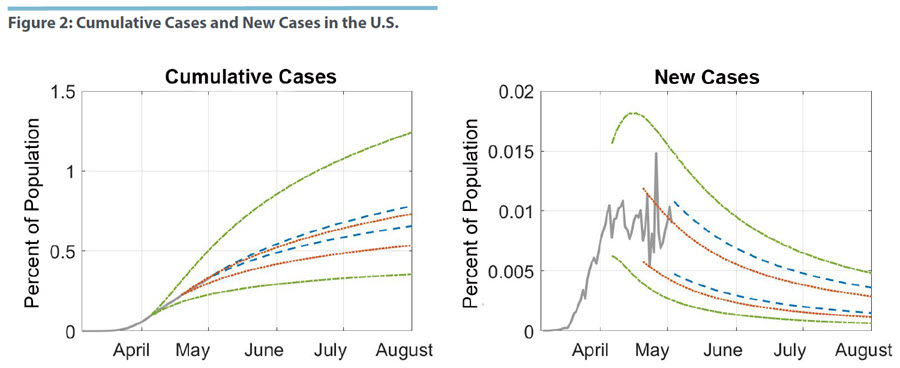
Overall, the estimates for the last two samples are contained in the uncertainty region of the April 5 sample. As more information became available, estimates of the underlying pattern in the infection data became more precise and the model developed a better sense of where the peak of new infections, thus the inflection point of the pandemic, were. Consequently, the projections became more precise. The same pattern can be seen for the April 19 and the May 3 sample. The latter is somewhat smaller, but it is also shifted upward for both cumulative and new cases. That is, the data flow over these 14 days led to improved precision in the forecast, but also in a revision of the projected path of the epidemic. We can tie this pattern to the fact that observed new infections appear to have plateaued over the last few days.
Mortality Forecasts for the U.S.
Figure 3 shows our estimates of the mortality model described above and our projections for cumulative deaths through the end of July. These projections depend on our models for both the number of cases and the mortality rate, allowing for estimation uncertainty and disturbances in both models. Our median projection of total fatalities by the start of August is 159,000, with a range of 140,000 to 181,000. We also estimate that the number of daily deaths peaked around April 20 at 2,300, but there is considerably more uncertainty when compared with the infection model.
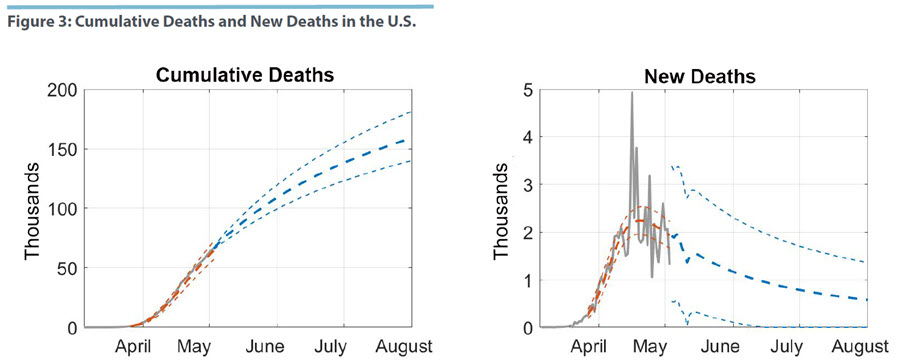
The peak of the mortality data comes with a delay of about one week after new infections have peaked. Given what we know so far about the course of COVID-19, this lag appears short since the time from infection to death appears to be about four to five weeks. However, we are measuring as new cases those who have been tested, and this group is dominated by those who have already developed more serious complications. Figure 3 also shows the increased volatility of the recent mortality data, which affects the precision of the projections. Specifically, we cannot rule out that the peak of daily deaths has been reached since the uncertainty region for several days out includes values that are considerably higher.
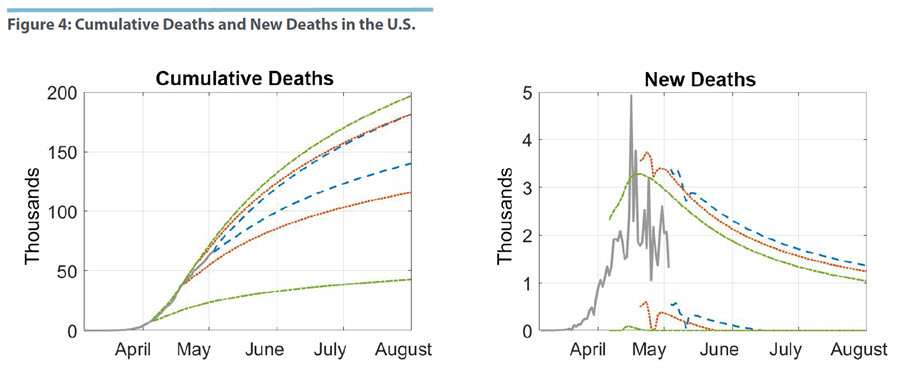
In Figure 4, we perform the same exercise as before where we estimate the mortality model for samples up to 14 and 28 days ago. Forecast uncertainty based on the April 5 data is very wide. The forecast left open the possibility that cumulative deaths would reach fewer than 50,000 by the start of August. At the time of the estimates, the sample was simply too short to result in tight inference. Moving the sample ahead to include data up to April 19 changes the outlook notably. In terms of cumulative deaths, the error bands are now contained within the April 5 region, while moving to the current sample tightens uncertainty further. The graph with the uncertainty region for new deaths suggests, however, that the reduction in uncertainty is coming from bounding the forecast distribution from below. That is, the model now puts more weight on a higher number of fatalities than could have been expected on April 5.
Conclusion
Using a statistical model of the COVID-19 pandemic that attempts to capture the underlying patterns and evolution of infections and deaths, we project that by the start of August there will be 2.3 million observed cases of COVID-19 infections, which translates to 0.71 percent of the U.S. population. At the same time, we forecast 159,000 fatalities for the same time period. Neither new infections nor daily deaths are likely to have returned to zero by then. The uncertainty surrounding these estimates is still considerable, with deaths ranging between 140,000 to 181,000. As more data become available, the estimates of the underlying pattern of the epidemic will become more precise and the uncertainty surrounding these forecasts will decline.
Our forecasts are implicitly predicated on the assumption that the public health policies that have been put in place will not change over the course of the forecast horizon. In that sense, our forecasts provide an assessment of whether and to what extent these policies are successful. However, it is unlikely that they will continue, which will then affect the time path of the pandemic. The value of these forecasts thereby lies in highlighting the range of possible outcomes in a no-change scenario, which can serve as a benchmark to evaluate alternative public health measures against.
Paul Ho is an economist and Thomas Lubik is a senior advisor in the Research Department of the Federal Reserve Bank of Richmond. Christian Matthes is an associate professor in the Department of Economics at Indiana University.
1
We can contrast this estimate with the one reported in our Regional Matters post "Forecasting the COVID-19 Pandemic in the Fifth District" based on data up to April 20. We estimated the peak to be several days earlier and the decline in new infections much steeper. Since then, the new data seemed to cluster around a plateau that by itself would have pushed out the peak estimate further. However, our initial model specification was not well-suited to handle a data pattern that included such plateauing. We therefore modified the model slightly by including an additional parameter designed to capture this pattern, which improved fit.
This article may be photocopied or reprinted in its entirety. Please credit the authors, source, and the Federal Reserve Bank of Richmond and include the italicized statement below.
Views expressed in this article are those of the authors and not necessarily those of the Federal Reserve Bank of Richmond or the Federal Reserve System.