Skip to Main Content

Transportation and Commuting Patterns: A View from the Fifth District

By Santiago Pinto
Econ Focus
Second/Third Quarter 2019
District Digest

The transportation system is a key component of the economic performance of regions. An important role of the urban transportation system is to facilitate commuting between homes and jobs. At the national level, in 2017 commutes represented on average about a quarter of all annual vehicle trips per household. (The shares of trips that were shopping trips, recreational and social trips, and other trips for personal and family reasons were all about the same.) Economists have more data on commuters and their commutes than is commonly realized — and it's relevant to many economic questions.

National Commuting Data

The commuting and workplace data of the American Community Survey (ACS) and the Longitudinal Employer- Household Dynamics Origin-Destination Employment Statistics (LODES) are the main two sources usually considered to examine home-to-work flows. These databases, both produced by the Census Bureau, offer different but complementary information. The ACS commuting database contains information on individuals' residence and work locations, the mode of transportation, the duration of the trip, the time of the day commuters leave home for work, and the number of car, truck, or van riders. It also conveys this information according to different demographic characteristics. The LODES database describes jobs by workplace and residence location, in addition to job, employer, and worker characteristics; these include industry type, firm size, firm age, average monthly earnings, sex, race, ethnicity, and educational attainment, among others.

Table

(Click on "Enlarge" to see web-exclusive extended version of chart)

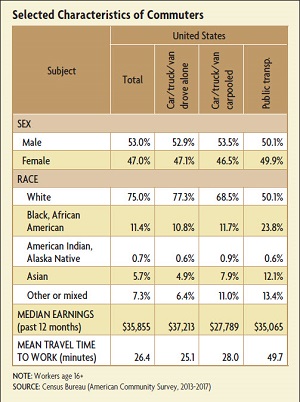
Analysis of data from the ACS reveals a few interesting facts about commuting in the United States. (See table.) Commuters using public transportation tend to be younger than those who rely on cars, trucks, or vans and drive alone. Roughly equal proportions of female and male commuters use public transportation; however, since 47 percent of all commuters are female, this implies that female workers tend to use public transportation more than male workers. Blacks or African Americans tend to rely more on public transportation than other groups. Public transportation tends to be used more by median-income workers; on average, car, truck, or van drivers who drive alone have higher incomes and those who carpool have lower incomes.

On average, Americans' travel time to work is approximately 26 minutes. It varies across modes of transportation, with public transit the slowest (almost 50-minute long commutes). The national averages, however, hide large regional variations. Locations face different geographic challenges and rely on different transport technologies associated with different travel speeds and capacity. Mean commuting times vary as a result, from 17 minutes in South and North Dakota to 33 minutes in New York. (The difference between the highest and lowest times amounts to 128 hours per year for a typical full-time worker, or 16 workdays.) In the Fifth District, mean commuting times are about 32 minutes in Maryland, 30 minutes in D.C., 28 in Virginia, almost 26 in West Virginia, and 24 in North and South Carolina.

One reason transportation systems are a complex issue is that some commuters travel outside their location of residence. This behavior introduces several challenges regarding the organization, design, and financing of the transportation system. On average, in the United States, almost 28 percent of workers commute to a different county. Workers who commute outside their county of residence rely more on public transportation than those who work in the county of residence.

Commuting in Fifth District Cities

How are the commuting patterns observed in the Fifth District different from the national averages? Focusing on three of the District's largest cities — Richmond, Va., Baltimore, Md., and Charlotte, N.C. — the commuting behavior observed in these cities differs from the national data in several ways. First, the proportion of commuters who rely on public transportation is remarkably high in Baltimore (18 percent) compared to the national average (5.1 percent) and to the other two cities (5.2 percent in Richmond and 3.5 percent in Charlotte). Second, in all three cities, public transportation is used mostly by lower-income workers, in contrast with the national pattern in which it is used more commonly by median-income workers. Third, the percentage of workers walking to work in Baltimore and Richmond is higher than the national average (about 6 percent of workers choose this alternative in the two cities, while the national average is 2.7) and lower in Charlotte (2 percent). Fourth, average commuting time is markedly higher than the national average in Baltimore (30 minutes vs. 26 minutes) and markedly lower in Richmond (22 minutes). It's about the same as the national average in Charlotte (25 minutes).

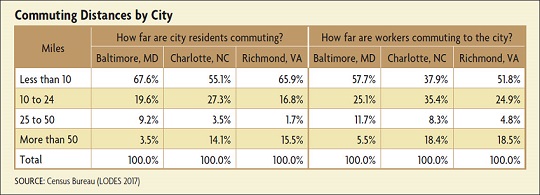
The LODES data allow us to obtain information on distance traveled by commuters for these cities. The data indicate that most Baltimore residents and most workers commuting to Baltimore travel fewer miles than the same groups of commuters in the other two cities. Commuters to and from Charlotte travel the longest distances. (See table above.) This pattern suggests that the variability of commuting times across the three cities is not driven simply by miles traveled. While commuters travel shorter distances and experience longer commuting times in Baltimore, the opposite is observed in Charlotte. Other factors, such as geographic constraints, reliance on public transportation, available transportation infrastructure, and traffic definitely play an important role in explaining such differences.

Commuting times may not depend only on decisions made by local transportation planners since commuting flows, as shown earlier at the national level, take place across local jurisdictions. Where to work and where to reside are of course mutually dependent decisions that depend not only on individuals’ preferences, but also on the availability of jobs and transportation costs. Uncovering the extent to which mobility extends beyond local political borders is crucial, therefore, to coordinate transportation planning and investment efforts.

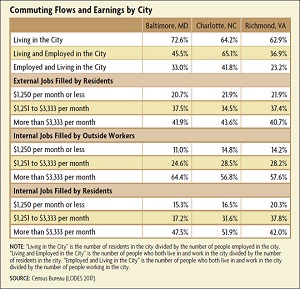
The LODES data, which contain detailed information on inflows and outflows of workers by city, allow us to quantify this phenomenon for the three cities under consideration. (See table.) The data reveal an interesting observation. The three cities clearly constitute large employment centers. In fact, the number of jobs in those cities largely exceed the number of local residents (the ratio of city residents to jobs is 72.6 in Baltimore, 64.2 in Charlotte, and 62.9 in Richmond). However, local jobs are not entirely filled by local residents (the percentage of local jobs filled by city residents is 33.3 in Baltimore, 41.8 in Charlotte, and 23.2 in Richmond). In fact, a large share of residents commute outside of the city (about 63 percent of the residents in Richmond commute outside of the city, 55 percent in Baltimore, and 35 percent in Charlotte).

The table also shows earnings obtained by city residents in jobs in and outside of the city and earnings obtained by workers commuting into the city. In all three cities, outside workers tend to work in higher-paying jobs than city residents (the percentage of workers receiving $3,333 per month or more in jobs available in the city is higher for outside workers than for city residents). Also, in all three cities, the proportion of city residents who work outside of the city in lower-income jobs (earning less than $1,250) is higher than the proportion of city residents who work in low-income jobs within the city.

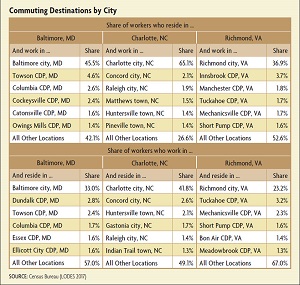
Where do residents of the cities commute to work? LODES data show some interesting distinctive behavior across cities. (See table.) First, commuting flows in and out of the three cities are very dispersed. In other words, there are several origin and destination locations, each one explaining only a minor part of the overall commuting flows in and out of the three cities. Second, the data also reveal some amount of cross-commuting among certain locations. In the case of Richmond, large commuting flows take place both to and from Mechanicsville and Tuckahoe. A similar pattern is observed in Baltimore (commuting flows from and to Towson and Columbia) and in Charlotte (commuting flows from and to Concord, Raleigh, and Huntersville).

How Urban Economists Think About Transportation

Location decisions by firms and individuals, and as a result, the use of land, involve the consideration of several factors. Accessibility, determined by the transportation system in place, is one of them. But accessibility depends, at the same time, on where firms and individuals locate. In other words, transportation and land use interact and influence one another: Changes in transportation investment affect local accessibility levels; the latter affects location choices by firms and residents, which eventually affect accessibility, and so on. As a result, when economists think about transportation, they do not consider it in isolation but as one of the components of a more general and interrelated system that includes cities and regions.

Two basic principles characterize the role of transportation in the context of cities. First, one of the main reasons for the existence of cities is that there are special advantages, usually referred to as "economies of agglomeration," to carrying out economic activities in close proximity. In other words, costs are lower when cerĀ­tain types of activities locate close to each other. Transportation is therefore critical: Anything that reduces transportation costs would allow a higher concentration of production, resulting in larger benefits from agglomeration.

Second, local wages and housing prices adjust at every location so that households and firms do not have an incentive to move; that is, wages and land prices should adjust until households and firms are indifferent between locations. When choosing where to live, individuals consider several factors, such as job opportunities, housing options, social networks, and commuting costs. Some people might choose to live far away from jobs, possibly accepting a costlier commute, because they would be compensated, in effect, by other factors such as lower housing costs.

A very specific trade-off between commuting costs and land prices emerges as a result: At locations near employment centers, commuting costs are low and land prices are high; at more distant locations, commuting costs are higher and land prices are lower. The different levels of accessibility are explained, in part, by the quality of the local transportation system.

Economic Importance of Transportation

Research in urban transportation has mainly focused on the effects of transportation on job accessibility and local economic conditions. Estimating those effects is challenging, however, precisely because of the interdependence between transportation and land use explained earlier.

In a 2011 American Economic Review article, Gilles Duranton of the University of Pennsylvania and Matthew Turner of Brown University explore the relationship between transportation infrastructure and traffic congestion. Specifically, they estimate the effect of increasing highway capacity on congestion. Their main finding is that people actually drive more when the stock of roads in their city increases. In fact, they find a one-for-one relationship between the two. It follows, then, that an increase in the provision of highways would not alleviate congestion. Their explanation of this outcome is that cities with better roads attract more people. The use of the roads would therefore increase until traffic congestion reaches its pre-existing levels. In a different article, published in 2012 in the Review of Economic Studies, the same authors examine the effect of increasing highway miles on employment growth in American cities; they find that a 10 percent increase in a city's initial stock of highways caused about a 1.5 percent increase in its employment over a 20-year period.

Between 1950 and 1990, the aggregate population of central cities in the United States declined by 17 percent, despite the fact that population increased by 72 percent in metropolitan statistical areas (MSAs). This process is generally known as suburbanization. Work by Nathaniel Baum-Snow of the University of Toronto, published in the Quarterly Journal of Economics in 2007, investigates the extent to which this phenomenon is attributable to the construction of highways, which tend to lower commuting costs. The paper finds a positive relationship between roads and suburbanization. The results indicate that one additional "ray," or segment, of interstate highway originating from the city center leads to about a 9 percent decline in the central city population. It should be noted, however, that other factors occurring at that time were inducing residents to move out of downtown areas: increases in income, a flight from blight due to crime, the degradation of housing stock, and changes in the school system.

U.S. cities show differing patterns of residential sorting by income. In most U.S. MSAs, the suburbs are of higher income status and the central cities are relatively poor. There are important exceptions, such as Chicago, Philadelphia, and others. The literature suggests different mechanisms that could explain this kind of spatial sorting of households. One such explanation focuses on transportation mode choices. In a 2008 article published in the Journal of Urban Economics, Edward Glaeser of Harvard University, Matthew Kahn of Johns Hopkins University, and Jordan Rappaport of the Kansas City Fed state that transport modes are key for explaining the central location of the poor. The reasons are twofold: First, the larger financial costs associated with owning a car may cause lower-income families to rely on other modes of transportation, such as public transit; and second, public transit is more accessible in central cities than in suburbs.

A different line of research that also focuses on job accessibility is related to the spatial mismatch hypothesis. The spatial mismatch hypothesis pioneered in 1968 by John Kain, then an economist at Harvard University, attempted to explain an apparent spatial disconnection between jobs and workers' locations. The shift of jobs predominantly toward the suburbs observed during the 1960s and 1970s hurt the labor market prospects of minorities. For different reasons, African-American populations, largely concentrated in central urban areas, were unable to relocate closer to the jobs. They experienced, as a result, either excessive commuting costs or higher and persistent unemployment levels. In Kain's view, the inability of minorities to move and follow the jobs to the suburbs was mainly due to racial discrimination in the suburban housing market.

The spatial mismatch hypothesis motivated a large body of research on job accessibility and transportation. This literature has mainly focused on determining how the lack of connection to job opportunities affects an individual's prospects in the labor market, especially low-skilled workers and minorities.

Research generally confirms the hypothesis. The main findings can be summarized as follows. First, the effect of spatial mismatch is stronger in large central urban areas, where low-skilled minorities tend to live. Jobs are generally located far away from central areas, and minorities face geographical barriers that prevent them from finding and keeping jobs. Second, the research indicates that better job accessibility significantly decreases the duration of joblessness among lower-paid displaced workers, the result being strongest for non-Hispanic, African-Americans, females, and older workers.

A corollary of these findings is that improving spatial access to jobs would lead to better labor market outcomes. Investing in transportation infrastructure and improving transportation services (increasing frequency, capacity, and so on) would increase connectivity between high-unemployment neighborhoods and locations with an abundance of jobs and help alleviate the negative consequences of the spatial mismatch.

Transportation Policies: Challenges and Opportunities

Our Related Research

"Getting Unstuck," Econ Focus, Fourth Quarter 2015. 

"Responding to Urban Decline,Economic Brief No. 17-07, July 2017

Given the durability of the transportation infrastructure, policies aimed at shaping the performance of the transportation system will have long-term implications.

Consider the process of suburbanization observed during the 1950s through the 1970s. This process is usually attributed to the interaction of three forces: a growing population, rising incomes, and falling commuting costs. The interaction of these forces would naturally lead to urban growth. But specialists such as Jan Brueckner of the University of California, Irvine believe that the failure to correct for the existence of different market imperfections may have also contributed to an excessive urban expansion, commonly referred to as urban sprawl. Distortions may arise, for instance, because commuters do not internalize the social costs of congestion when they drive on freeways or because developers, under traditional financing mechanisms, do not bear the burden of the increased infrastructure costs associated with new developments. Brueckner suggests that development taxes, congestion tolls levied on commuters, and other policies aimed at increasing urban densification may partially address some of these issues.

In fact, most economists tend to agree that the best way to reduce congestion is through congestion tolls. Yet only a few cities in the world (such as Stockholm, London, and Singapore) have implemented this policy. In general, this policy lacks political support, and other alternatives, such as taxes on gasoline, are more frequently used instead. The problem with gasoline taxes is that even though they do increase the cost of using the road, they do not necessarily alleviate congestion since drivers pay the same amount at congested and uncongested hours.

Other price-based mechanisms aimed at reducing traffic congestion involve changing the customary agreements between employers and employees. One example is the reimbursement of parking charges. Typically, workers pay for parking fees and employers would raise their wages accordingly. Under the revised approach, however, workers would be allowed to pocket the money from higher wages and take public transit to work rather than pay for parking fees.

Political reasons may also explain the implementation of less desirable and sometimes unproductive transportation policies. Some of these practices include the failure to adopt congestion pricing, a disproportionate emphasis on new road construction rather than maintaining existing infrastructure, the provision of free parking in congested cities, an overinvestment in lower-density infrastructure and underinvestment in higher-density infrastructure, the insufficient reliance on user fees, and the excessive reliance on funding from the national level, even for highly local projects.

Innovations

A number of innovations have been taking place recently in the transportation sector, and these changes are reshaping the way residents and workers interact in the job market. Examples include the growing role of ride-sourcing private transport services, such as Uber and Lyft, and the possibility to telecommute.

On-demand transport services allow a more efficient use of the existing stock of vehicles. By combining information technology with a potential large supply of vehicles and a flexible pricing mechanism, ride-sourcing services allow more efficient matching between passengers and drivers, resulting in higher levels of mobility and accessibility. Some empirical research indicates that on-demand services can improve the productivity of vehicles by about 30 to 50 percent relative to traditional taxi services. These could eventually improve congestion in high-density areas if fewer vehicles are required to satisfy similar mobility needs. Moreover, as more individuals rely on this system, fewer parking spaces would be required in central urban areas, reducing traffic caused by cars looking for vacant parking spots and allowing the allocation of this space for more productive alternatives. There is some evidence, however, that ride-sourcing services could generate more congestion in some cities. The reason is that not only have ride-sourcing services drawn commuters off trains and buses, they have also contributed to the increase in the number of waiting drivers with empty seats.

According to the American Time Use Survey, the share of workers doing some or all of their work at home was approximately 24 percent in 2018, growing from 19 percent in 2003. Workers in managerial and professional occupations were more likely than workers in other occupations to do some or all of their work at home. The basic theoretical framework used by urban economists to study location decisions by workers and firms would suggest that the rise in telecommuting should cause cities to spread out and become less dense in the center. The impact of telecommuting on the economy could, as a result, be ambiguous: While telecommuting reduces traffic congestion (and traffic pollution), it also reduces the beneficial impact of agglomeration economies on workers' productivity.

Other innovations, such as driverless cars, will likely also affect the way people commute. Their impact on the transportation system and commuting behavior is, however, unclear. The main challenge faced by policymakers is that due to the nature and underlying characteristics of the transportation system, investment and policy decisions in this area will have long-lasting effects on everyone's lives.

Subscribe to Econ Focus

Receive an email notification when Econ Focus is posted online.

Subscribe to Econ Focus

By submitting this form you agree to the Bank's Terms & Conditions and Privacy Notice.

Contact Icon Contact Us